Superconductivity and phase diagrams in 4d- and 5d-metal-doped iron arsenides SrFe2-xMxAs2 (M = Rh, Ir, Pd)
Abstract
By substituting the Fe with the 4d and 5d-transition metals Rh, Ir and Pd in SrFe2As2, we have successfully synthesized a series of superconductors SrFe2-xMxAs2 (M = Rh, Ir and Pd) and explored the phase diagrams of them. The systematic evolution of the lattice constants indicated that part of the Fe ions were successfully replaced by the transition metals Rh, Ir and Pd. By increasing the doping content of Rh, Ir and Pd, the antiferromagnetic state of the parent phase is suppressed progressively and superconductivity is induced. The general phase diagrams were obtained and found to be similar to the case of doping Co and Ni to the Fe sites. However, the detailed structure of the phase diagram, in terms of how fast to suppress the antiferromagnetic order and induce the superconductivity, varies from one kind of doped element to another. Regarding the close values of the maximum superconducting transition temperatures in doping Co, Rh and Ir which locate actually in the same column in the periodic table of elements but have very different masses, we argue that the superconductivity is intimately related to the suppression of the AF order, rather than the electron-phonon coupling.
pacs:
74.70.Dd, 74.25.Fy, 75.30.Fv, 74.10.+vI Introduction
The high temperature superconductivity found in LaFeAsO1-xFxHosono was a surprising discovery since the iron element in a compound in the most cases is a killer of superconductivity due to its strong magnetic moment. In the FeAs-based compounds, several different families have been found. In the so-called 1111 phase with the ZrCuSiAs structure, the has been quickly promoted to 56 K in thorium doped oxy-arsenide REFeAsO (RE = rare earth elements)XuzaTh and rare earth elements doped fluoride-arsenide AeFeAsF (Ae = Ca,Sr) compounds.xyzhu ; cp In the system of (Ba,Sr)1-xKxFe2As2 with the ThCr2Si2 structure (denoted as 122 phase), the maximum Tc at about 38 K was discovered.BaKparent ; Rotter ; CWCh This FeAs-122 phase provides us a great opportunity to investigate the intrinsic physical properties since large scale crystals can be grown.Canfield Furthermore, it was found that a substitution of Fe ions with Co can also induce superconductivity with a maximum Tc of about 24 K.Sefat ; XuZA Meanwhile, Ni substitution at Fe site in BaFe2As2 has also been carried out with a Tc of about 20.5 K.BaNiFeAs This is very different from the cuprate superconductors in which the superconductivity was always suppressed when the Cu sites were substituted by other elements. Very recently, superconductivity in Ru substituted BaFe2-xRuxAs2 was found.BaFe2-xRuxAs2 This indicates that, the superconductivity can be induced by substituting the Fe with not only the 3d-transition metals, such as Co and Ni, but also the 4d-transition metal, like Ru. Therefore, it is interesting to know the results of substituting Fe ions with other 4d-transition metals such as Rh and Pd which respectively locate below Co and Ni in the periodic table of elements, as well as 5d-transition metal Ir locating below Rh. In this paper, we report the successful fabrication of the new superconductors SrFe2-xMxAs2 (M = Rh, Ir and Pd) by replacing the Fe with the 4d, 5d-transition metals Rh, Ir and Pd. The maximum superconducting transition temperatures were found at about 21.9 K in SrFe2-xRhxAs2, 24.2 K in SrFe2-xIrxAs2, and 8.7 K in SrFe2-xPdxAs2. X-ray diffraction (XRD) pattern, DC magnetic susceptibility, resistivity, and upper critical field have been determined on these 4d, 5d-transition metals doped iron-arsenide superconductors. Based on these measurements, we get a series of general phase diagrams corresponding to the different doped transition metals.
II Sample preparation
We synthesized the polycrystalline samples SrFe2-xMxAs2 (M = Rh, Ir and Pd) with a two-step solid state reaction method.xyzhu2 Firstly, SrAs, FeAs and MAs (M = Rh, Ir and Pd) were prepared by a chemical reaction involving Sr pieces, Fe powders (purity 99.99%), transition metal powders (purity 99.99%) and As grains (purity 99.99%) together at 700 oC for 20 hours. Then these starting materials as well as Fe powders were mixed together in the formula SrFe2-xMxAs2 (M = Rh, Ir and Pd), ground and pressed into a pellet shape. All the weighing, mixing and pressing procedures were performed in a glove box with a protective argon atmosphere (both H2O and O2 are limited below 0.1 ppm). The pellets were sealed in a silica tube under Ar gas atmosphere and then heat treated at 900 oC for 30 hours. Then they were cooled down slowly to room temperature. A second sintering by repeating the last step normally can improve the purity of the samples.
III Experimental data and discussion
The X-ray diffraction (XRD) measurements of our samples were carried out on a MXP18A-HF equipment with a scanning range of 10∘ to 80∘ and a step of 0.01∘. The DC magnetization measurements were done with a superconducting quantum interference device (Quantum Design, SQUID, MPMS-7T). The resistance data were collected using a four-probe technique on the Quantum Design instrument physical property measurement system (Quantum Design, PPMS-9T) with magnetic fields up to 9 T. The electric contacts were made using silver paste with the contacting resistance below 0.05 at room temperature. The data acquisition was done using a DC mode of the PPMS, which measures the voltage under an alternative DC current and the sample resistivity is obtained by averaging these signals at each temperature. In this way the contacting thermal power is naturally removed. The temperature stabilization was better than 0.1 and the resolution of the voltmeter was better than 10 nV.
III.1 X-ray diffraction
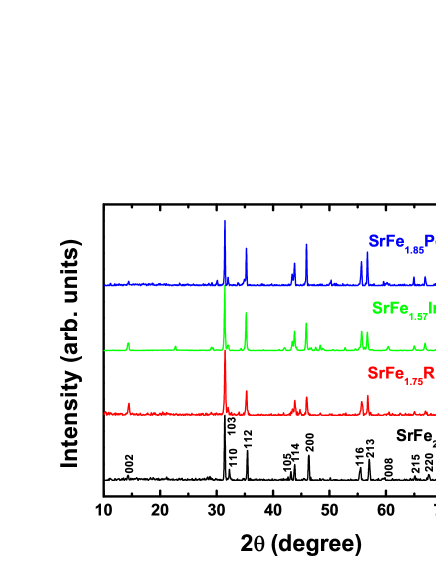
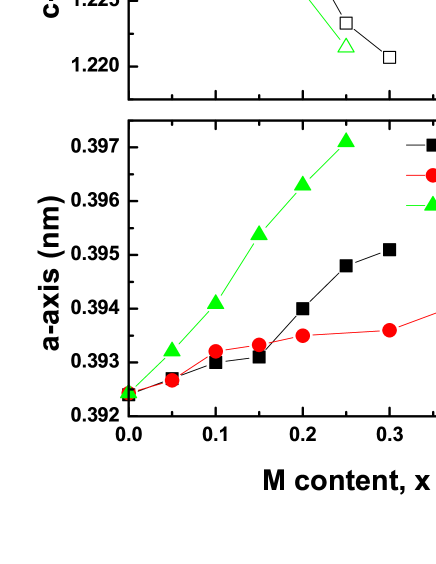
In Fig. 1 we present the x-ray diffraction patterns of the samples SrFe2As2, SrFe1.75Rh0.25As2, SrFe1.57Ir0.43As2 and SrFe1.85Pd0.15As2. The latter three samples have the highest superconducting transition temperature in their own families. All main peaks of the samples can be indexed to the tetragonal structure very well and the impurity phases are negligible. In order to have a comprehensive understanding to the evolution induced by the doping process, we have measured the X-ray diffraction patterns of almost all samples. By fitting the XRD data to the structure with the software Powder-X,DongC we get the lattice constants of SrFe2-xMxAs2 (M = Rh, Ir and Pd). The starting parameters for the fitting are taken from the parent phase SrFe2As2ParentSrFe2As2 and the program will finally find the best fitting parameters. In Fig. 2, the a-axis and c-axis lattice parameters for the SrFe2-xMxAs2 (M = Rh, Ir and Pd) samples were shown. It is clear that by substituting the Rh, Ir, and Pd into the Fe sites, the c-axis lattice constant shrinks, while the a-axis one expands. This tendency is similar to the case of doping potassium to the sites of Ba in Ba1-xKxFe2As2, or substituting the Fe with Ru in BaFe2-xRuxAs2.BaFe2-xRuxAs2 Normally a larger a-axis and smaller c-axis lattice constant would mean that the bond angle of As-Fe-As is larger. A further refinement of the structural data is underway. Concerning the very strong ZFC diamagnetic signals as shown below, the XRD data here shows no doubt that the bulk superconductivity arises from the SrFe2-xMxAs2 (M = Rh, Ir and Pd) phase. We should mention that the composition of Rh, Ir and Pd given here reflects only the nominal value, as explained in next subsection.
III.2 Scanning electron microscope analysis
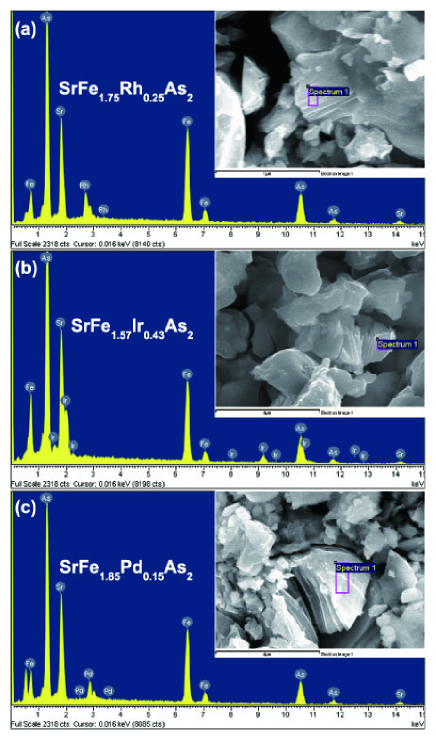
Although the lattice constants change with the nominal doping concentration systematically, it is still intriguing to check whether the dopants (Rh, Ir and Pd here) are really doped into the lattice, especially whether the true doping levels are close to the nominal ones. Actually to obtain the chemical concentration of each component in the sample is not a easy task. Here we adopt the simple and fast way, using the Energy dispersive X-ray microanalysis (EDX) spectra to do that. In the insets of Fig.3 (a)-(c) we present the scanning electron microscope pictures of three typical samples with the nominal formula SrFe1.75Rh0.25As2, SrFe1.57Ir0.43As2 and SrFe1.85Pd0.15As2. As one can see, the grains in the samples have irregular shapes and random sizes, but some have clear layered structure. The EDX spectrum on the selected grains with layered structures in the samples mentioned above are presented in the main panel of Fig.3(a)-(c). In most cases, we can easily find the expected component. The dopants (Rh, Ir and Pd) can be found in the corresponding grains. Regarding to the relative concentrations among the different components in the grains, the qualitative consistency between the nominal concentration and the analyzed one can still be followed. But the error bars of the analyzed concentrations are large (at least varying from grain to grain). The analyzed results obtained from three different grains with nominal formulas SrFe1.75Rh0.25As2, SrFe1.57Ir0.43As2 and SrFe1.85Pd0.15As2 are given in Table-I. We can see that the general trend of doping effect is followed quite well. For example, the Ir-doped sample has a maximum at the nominal doping level of about 0.43, the Ir concentration found from this typical grain is really quite high. While the Pd-doped one shows an optimized superconductivity at the doping level of 0.15, the analyzed value is relatively lower. Since the EDX results give quite large uncertainty about the concentration which also scatters a lot from grain to grain, it is not meaningful to adopt the analyzed values. Therefore in this paper we use the nominal composition, instead of the analyzed one to present our data and discussion.
Nominal Element Weight Atomic SrFe1.75Rh0.25As2 Sr 22.74 18.21 Fe 34.75 43.66 Rh 6.63 4.52 As 35.87 33.60 SrFe1.57Ir0.43As2 Sr 23.54 20.95 Fe 24.92 34.80 Ir 14.80 6.01 As 36.74 38.24 SrFe1.85Pd0.15As2 Sr 26.31 21.40 Fe 31.21 39.82 Pd 5.75 3.85 As 36.72 34.93
III.3 DC magnetization
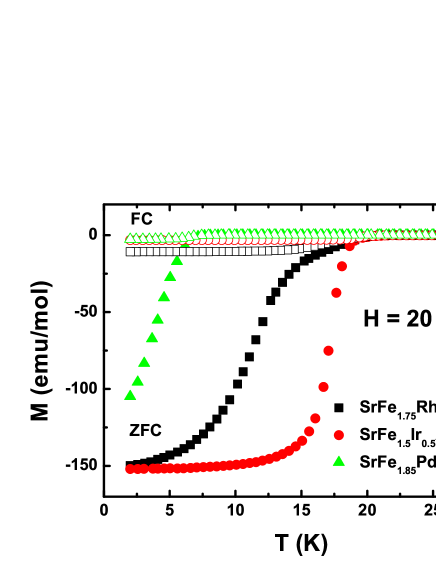
In Fig. 4 we present the temperature dependence of DC magnetization for the samples SrFe1.75Rh0.25As2, SrFe1.5Ir0.5As2 and SrFe1.85Pd0.15As2. The measurement was carried out under a magnetic field of 20 Oe in zero-field-cooled and field-cooled processes. Clear diamagnetic signals appear below 21 K for SrFe1.75Rh0.25As2, 21.6 K for SrFe1.5Ir0.5As2, and 8.2 K for SrFe1.85Pd0.15As2, which correspond to the middle transition temperatures of the resistivity data. The ZFC diamagnetic signals are very strong in the low temperature regime. Although the vortex pinning effect as well as the connectivity between the grains give some influence on the diamagnetization signal, the strong diamagnetization value here certainly signals a rather large volume of superconductivity. However, we should point out that due to the uncertainty in counting the issues mentioned above and the demagnetization factor, it is difficult to calculate the precise volume of superconductivity either from the ZFC or the FC magnetization signal. For example, in the ZFC mode, if the superconducting connectivity is good enough at the surface of a superconductor, the ZFC signal may show a full screening effect, but the inside may be non-superconductive. In the FC mode, the vortex pinning can strongly influence the signal. For an uniform sample, normally the stronger vortex pinning will lead to a smaller diamagnetization signal. Regarding the polycrystalline feature of our sample (without ideal superconducting connectivity at the surface), the large diamagnetization signal measured here may only point to a large superconducting volume.
III.4 Resistivity and phase diagrams
III.4.1 SrFe2-xRhxAs2 system
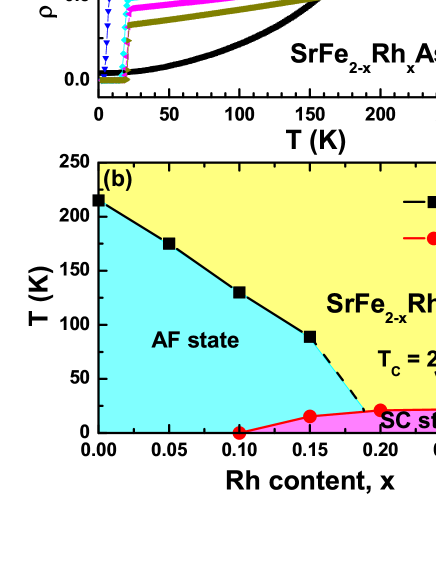
In Fig. 5(a), we present the temperature dependence of resistivity for samples SrFe2-xRhxAs2. The parent phase exhibits a sharp drop of resistivity (resistivity anomaly) at about 215 K, which associates with the formation of the AF order. As we can see, with more Rh doped into the SrFe2-xRhxAs2, the temperature of this anomaly was suppressed (see, for example the sample x = 0.05). When x increases to 0.15, superconductivity appears, while the anomaly still exists. But here the resistivity anomaly shows up as uprising, instead of a dropping down. This is slightly different from the case of Co doping, where a very small amount of Co doping will convert this sharp drop to an uprising. This difference may be induced by the two effects which give opposite contributions to the resistivity in the system: the decrease of the scattering rate as well as the charge carrier densities. In the sample of x = 0.2, the resistivity anomaly disappeared completely. Interestingly, the normal state resistivity of the superconducting sample shows a roughly linear behavior staring just above Tc all the way up to 300 K. This is difficult to be understood with the picture of phonon and impurity scattering. It is certainly illusive to know whether this reflects an intrinsic feature of a novel electron scattering. With x = 0.25, the maximal Tc at 21.9 K was found. The maximal transition temperature appears at a higher doping level here (x = 0.25) compared with the case of doping Co (x = 0.10-0.16). The underlying reason is unknown yet. However it is interesting to mention that in the Ir-doped case below, the maximal Tc appears at about x = 0.43. It is yet to be understood whether this is due to the evolution from doping with 3d (Co), 4d (Rh) and 5d (Ir) transition metals so the superconductivity comes later through 3d to 5d. We must mention that the absolute value of resistivity derived from our polycrystalline samples here may suffer a change from that of single crystals due to the grain boundary scattering and the porosity. This happens quite often in polycrystalline samples in which a larger resistivity was found when compared with the single crystal sample. We also measured the density of our three typical samples SrFe1.75Rh0.25As2, SrFe1.5Ir0.5As2 and SrFe1.85Pd0.15As2. For these samples, the ideal density calculated using the lattice constants determined in this work is 6.288 g/cm3, 7.088 g/cm3 and 6.175 g/cm3, respectively, while the true density is 5.177 g/cm3, 4.447 g/cm3 and 4.764g/cm3, respectively. Clearly the porosity volume ratio can be as high as 20-30 % in some samples. Therefore the resistivity determined here, and perhaps also in general in all other polycrystalline samples, can only tell us the qualitative characteristics. Cations must be taken when using them to estimate the intrinsic properties.
To build up the phase diagram for the three different dopants, we determined the superconducting transition temperature Tc value by a standard method, i.e., using the crossing point of the normal state background and the extrapolation of the transition part with the most steep slope. Meanwhile the Tan value was determined as the onset point of the kink in the resistivity curve in the normal state, which corresponds to the antiferromagnetic order. Based on the data, we can get an electronic phase diagram for SrFe2-xRhxAs2 within the range of x = 0 to 0.3, which is shown in Fig. 5(b). Just like other samples in the FeAs-122 family, with increasing Rh doping, the temperature of the resistivity anomaly is driven down, and the superconducting state emerges at x = 0.15, reaching a maximum Tc of 21.9 K at x = 0.25. The superconducting state even appears at the doping level of 0.3. From the diamagnetization measurements, we found that this sample has a much smaller superconducting volume compared with that of x = 0.25. As one can see, there exists a region in which the antiferromagnetic and superconductivity coexists in the underdoped side. This general phase diagram looks very similar to that of Co doping.Canfield2 ; Fisher Since Rh locates just below Co in the periodic table of elements, we would conclude that the superconductivity induced by Rh doping shares the similarity as that of Co doping.
III.4.2 SrFe2-xIrxAs2 system
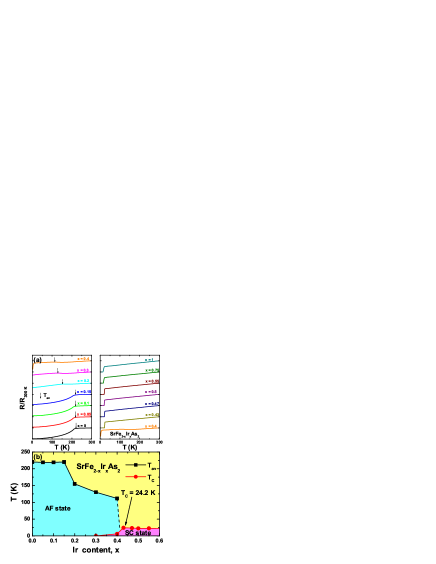
Fig. 6(a) shows the temperature dependence of resistivity for samples SrFe2-xIrxAs2 with x = 0 to 1, respectively. It is interesting that the resistivity anomaly is not suppressed while the doping level is increased from 0 to 0.15. In this region, the varied a-axis and c-axis lattice indicate that the Ir have been successfully doped into the Fe sites. When the doping level gets higher (x 0.2), the temperature of the resistivity anomaly Tan begins to drop down, and the superconductivity appears at the doping level of x = 0.4. In our superconducting samples (x 0.43), the resistivity anomaly disappeared completely. The sample with nominal composition x = 0.43 offers a maximum superconducting transition temperature at about 24.2 K which is determined in the same way as the Rh-doped case. The transition width determined here with the criterion of 10-90 is about 1.7 K. With higher doping (x 0.47) the transition temperature declines slightly. From the XRD data, we find that the samples with higher doping levels (x 0.47) contain much more impurities, therefore we are not sure whether this slight drop of superconducting transition temperature is due to the chemical phase separation or it is due to the systematic evolution of Tc vs. doping level. The normal state resistivity of the superconducting samples (x 0.43) show a roughly linear behavior near the optimized doping point, just like the Rh-doped case. Since the sample with x = 0.43 shows already a reliable quality, we would believe that this linear temperature dependence of resistivity is intrinsic and may posses itself of great importance. More data are desired to clarify this interesting feature in the normal state.
Both Tan and Tc were determined for each sample of SrFe2-xIrxAs2. Based on the data collected, we obtain a general phase diagram, as shown in Fig. 6(b). With increasing the doping level, the Tan is not driven down immediately up to x = 0.2. With higher doping(x 0.2), the antiferromagnetic order of the parent phase is suppressed, and there exists a region in which the antiferromagnetic order and superconductivity coexist in the underdoped side. When the doping level reaches 0.43, the Tc value is driven up to 24.2 K rapidly. The superconducting state even appears in a wide overdoped region from 0.47 to 1.0. Since some extra peaks from the impurity phase appears for the sample with high doping, this clearly suggests that there is a solubility limit of Ir doping. Therefore the phase diagram was drawn only up to a nominal concentration of 0.60. The general phase diagram looks similar to that of Co and Rh doping since Ir locates just below Co and Rh in the periodic table of elements. However, there are also several differences here compared with that of Co and Rh doping. First the suppression to the AF order is much weaker and it lasts to a quite high doping. The superconductivity emerges suddenly at about 0.4 and reaches the maximum Tc at x = 0.43. Furthermore the Tan(x) curve is not smooth in the underdoped region. Since here we just take this anomaly from the resistivity, it may correspond to different transitions in different doping regions. For example, in the low doping region (), it may associate with the AF/structural transition, while in the high doping region () this anomaly may correspond only to the structural transition. Thus temperature dependent structural data are needed to carry out the exact meaning of the Tan(x).
III.4.3 SrFe2-xPdxAs2 system
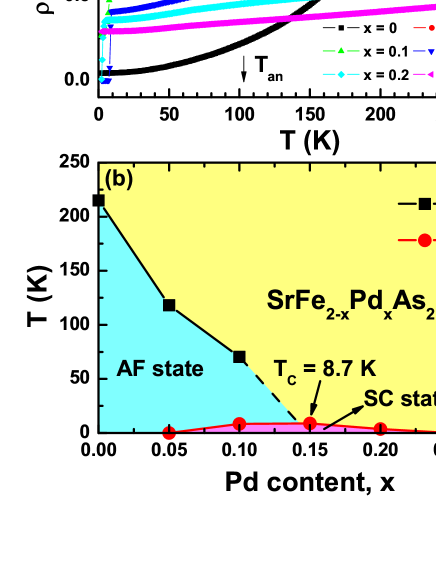
In Fig. 7(a) we present the temperature dependence of resistivity for samples SrFe2-xPdxAs2 with x = 0, 0.05, 0.1, 0.15, 0.20 and 0.25 respectively. By doping Pd to the Fe sites, the resistivity-drop was converted to an uprising. This occurs also in the Co, Rh and Ir-doped samples. We found that the superconductivity appears in the sample with nominal composition of x = 0.1. In the sample of x = 0.15, the resistivity anomaly disappeared completely. It is found that the optimal superconducting transition temperature is only about 8.7 K at a doping of x = 0.15. The transition width determined here with the criterion of 10-90 is about 1.2 K. With higher doping level (x = 0.2) the transition temperature declines slightly. The superconductivity again disappeared when the doping content x is over 0.25.
In Fig. 7(b), a phase diagram of SrFe2-xPdxAs2 within the range of x from 0 to 0.25 was given. Just like the Rh and Ir doped samples, with increasing Pd doping, the temperature of the anomaly is driven down, and the superconducting state emerges at x = 0.1, reaching a maximum Tc of 8.7 K at x = 0.15. The superconducting state disappeared at x = 0.25. As we can see, there exists an antiferromagnetic-and-superconductivity-coexisting region in the underdoped region. This is just like the Co and Rh doped cases, but different from the Ir doped case. This general phase diagram looks also similar to that of Ni doping.XuZA Since Pd locates just below Ni in the periodic table of elements, we would conclude that the superconductivity induced by Pd doping shares the same mechanism as that of Ni doping.
The maximum Tc by doping Pd is only about 8.7 K while that of other transition metal doped sample is much higher. It is still unclear why the superconducting transition temperature varies in doping different elements. In addition, in most cases, substituting transition metal elements to the Fe sites in the 1111 phase gives only a rather low superconducting transition temperature. This puzzling point certainly warrants further investigations. Our data here further illustrate that the superconductivity can be easily induced by doping the Fe ions with many other transition metals which are not restricted to the ones with 3d orbital electrons.
III.5 Upper critical field
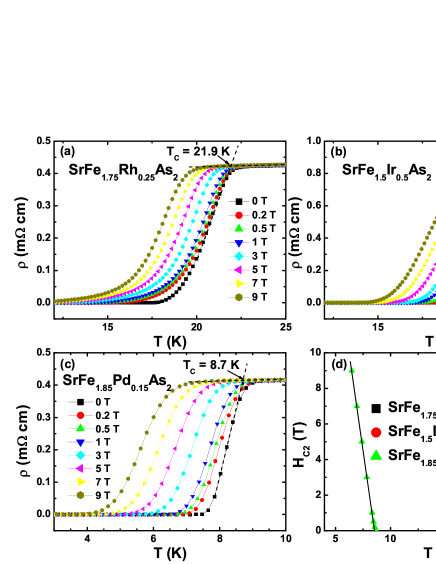
In Figs. 8(a), 8(b) and 8(c) we present the temperature dependence of resistivity for the samples SrFe1.75Rh0.25As2, SrFe1.5Ir0.5As2 and SrFe1.85Pd0.15As2 under different magnetic fields. Just as many other iron-pnictide superconductors, the superconductivity is very robust against the magnetic field. We used the criterion of to determine the upper critical field and show the data in Fig. 8(d). The Slope of -dHc2/dT is 3.8 T/K for SrFe1.75Rh0.25As2, 3.8 T/K for SrFe1.5Ir0.5As2, and 4.2 T/K for SrFe1.85Pd0.15As2, respectively. These values are rather large which indicates rather high upper critical fields in these systems. In order to determine the upper critical field in the low temperature region, we adopted the Werthamer-Helfand-Hohenberg (WHH) formulaWHH . For SrFe1.75Rh0.25As2, by taking = -3.8 T/K and = 21.9 K, and finally we have = 57.4 T. Similarly we get = 58 T for SrFe1.5Ir0.5As2 and 25.1 T for SrFe1.85Pd0.15As2. These values indicate that the present 4d, 5d-transition metal doped samples have also very large upper critical fields, as in K-dopedWangZSPRB and Co-doped samples.Jo Very recently the high upper critical fields, as a common feature in the iron pnictide superconductors, were interpreted as due to the strong disorder effect.HighHc2
III.6 Discussion
The superconductivity mechanism in the FeAs-based superconductors remains unclear yet. However, our present work and that with the Co doping may give some hints on that. First of all, the three kind of dopants (Co, Rh and Ir) reside in the same column in the periodic table of elements. The relative atomic mass of these ions are quite different: 58.9 for Co, 102.9 for Rh and 192.2 for Ir. Since these atoms are doped into the FeAs-planes, they are certainly playing important roles in governing the superconductivity. It is important to note that doping the three different atoms into the system leads to quite close maximum Tcs: 24 K for Co doping, 22 K for Rh doping and 24 K for Ir doping. In the simple picture concerning the electron-phonon coupling as the key mechanism for the pairing, the Ir-doped sample should have the lowest Tc. We can even have a brief estimate on Tc based on the electron-phonon coupling picture. For the Co-doped sample, the maximal Tc appears at about x = 0.16. In this case, we have a average mass for each Fe-site (1.84*55.8+0.16*58.9)/(2Fe) = 56/Fe. Similarly in the Rh doped case, the maximal Tc appears at about x = 0.25, the average mass is 61.7/Fe. For Ir-doping, the maximal Tc appears at about x = 0.43, the average mass is 85.1/Fe. Using the relation of the isotope effect and taking , we would have Tc (Co-doping):Tc (Rh-doping):Tc (Ir-doping) = 1: 0.95 :0.81. This is certainly far away from the experimental values. Although the phonon spectrum as well as the electron band structure will change with doping Co, Rh and Ir, above argument should be qualitatively valid. In this sense, the experimental data suggests that the three elements with very different mass lead to negligible effect on the superconducting transition temperatures. Actually our experiment naturally supports the picture that the superconductivity is established by suppressing the AF order. The related and widely perceived picture is that the pairing is through the inter-pocket scattering of electrons via exchanging the AF spin fluctuations.Mazin ; Kuroki ; WangF ; WangZD By doping electrons or holes into the parent phase, the AF order will be destroyed gradually. Instead, the short range AF order will provide a wide spectrum of spin fluctuations which may play as the media for the pairing between electrons. This picture can certainly give a qualitative explanation to the occurrence of superconductivity in the cases of doping Co, Rh and Ir.
IV Conclusions
Superconductivity has been observed in SrFe2-xMxAs2 (M = Rh, Ir and Pd). For the three different dopants, Rh, Ir and Pd, it was found that the normal state resistivity exhibits a roughly linear behavior starting just above Tc all the way up to 300 K at the optimal doping point. This may reflect a novel scattering mechanism in the normal state. The phase diagrams of SrFe2-xMxAs2 (M = Rh, Ir and Pd) systems obtained are quite similar to that by doping Co or Ni to the Fe sites. However, the suppression to the AF order in doping Ir is much slower and the superconductivity suddenly sets in at a high doping (x = 0.43). Regarding the close maximal superconducting transition temperatures in doping Co, Rh and Ir although they have very different masses, we argue that the superconductivity is closely related to the suppression of the AF order, rather than the electron-phonon coupling. Through measuring the magnetic field induced broadening of resistive transition curve we determined the upper critical field. It is found that the superconductivity in all the doped samples is rather robust against the magnetic field.
V Acknowledgements
This work is supported by the Natural Science Foundation of China, the Ministry of Science and Technology of China (973 project: 2006CB601000, 2006CB921802), the Knowledge Innovation Project of Chinese Academy of Sciences (ITSNEM).
References
References
- (1) Y. Kamihara, T. Watanabe, M. Hirano, and H. Hosono, J. Am. Chem. Soc. 130, 3296 (2008).
- (2) C. Wang, L. Li, S. Chi, Z. Zhu, Z. Ren, Y. Li, Y. Wang, X. Lin, Y. Luo, S. Jiang, X. Xu, G. Cao, Z. Xu, Europhys. Lett. 83, 67006 (2008).
- (3) X. Zhu, F. Han, P. Cheng, G. Mu, B. Shen, and H. H. Wen, Europhys. Lett. 85, 17011 (2009).
- (4) P. Cheng, B. Shen, G. Mu, X. Zhu, F. Han, B. Zeng, and H. H. Wen, Europhys. Lett. 85, 67003 (2009).
- (5) M. Rotter, M. Tegel, I. Schellenberg, W. Hermes, R. Pottgen, and D. Johrendt, Phys. Rev. B. 78, 020503(R) (2008).
- (6) M. Rotter, M. Tegel, and D. Johrendt, Phys. Rev. Lett. 101, 107006 (2008).
- (7) K. Sasmal, B. Lv, B. Lorenz, A. Guloy, F. Chen, Y. Xue, and C. W. Chu, Phys. Rev. Lett. 101, 107007 (2008).
- (8) N. Ni, S. L. Bud’ko, A. Kreyssig, S. Nandi, G. E. Rustan, A. I. Goldman, S. Gupta, J. D. Corbett, A. Kracher, P. C. Canfield, Phys. Rev. B 78, 014507 (2008).
- (9) A. S. Sefat, R. Jin, M. A. McGuire, B. C. Sales, D. J. Singh, and D. Mandrus, Phys. Rev. Lett. 101, 117004 (2008).
- (10) Y. K. Li, X. Lin, Z. W. Zhu, H. Chen, C. Wang, L. J. Li, Y. K. Luo, M. He, Q. Tao, H. Y. Li, G. H. Cao, Z. A. Xu, Phys. Rev. B 79, 054521 (2009).
- (11) L. J. Li, Q. B. Wang, Y. K. Luo, H. Chen, Q. Tao, Y. K. Li, X. Lin, M. He, Z. W. Zhu, G. H. Cao, and Z. A. Xu, New J. Phys. 11 025008 (2009).
- (12) S. Paulraj, S. Sharma, A. Bharathi, A. T. Satya, S. Chandra, Y. Hariharan, and C. S. Sundar, arXiv:cond-mat/0902.2728 (2009).
- (13) X. Zhu, H. Yang, L. Fang, G. Mu, and H. H. Wen, Supercond. Sci. Technol. 21, 105001 (2008).
- (14) C. Dong, J. Appl. Cryst. 32, 838 (1999).
- (15) M. Tegel, M. Rotter, V. Weiss, F. M. Schappacher, R. Poettgen, D. Johrendt, J. Phys.: Condens. Matter 20, 452201 (2008).
- (16) N. Ni, M. E. Tillman, J. Q. Yan, A. Kracher, S. T. Hannahs, S. L. Bud’ko, P. C. Canfield, Phys. Rev. B 78, 214515 (2008).
- (17) J. H. Chu, J. G. Analytis, C. Kucharczyk and I. R. Fisher, Phys. Rev. B 79, 014506 (2009).
- (18) N. R.Werthamer, E. Helfand, P. C. Hohenberg, Phys. Rev. 147, 295 (1966).
- (19) Z. S. Wang, H. Q. Luo, C. Ren, H. H. Wen, Phys. Rev. B 78, 140501(R) (2008).
- (20) Y. J. Jo, J. Jaroszynski, A. Yamamoto, A. Gurevich, S. C. Riggs, G. S. Boebinger, D. Larbalastier, H. H. Wen, N. D. Zhigadlo, S. Katrych, Z. Bukowski, J. Karpinski, R. H. Liu, H. Chen, X. H. Chen, L. Balicas, arXiv:cond-mat/0902.0532 (2009).
- (21) G. Fuchs, S. L. Drechsler, N. Kozlova, M. Bartkowiak, G Behr, K. Nenkov, H. H. Klauss, H. Maeter, A. Amato, H. Luetkens, A. Kwadrin, R. Khasanov, J. Freudenberger, A. Koehler, M. Knupfer, E. Arushanov, B. Buechner, L. Schultz, arXiv:cond-mat/0902.3498 (2009).
- (22) I. I. Mazin, D. J. Singh, M. D. Johannes, M. H. Du, Phys. Rev. Lett. 101, 057003 (2008).
- (23) K. Kuroki, S. Onari, R. Arita, H. Usui, Y. Tanaka, H. Kontani, H. Aoki, Phys. Rev. Lett. 101, 087004 (2008).
- (24) F. Wang, H. Zhai, Y. Ran, A. Vishwanath, D. H. Lee, Phys. Rev. Lett. 102, 047005 (2009).
- (25) Q. Han, Y. Chen, Z. D. Wang, EPL, 82, 37007 (2008).