First direct metallicity measurement of a lensed star-forming galaxy at ***Based on data collected at Subaru Telescope, which is operated by the National Astronomical Observatory of Japan.
Abstract
We present the rest-frame optical spectrum of a strongly lensed galaxy at redshift behind the cluster Abell 1689. We detect the temperature sensitive auroral line [O iii]4363, which allows the first direct metallicity measurement for galaxies at . Our high signal-to-noise spectrum indicates that the target is an extremely low metallicity star-forming galaxy, with 12 + log(O/H) = from the direct -based method. We estimate an intrinsic absolute -band magnitude of , with a stellar mass of 4.41.2108 M⊙. This galaxy extends the luminosity—metallicity relation of star-forming galaxies at by more than an order of magnitude. Given the double-nuclei like morphology and the velocity profile of H, we tentatively suggest that it could be a merger or a proto-rotating disk galaxy.
Subject headings:
galaxies: abundances — galaxies: evolution — galaxies: high-redshift1. Introduction
Five years ago, our knowledge about galaxy evolution still had a glaring gap between redshifts 1.5 and 3, termed the redshift desert. The desert is even more desolate for galaxy chemical evolution studies, where high signal-to-noise (S/N) spectra are needed for reliable measurements. However, great progress has been made in the last few years in studying galaxies at z 2 and we are beginning to harvest the “desert”. To date, metallicities are available for a few tens of individual galaxies at (Shapley et al., 2004; Erb et al., 2003, 2006; Hayashi et al., 2009). These galaxies are selected using broad-band colors either in the UV (Lyman Break technique; Steidel et al., 1996, 2003) or using , , and -band colors (BzK selection; Daddi et al., 2004). The Lyman break and selection techniques favor the galaxies that are luminous in the UV or blue and could therefore be biased against low luminosity (low-metallicity) galaxies, and dusty (potentially metal-rich) galaxies.
To date, metallicity measurements for high-redshift () galaxies have been made via indirect methods from the ratios of strong nebular lines. In local galaxies, the preferred method for determining metallicity is via the “direct” method which relies on the electron temperature sensitivity of the [O iii]4363 line. At high redshift, metallicity measurement via the direct method has not been possible because the [O iii]4363 line used to derive the electron temperature is very weak. The highest redshift that the [O iii]4363 line has been reported is at by Hoyos et al. (2005) and Kakazu et al. (2007).
Strong lensing by galaxy clusters offers an alternative tool to explore the metallicity of galaxies at high-redshift. One advantage of lensing selected galaxies is that they are immune to color and luminosity biases. Previously, only five lensed galaxies had been observed with sufficient spectral coverage and S/N to yield metallicities (Yee et al., 1996; Pettini et al., 2000, 2002; Lemoine-Busserolle et al., 2003; Nesvadba et al., 2007; Stark et al., 2008). Compared with Lyman break selected galaxies in the same redshift and luminosity range, the five lensed objects span a substantially broader metallicity range (12 + log(O/H)7.1—9.1), indicating that current metallicity history studies at (12 + log(O/H)8.4—8.8) may not be sampling the full metallicity range at this redshift. It is worth noting that the metallicity range quoted for the lensed galaxies is extremely uncertain, depending on various assumptions about reddening and metallicity calibrators. Another great advantage of gravitational lensing is its natural magnification of the source. The flux of the lensed background galaxy is commonly boosted by a factor of 1-3 mag or more around the critical lines of the cluster center. Optical spectroscopic surveys of high-z galaxies near cluster critical lines have already yielded a large catalog of lensed galaxies beyond z 1 (e.g., Broadhurst et al., 2005; Richard et al., 2008; Frye et al., 2007; Limousin et al., 2007). Unfortunately, spectra from these surveys cannot be directly utilized in metallicity studies because the commonly used metallicity diagnostic emission lines have shifted into the near infrared (near-IR) at .
With the revolutionary multi-object cryogenic near-IR spectrographs that have been recently installed on 8-10m class telescopes, high efficiency near-IR spectroscopy is now available. We carried out the first near-IR spectroscopic survey of lensed galaxies behind lensing clusters, aimed at measuring the metallicity of galaxies at . This Letter reports the rest-frame optical spectrum of a strongly lensed star-forming galaxy at behind the Abell cluster 1689 from our ongoing survey. The galaxy cluster Abell 1689 was chosen as our first target because it has the largest Einstein radius of (Broadhurst et al., 2005), and nearly 100 spectroscopically confirmed lensed images (Limousin et al., 2007). The galaxy in question is designated as ID 22.3 in the catalog of Broadhurst et al. (2005), we refer to it as Lens22.3 hereafter. Throughout we use the standard lambda cold dark matter (CDM) cosmology with km s-1 Mpc-1, and .
2. Observations and Data Reduction
The data were obtained on 2008 March 26th, using the Multi-Object InfraRed Camera and Spectrograph (MOIRCS) at Subaru (Ichikawa et al., 2006), in the spectroscopic mode (Tokoku et al., 2006). We used the low-resolution grism zJ 500 with a nominal resolution of 500 and a wavelength coverage of 0.9—1.78 m. We designed two masks targeting the spectroscopically confirmed lensed images in the field of Abell 1689. We obtained useable data for one mask. During the observation for this mask, the seeing varied between 0.3 and 0.6, and the airmass ranged between 1.1 and 1.7. Lens22.3 was placed at one of the center slits of the mask, with a slit width of and a slit length of . The telescope was nodded along the slit in a ABAB mode with a dithering length of 2.5. The exposure time for each individual frame was 400-600 seconds, resulting in a total integration time of 6800 seconds.
We reduced the data using the standard iraf and IDL routines. Sky OH lines were removed by subtracting the closest dithering pair A and B. A scaling factor between each pair was determined to optimize the sky subtraction. The sky subtracted A-B pair was flat-fielded, cleaned for comic rays, and then traced and rectified using a dome flat spectrum. The final two-dimensional spectrum was created by co-adding the reduced individual pairs. Wavelength calibration was carried out using the strong OH lines between 0.9 and 1.8 m. A F5V standard star was observed at approximately the same airmass as the target. The Telluric absorption was obtained by dividing the star spectrum with a fitted blackbody curve. The resulting stellar spectrum was then divided into the object spectrum to correct for telluric absorption.
3. Analysis and Results
3.1. Metallicity
| Ion Line | Flux | Flux (corrected) | 1 | S/N | |
|---|---|---|---|---|---|
| (1) | (2) | (3) | (4) | (5) | (6) |
| [N ii]6584 | 0.009 | 0.025 | |||
| H6563 | 1.705 | 3.12 | 5.03 | 0.4 | |
| [O iii]5007 | 1.706 | 6.45 | 6.45 | 0.3 | |
| [O iii]4959 | 1.705 | 1.98 | 1.98 | 0.3 | |
| H4861 | 1.705 | 1.0 | 1.0 | 0.1 | |
| [O iii]4363 | 1.696 | 0.27 | 0.27 | 0.1 | |
| [O ii]3727 | 1.708 | 0.95 | 1.11 | 0.3 |
Note. — (1) Detected emission lines and their rest frame wavelength. (2) Redshift calculated from the observed wavelength. (3) Measured flux, relative to H, detector response uncorrected. (4) Measured flux, relative to H, detector response corrected. (5) 1 error of the line flux from Gaussian fitting. (6) Signal-to-noise of the line flux.
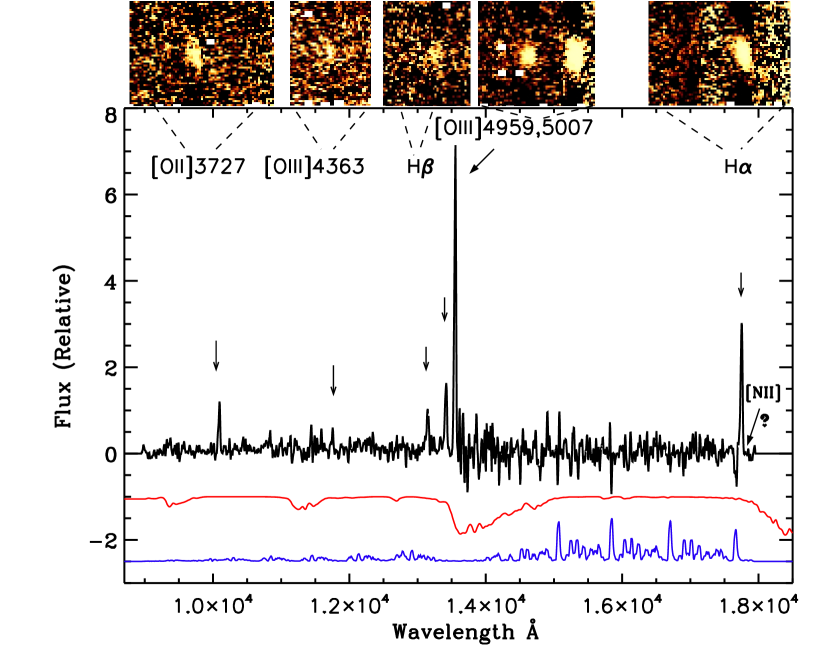
At redshift 1.7, all the rest-frame optical metallicity diagnostic lines fall into the spectral coverage of MOIRCS zJ500 grism. We have detected all the rest frame nebular emission lines from [O ii] to H, including the usually very weak [O iii]4363 line. Figure 1 shows our final two-dimensional and one-dimensional rest-frame optical spectrum of Lens22.3. Table 1 lists the measured line fluxes relative to H, the 1 error, and S/N. Since the metallicity studies use only line ratios, we did not attempt to flux calibrate the spectrum, which is nontrivial in near-IR observations. The instrument response is essentially constant for the wavelength range from [O iii]4363 to [O iii]5007. The H line lies in the region where the response has dropped by . The response on the expected [N ii] line position has dropped by , which may be the reason that there is no detection of [N ii] within 3. After correcting for instrumental response, we obtain an upper limit for [N ii]/H. Metallicities were calculated using the following two methods.
1. Strong line diagnostics. In the absence of direct measurements from electron temperature, the ratio of strong nebular lines is used to determine the oxygen abundance. The well-known discrepancies between the different line ratio indicators can be removed by converting to the same base calibration following the methods of Kewley & Ellison (2008). We use the indicator = ([O ii]3727 + [O iii]4959, 5007)/H to calculate metallicity. In our case, the upper and lower branch degeneracy of can be broken by the upper limit of [N ii]/H 0.005. In addition, the detection of the weak [O iii]4363 line almost certainly means the adoption of the lower branch. For the actual calculation, we use the lower branch calibration of McGaugh (1991) (M91 method) in the analytical form given by Kobulnicky et al. (1999). The resulting metallicity is 12 + log(O/H) = 8.0 in the M91 method. Converted to the Kewley & Dopita (2002) method (KD02), we have 12 + log(O/H) = 8.1 assuming zero extinction, or 8.3 assuming a high extinction value of E(B-V) = 0.4 (Cardelli et al., 1989; Osterbrock, 1989). The high extinction value agrees with the direct estimate from the H/H in Table 1. However, because the H line lies near the edge where the response has dropped by , the ratio of H/H can be largely uncertain because it depends sensitively on the precision of correction for the detector response. Therefore instead of using only the high extinction from H/H, we use two extreme values of extinction to quantify the range of uncertainty caused by extinction. Note that the logarithm in the definition of 12 + log(O/H) means that 10% of change in the line ratio causes only 0.04 dex change in metallicity. The uncertainty for our derived metallicity is therefore 0.1 dex prior to extinction correction.
2. Direct metallicity from electron temperature . The auroral line [O iii]4363 is often very weak, even in low metallicity environments. It is usually not observed in high metallicity galaxies without very sensitive, high S/N spectra (e.g., Garnett et al., 2004). The 3 detection of [O iii]4363 in Lens22.3 strongly suggests a low metallicity environment. The ratio of [O iii]5007, 4959 and [O iii]4363 allows a direct measurement of the oxygen abundance via electron temperature . We use the nebular package in iraf to derive the electron temperature = 2.3557 104 K, assuming an electron density ne of 100 cm-3 ( is relatively insensitive to , e.g., for = 1000 cm-3, = 2.3508 104 K). Following the procedure of Izotov et al. (2006), we obtain 12 + log(O/H) = 7.5 0.1 assuming zero extinction; or 12 + log(O/H) = 7.3 0.1 assuming a high extinction value of E(B-V) = 0.4.
The 0.6 dex discrepancy between the KD02 and method is not surprising since the metallicity measured from the direct method is systematically lower than other methods; such offsets can be as large as 0.7 dex (Liang et al., 2006; Yin et al., 2007; Nagao et al., 2006). Regardless of the offset between the two methods, both metallicity estimates indicate that Lens22.3 is low in oxygen abundance. The evidence that Lens22.3 is a star-forming galaxy instead of a narrow line AGN comes from its position on the traditional Baldwin—Phillips—Terlevich (BPT) diagram (Baldwin et al., 1981). Using the upper limit of [N ii]/H and the ratio of [O iii]/H, Lens22.3 is located on the leftmost region of the star-forming branch of the BPT [N ii] diagram, excluding its possibility of being an AGN (Kewley et al., 2006).
3.2. Photometry
We searched the Hubble Space Telescope (HST) archive and obtained the photometry for Lens22.3.
The observed AB magnitudes are 23.2 0.1, 23.6 0.2, 23.3 0.1, 23.4 0.1 and 23.1 0.1 in the ACS , , , , and NICMOS bands, respectively.
After correcting for the lensing magnification of 15.5 0.3 (provided by J. Richard 2009, private communication),
the absolute band magnitude is = -18.3 0.1 (Vega System).
A simple spectral energy distribution (SED) fitting using the kcorrect v4_1_4 code of Blanton & Roweis (2007) yields a stellar mass of
1.6 109 M⊙. Since the kcorrect may overestimate the stellar masses of high-redshift galaxies (Blanton & Roweis, 2007), we recalculated the stellar mass using the
advanced version of the code
LE PHARE (photometric redshift and simulation package; Ilbert et al., 2009) based on
population synthesis models of Bruzual & Charlot (2003).
The resulting stellar mass is 4.41.2108 M⊙.
3.3. Morphology and Kinematics
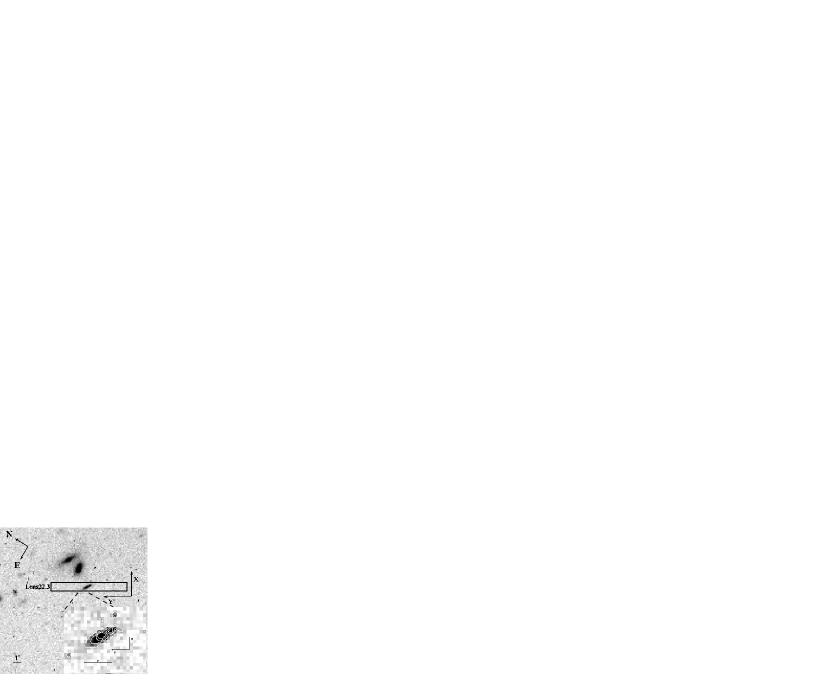
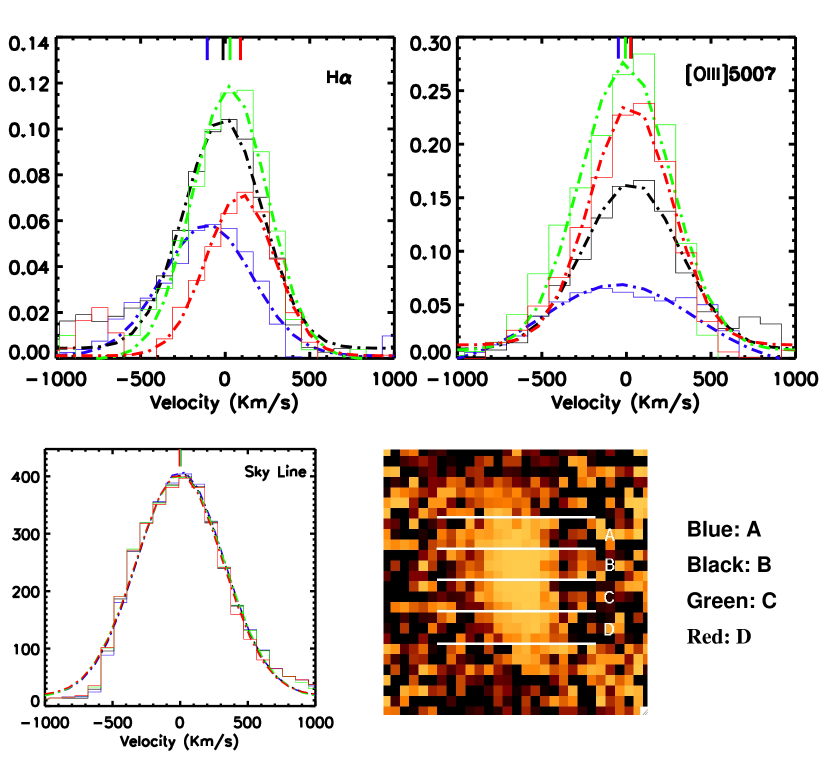
Thanks to the excellent seeing ( 0.4) and the powerful magnification of gravitational lensing, the target is spatially resolved. In Figure 2, we show the HST F775W image in the vicinity of Lens22.3. The image has been registered onto the MOIRCS chip, which has a pixel scale of 0.117 pixel-1. The MOIRCS slit layout is shown, where is the dispersion direction and is the spatial direction which is also along the elongated side of the galaxy. On the lower right corner is a zoomed image of Lens22.3, with various intensity contours overlaid. It has a clear double-nuclei-like morphology. The nuclei are separated by 0.4, corresponding to a physical scale of 3 kpc at the redshift of . The intrinsic separation will be smaller than this value because the image has been elongated by lensing effects. We divide the two-dimensional spectrum into subsections A, B, C, D along the spatial direction , using a 3 pixel bin that roughly matches the average seeing of the observation. We extract the spectrum for apertures A, B, C, D using the strongest line [O iii]5007 and H. The velocity profile relative to the center of the subsections are given in Figure 3. For comparison, the velocity profile for the sky OH line nearest to H extracted from the same apertures is also shown. There seems to be a systematic rise in the velocity from A to D in H, but not in [O iii]5007. The misalignment of the line profile in the spatial direction and the double-nuclei like morphology may indicate that the system is rotating or merging. Future follow up with integral field spectroscopy with adaptive optics is highly desirable to reveal the kinematics of the system.
3.4. Mass-Metallicity Relation
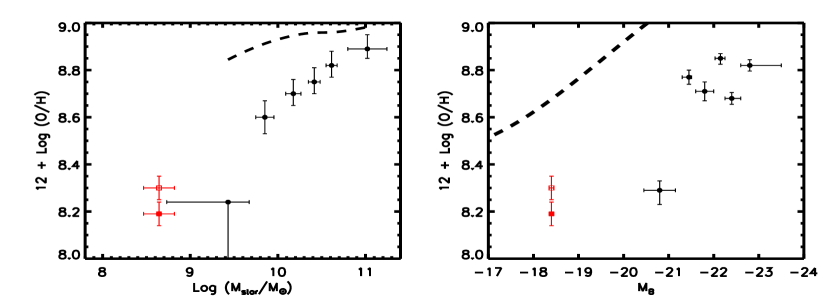
In Figure 4, we show the mass/luminosity—metallicity relation for the local (Tremonti et al., 2004) and high-redshift (Erb et al., 2006) star-forming galaxies. All metallicities in Figure 4 have been rescaled to the same KD02 method using the calibration of Kewley & Ellison (2008). The local sample of Tremonti et al. (2004) is based on 53,000 Sloan Digital Sky Survey (SDSS) star-forming galaxies and the Erb et al. (2006) sample is based on composite spectra of 87 rest-frame UV-selected star-forming galaxies at z 2. Lens22.3 is consistent with the mass/luminosity—metallicity relation of the high z sample. We evaluate the effect of extinction assuming a high extinction value of E(B-V) = 0.4. Extinction causes metallicity to rise by 0.1 dex, but it does not significantly change the position of Lens22.3 on the mass—metallicity diagram. Lens22.3 is currently the lowest mass system with direct measurement on the mass—metallicity relation diagram; Lens22.3 extends the luminosity—metallicity relation to the fainter end by more than an order of magnitude, demonstrating the capability of using gravitationally lensed samples to probe intrinsically fainter and less massive systems than are found in existing samples.
4. Summary
We reported the discovery of a low metallicity star-forming galaxy at . We detect the temperature sensitive auroral line [O iii]4363 which allows us to derive metallicity using the direct method for the first time at high redshift. The low metallicity and low luminosity/mass of the star-forming galaxy place it at the lowest end of the mass/luminosity—metallicity relation, extending the luminosity-metallicity relation by more than an order of magnitude. Our on-going near-IR spectroscopic survey of lensing clusters aims to obtain metallicities for more objects like Lens22.3 in the redshift range 1.5 z 3.
LE PHARE code for us. We recognize and acknowledge the very significant cultural role and reverence that the summit of Mauna Kea has always had within the indigenous Hawaiian community. We appreciate the opportunity to conduct observations from this sacred mountain.
Facilities: Subaru (MOIRCS)
References
- Baldwin et al. (1981) Baldwin, J. A., Phillips, M. M., & Terlevich, R. 1981, PASP, 93, 5
- Blanton & Roweis (2007) Blanton, M. R., & Roweis, S. 2007, AJ, 133, 734
- Broadhurst et al. (2005) Broadhurst, T., et al. 2005, ApJ, 621, 53
- Bruzual & Charlot (2003) Bruzual, G., & Charlot, S. 2003, MNRAS, 344, 1000
- Cardelli et al. (1989) Cardelli, J. A., Clayton, G. C., & Mathis, J. S. 1989, ApJ, 345, 245
- Daddi et al. (2004) Daddi, E., Cimatti, A., Renzini, A., Fontana, A., Mignoli, M., Pozzetti, L., Tozzi, P., & Zamorani, G. 2004, ApJ, 617, 746
- Erb et al. (2006) Erb, D. K., Shapley, A. E., Pettini, M., Steidel, C. C., Reddy, N. A., & Adelberger, K. L. 2006, ApJ, 644, 813
- Erb et al. (2003) Erb, D. K., Shapley, A. E., Steidel, C. C., Pettini, M., Adelberger, K. L., Hunt, M. P., Moorwood, A. F. M., & Cuby, J.-G. 2003, ApJ, 591, 101
- Frye et al. (2007) Frye, B. L., et al. 2007, ApJ, 665, 921
- Garnett et al. (2004) Garnett, D. R., Edmunds, M. G., Henry, R. B. C., Pagel, B. E. J., & Skillman, E. D. 2004, AJ, 128, 2772
- Hayashi et al. (2009) Hayashi, M., et al. 2009, ApJ, 691, 140
- Hoyos et al. (2005) Hoyos, C., Koo, D. C., Phillips, A. C., Willmer, C. N. A., & Guhathakurta, P. 2005, ApJ, 635, L21
- Ichikawa et al. (2006) Ichikawa, T., et al. 2006, Proc. SPIE, 6269, 38
- Ilbert et al. (2009) Ilbert, O., et al. 2009, ArXiv e-prints
- Izotov et al. (2006) Izotov, Y. I., Stasińska, G., Meynet, G., Guseva, N. G., & Thuan, T. X. 2006, A&A, 448, 955
- Kakazu et al. (2007) Kakazu, Y., Cowie, L. L., & Hu, E. M. 2007, ApJ, 668, 853
- Kewley & Dopita (2002) Kewley, L. J., & Dopita, M. A. 2002, ApJS, 142, 35
- Kewley & Ellison (2008) Kewley, L. J., & Ellison, S. L. 2008, ApJ, 681, 1183
- Kewley et al. (2006) Kewley, L. J., Groves, B., Kauffmann, G., & Heckman, T. 2006, MNRAS, 372, 961
- Kobulnicky et al. (1999) Kobulnicky, H. A., Kennicutt, Jr., R. C., & Pizagno, J. L. 1999, ApJ, 514, 544
- Lemoine-Busserolle et al. (2003) Lemoine-Busserolle, M., Contini, T., Pelló, R., Le Borgne, J.-F., Kneib, J.-P., & Lidman, C. 2003, A&A, 397, 839
- Liang et al. (2006) Liang, Y. C., Yin, S. Y., Hammer, F., Deng, L. C., Flores, H., & Zhang, B. 2006, ApJ, 652, 257
- Limousin et al. (2007) Limousin, M., et al. 2007, ApJ, 668, 643
- McGaugh (1991) McGaugh, S. S. 1991, ApJ, 380, 140
- Nagao et al. (2006) Nagao, T., Maiolino, R., & Marconi, A. 2006, A&A, 459, 85
- Nesvadba et al. (2007) Nesvadba, N. P. H., et al. 2007, ApJ, 657, 725
- Osterbrock (1989) Osterbrock, D. E. 1989, Astrophysics of gaseous nebulae and active galactic nuclei (Mill Valley, CA: Univ. Science Books), 422
- Pettini et al. (2002) Pettini, M., Rix, S. A., Steidel, C. C., Adelberger, K. L., Hunt, M. P., & Shapley, A. E. 2002, ApJ, 569, 742
- Pettini et al. (2000) Pettini, M., Steidel, C. C., Adelberger, K. L., Dickinson, M., & Giavalisco, M. 2000, ApJ, 528, 96
- Richard et al. (2008) Richard, J., Stark, D. P., Ellis, R. S., George, M. R., Egami, E., Kneib, J.-P., & Smith, G. P. 2008, ApJ, 685, 705
- Shapley et al. (2004) Shapley, A. E., Erb, D. K., Pettini, M., Steidel, C. C., & Adelberger, K. L. 2004, ApJ, 612, 108
- Stark et al. (2008) Stark, D. P., Swinbank, A. M., Ellis, R. S., Dye, S., Smail, I. R., & Richard, J. 2008, Nature, 455, 775
- Steidel et al. (2003) Steidel, C. C., Adelberger, K. L., Shapley, A. E., Pettini, M., Dickinson, M., & Giavalisco, M. 2003, ApJ, 592, 728
- Steidel et al. (1996) Steidel, C. C., Giavalisco, M., Pettini, M., Dickinson, M., & Adelberger, K. L. 1996, ApJ, 462, L17
- Tokoku et al. (2006) Tokoku, C., et al. 2006, Proc. SPIE Conf. Ser., 6269, 62694N
- Tremonti et al. (2004) Tremonti, C. A., et al. 2004, ApJ, 613, 898
- Yee et al. (1996) Yee, H. K. C., Ellingson, E., Bechtold, J., Carlberg, R. G., & Cuillandre, J.-C. 1996, AJ, 111, 1783
- Yin et al. (2007) Yin, S. Y., Liang, Y. C., Hammer, F., Brinchmann, J., Zhang, B., Deng, L. C., & Flores, H. 2007, A&A, 462, 535