Ultraviolet Spectroscopy of Supernovae:
The First Two Years of Swift Observations
Abstract
We present the entire sample of ultraviolet (UV) spectra of supernovae (SNe) obtained with the Ultraviolet/Optical Telescope (UVOT) on board the Swift satellite during the first 2 years of observations (2005/2006). A total of 29 UV-grism and 22 V-grism spectra of 9 supernovae (SNe) have been collected, of which 6 are thermonuclear (type Ia) and 3 core collapse (type Ibc/II) SNe. All the spectra have been obtained during the photospheric phase. After a comparison of the spectra of our sample with those in the literature (SNe 1992A, 1990N and 1999em), we confirm some degree of diversity in the UV emission of Type Ia SNe and a greater homogeneity in the Type II Plateau SN sample. Signatures of interaction between the ejecta and the circumstellar environment have been found in the UV spectrum of SN 2006jc, the only SN Type Ib/c for which UVOT grism data are available. Currently, Swift UVOT is the best suited instrument for early SN studies in the UV due to its fast response and flexible scheduling capabilities. However, in order to increase the quality of the data and significantly improve our understanding of the UV properties of SNe and to fully maximize the scientific potential of UVOT grism observations, a larger investment in observing time and longer exposures are needed.
1 Introduction
Important information on the explosion physics, progenitors, and environments of supernovae (SNe) can be obtained from the analysis of ultraviolet (UV) observations. The UV emission of SNe is strong in the early stage after explosion, when the ejecta are hot and dense and the photosphere is located in the outer layers. This makes UV data uniquely suited to study the outer layers of the progenitor, and thus understand its structure before explosion. A better understanding of the UV properties of nearby SNe is also fundamental for the cosmological use of high- SNe, both those presently discovered by ground-based wide-field surveys or by the Hubble Space Telescope (HST), and those expected to emerge from the next generation of space missions such as JWST and JDEM. This is because the optical and IR observations of high- SNe actually sample the rest-frame UV emission. An adequate understanding of the UV emission of local SNe Ia and its time evolution will help to settle, for example, possible evolutionary biases with cosmic age in SNe Type Ia, allowing us to continue to use them as reliable distance indicators. Recently Foley et al. (2008a) and Ellis et al. (2008) indicated the paucity of high quality UV data of local SNe as the main limitation of their comparative analysis with the high-z SNe, concluding that an intense campaign of acquisition of new UV data is urgently needed.
Thirty years after early systematic SN observations with the International Ultraviolet Explorer (IUE), the sample of SNe observed in the UV is still small. Currently, good quality UV data are available only for a few events per SN type. IUE took UV spectra of 23 SNe over its entire mission lifetime (Cappellaro et al., 1995), while HST collected data for 8 and 11 SNe with FOS and STIS, respectively, and low resolution spectra of 4 SNe with the ACS UV prism after the failure of STIS. A complete review of UV observations of SNe was given by Panagia (2003, 2007) pointing out the necessity of a larger UV sample of local SNe, in order to address the issue of similarity or diversity among both thermonuclear and core collapse SNe in the UV range.
A comprehensive study of the UV properties of SNe is the main goal of an observing program established with the Swift satellite. Because of the fast response and flexibility in terms of scheduling, a design requirement for the study of Gamma-Ray Bursts (Gehrels et al., 2004), Swift is uniquely suited for such a program. Swift also offers simultaneous coverage over a wide spectral range, spanning from the X-ray to the optical bands and thus providing information that cannot be obtained from ground-based telescopes or any other instrument alone.
In this paper we present the catalog of UV spectroscopic observations of SNe obtained with Swift until December 2006. In § 2, we present a brief overview of our present understanding of the origin of UV emission for different SN types. A brief description of the capabilities of Swift, focusing on the UV wavelength range, and of the data reduction procedures are given in § 3. In § 4, the observed SN sample is presented, and the data analysis is described in § 5. Conclusions are drawn in § 6.
2 Origin Of The Ultraviolet Flux
In this section we summarize the scenarios proposed for the UV flux production for the two main SN classes (thermonuclear vs core collapse). The available data gathered by IUE and HST seem to point to similar behaviors in the UV for Type Ia and Type Ib/c SNe (Panagia, 2003) which are therefore discussed together.
2.1 Type I Supernovae
The UV flux production of Type Ia and Ib/c SNe is only a small fraction of the total emitted flux. The UV photons, produced in the deep layers of the ejecta, are absorbed almost entirely by a forest of transition lines of heavy elements such as Ti, Cr, Fe, Co and Ni in their single and doubly ionized species (Pauldrach et al., 1996), and re-emitted at lower energies, emerging in the red part of the spectrum where the opacity is smaller. In addition, because of the expansion of the SN atmosphere (–), each line occupies a much more extended wavelength range than in a normal stellar atmosphere. Therefore each UV photon is scattered from line to line by the gas, being progressively redshifted until it finds a ”window” to escape. This wavelength window is typically in the red where the scattering lines are less numerous and optically thick (Fransson, 1994).
In particular, by modelling Type Ia SNe observed spectra, it has been found that the UV emission originates predominantly from reverse fluorescence in iron group ions which converts photons from red to blue wavelengths in the outermost layers of the SN ejecta. Here the UV opacity is sufficiently small that photons can escape (Lucy 1999; Mazzali 2000). Therefore the emerging UV spectrum depends mainly on the chemical composition of the outer layers of the ejecta. Lentz et al. (2000) suggested a dependence between the emitted flux and the progenitor metallicity. In their modeling they found that the flux was lower and the spectral lines blue-shifted for increasing metal content. On the other hand, in a recent work and similarly to Hoeflich et al. (1998) (who focused the analysis mainly on the metallicity effects on the light curve shapes), Sauer et al. (2008) found that under certain conditions the UV flux may actually increase with metallicity. This behavior appears to reflect an enhanced probability of the reverse-fluorescence process and a change in the ionization fraction (“backwarming” effect) as a consequence of higher metal content in the outer layers. The distribution of metals and their degree of mixing (Blinnikov & Sorokina, 2000), as well as the kinematics of the layers in which the UV spectrum is produced, depend on the explosion mechanism (Hillebrandt & Niemeyer, 2000). Thus, the very early UV emission can provide unique information about the progenitor nature and the explosion mechanism of SNe Ia.
2.2 Type II Supernovae
In Type II SNe, the UV emission represents the main fraction of the flux emitted immediately after the explosion. In general during the collapse of the progenitor core, a shock wave is generated that propagates through the star and ejects the envelope. As the shock wave emerges at the surface of the star, very bright UV and X-ray emission flashes are expected (Ensman & Burrows 1992, Blinnikov & Bartunov 1993, Blinnikov et al. 1998), lasting a brief period of time, from about 5 minutes for a blue supergiant (BSG) progenitor to about one hour for the largest red supergiants (RSG; Levesque et al. 2005). The short initial burst is then expected to be followed by a bright, post-breakout UV plateau phase lasting for about two days as a result of the competition of two main effects: the cooling of the SN ejecta, due to the expansion and the emission of radiation which produces the shift of the spectral energy distribution (SED) to longer wavelengths, and the strong decrease of the bolometric luminosity.
X-ray and UV emission from shock breakouts have been detected with Swift for the Type Ic SN 2006aj ( initially indicated as a X-Ray Flash, later recognized as a SN, Campana et al. 2006, Waxman et al. 2007) and the Type Ib SN 2008D (Soderberg et al. 2008, Mazzali et al. 2008, Modjaz et al. 2008). In both cases the time duration and radii of the emitting sources are consistent with a shock breakout mediated by a dense stellar wind. Alternatively, a jet breakout scenario for SN 2008D (Mazzali et al., 2008) and non-thermal synchrotron emission for SN 2006aj (Ghisellini et al., 2007) have been suggested. The emission from the shock breakout was recently observed with GALEX for a Type II-P SN (SNLS04D2dc, Schawinski et al. 2008), revealing as well that the UV flux received during the initial hours is associated to the radiative precursor of the shock, thus produced long before the latter reaches the surface. Serendipitously detected UV plateau phases associated with the early breakout phase in two Type II Plateau SNe with the Galaxy Evolution Explorer (GALEX) have also been reported (Gezari et al., 2008).
A few days after the explosion, when the UV emission is already fading, the SN becomes brighter in the optical domain and so more easily discoverable by robotic and other ground-based optical telescopes. With the lower temperature, as in Type I SNe, line blanketing becomes important because of the high density of lines of low ionization stages of iron group elements (especially FeII and FeIII; Mazzali 2000; Dessart & Hillier 2005, 2006). The UV is therefore directly linked to the metal content of the SN ejecta and to their rapidly changing conditions at early phases.
In the cases of SNe 1979C and 1980K, early spectra were characterized by an UV excess below 1500 Å and by emission lines of highly ionized species (e.g. N V, N III and Si IV; Benvenuti et al. 1982; Panagia et al. 1980). Fransson et al. (1984) suggested that such UV excess may originate from the interaction between the supernova ejecta and the pre-existing circumstellar material (CSM). Just behind the outward moving shock front energetic, thermal electrons (T K) are produced which give rise to soft X-ray emission. Inverse Compton scattering by these electrons becomes the main source of the energy of narrow-line UV emission, causing the ionization and excitation of the species in the outer layers of the SN envelope. At the same time, the radiation from the shock wave dominates the continuum below 1500 Å. The ejecta-CSM interaction has been used also to explain the UV emission detected at late phases in some CC SNe (Panagia et al. 1980, Fesen et al. 1999, Immler et al. 2005, Fransson et al. 2002, 2005). UV emission can therefore reveal the structure of the SN environment, which is directly linked to the final phases of the pre-SN evolutionary history.
3 UV Spectroscopic Capabilities of Swift and Data Reduction
3.1 Overview
Swift has three instruments that operate simultaneously: the Burst Alert Telescope (BAT; Barthelmy et al. 2005), the X-ray Telescope (XRT; Burrows et al. 2005) and the Ultraviolet/Optical Telescope (UVOT; Roming et al. 2005). The latter is the instrument of interest in this study.
Poole et al. (2008) have recently compared UVOT with the three other orbiting missions that have UV capabilities, i.e. the XMM-Newton Optical Monitor (OM; Mason et al. 2001), the GALEX (Milliard et al., 2001; Bianchi & The GALEX Team, 2000) and HST with the Wide-Field Planetary Camera 2 (WFPC2; Burrows 1994). UVOT has a considerably higher spatial resolution ( FWHM) than GALEX and larger field of view () than HST. Paired with its fast response time (hours), UVOT is a prime instrument to observe transient phenomena such as SNe. Swift also has flexible scheduling capabilities that allow frequent visits to a target and extensive monitoring campaigns to follow a target’s temporal evolution in unprecedented detail.
UVOT is a Ritchey-Chrétien reflector telescope with a 30 cm primary mirror. It uses a microchannel-intensified CCD (MIC) detector, a photon-counting device capable of detecting very faint signals. Through a filter wheel it provides imaging in six different bands (uvw2, uvm2 and uvw1 in the UV; u, b and v in the optical) spanning the wavelength range 1700–6500 Å. Low resolution spectroscopy can be obtained with two grisms. A UV-grism provides spectra of moderate signal-to-noise ratio per pixel (S/N 10–15) for objects in the magnitude range –15 mag over 1700–2900 Å with a resolution R150, comparable to low resolution IUE spectra. UV-grism spectra actually extend long-ward of 2900 Å, but above this wavelength the second-order overlaps the first order spectrum. The V-grism covers the wavelength range from 2800 to 5200 Å with a lower resolution (R75), and thus a slightly higher S/N (15–20 per pixel), down to fainter magnitudes (13–17 mag)111See UVOT Grism Notes at for a comparison of the sensitive areas of the two different grisms.. The contamination of the first-order UV spectra by zeroth-order from nearby sources can be minimized by using clocked mode observations. With this mode, zeroth-order spectra only appear in the area covered by the grism, whereas first-order spectra are dispersed off the edge of the grism.
3.2 Data Reduction
Because of the low-Earth orbit of Swift, most grism observations are composed of a sequence of multiple exposures with times ks. We have chosen to reduce and combine only the deepest of these observations that have a better S/N. First, each raw grism image is corrected for the modulo-8 fixed-pattern noise, produced by the on-board algorithm used to read out the CCD at high rate and to calculate the centroid position of the incoming photon splash (Roming et al., 2005). From the zeroth-order position of the chosen source, called anchor point, with an automated tool the user selects the area in the grism image that contains the first-order spectrum, which is then extracted and calibrated in wavelength and flux. We use Swift calibration files computed by using spectrophotometric standard stars, as discussed by Breeveld et al. (2005) and made available by the UVOT instrument team on the Swift web site. The above method provides reliable spectral extractions and calibrations for most UVOT targets but not for SNe that are contaminated by strong emission from the host galaxies. We therefore performed an interactive extraction for all SN spectra using the APALL package in IRAF 222IRAF, the Image Reduction and Analysis Facility, is distributed by the National Optical Astronomy Observatory, which is operated by the Association of Universities for Research in Astronomy, Inc. (AURA) under cooperative agreement with the National Science Foundation (NSF).. While this interactive procedure is time consuming, it allows a considerable improvement compared to the automatic extraction routine. An example is the grism spectrum of SN 2005cs, taken on 2005-07-06.29 UT, for which we were able to recover the spectral range 2200–2600 Å (Fig. 11) that was lost by Brown et al. (2007, their Fig. 3) because of contamination by the zeroth-order spectrum of a nearby field star.
Because the non-negligible dispersion of the zeroth-order spectrum gives a poor anchor point reference, wavelength calibration is not a trivial task in grism spectroscopy. In the case of Swift there is the additional complication of a drift of up to 2′′ between consecutive exposures which prevents the use of existing, previous direct imaging to fix the position of the source, and hence the wavelength anchor point. Therefore, such reference point is best determined by the centroid of the zeroth-order. The issue becomes even more troublesome for SNe, since their SED is different from that of the stars, typically used to calibrate the wavelength scale (usually White Dwarfs with black-body like spectra), and evolve with time. Consequently, the centroid of the zeroth-order spectrum can shift with respectof the UVOT spectra to the reference value introducing an error of several Angstrom in the wavelength calibration. This problem affects the SN spectra presented in this paper as well as all previously published SN spectra obtained with Swift.
The check of the wavelength calibration has been done by performing an automatic cross-correlation of the UVOT spectra with ground-based spectra, where available. Only quasi-simultaneous spectra are considered ( day) excluding time evolution effects in the calibration process. We measured anchor point offsets in the range from 0 to 66 Å ( Å) finding that they are not systematic and do not depend on the SN evolutionary phase. In § 5, we report the estimated offset values for each SN spectrum.
The wavelength scale of the UVOT grisms varies nonlinearly with detector
position, and this effect can be significant for large (100 pixel)
shifts. In order to overcome this problem, all Swift spectra were taken
with the SN in the same position on the detector (50 pixels), by mean of a
second slew.
Using a model of the nonlinearities with the detector position,
we estimated a residual of 1.5 A between 2500 A and 5000 A.
Finally in order to obtain the absolute flux calibration of each spectrum, we compared the simultaneous Swift broad-band magnitudes to the synthetic ones obtained convolving each spectrum with the transmission curve of the considered filter. Subsequently, we scaled the spectrum for the average value found for all the available filters. Broad-band magnitudes are reported in the following spectrograms as filled dots at the corresponding Vega-effective wavelengths (Poole et al., 2008). The UVOT photometry collected in these first two years was taken from Brown et al. (2008), Milne et al. (in preparation) for SNe Ia, Dessart et al. (2008) for SN 2005cs and 2006bp [updated by Brown et al. (2007) and Immler et al. (2007), respectively], and Modjaz et al. (in preparation) for SN 2006jc. Recently Swift photometry of SN 2005cf has been presented in the comprehensive work by Wang et al. (2008b).
4 Supernova Sample
Target selection criteria were used to maximize the scientific return of the UVOT observations. A SN suitable to be observed by UVOT (either in imaging or grism mode) should have the following properties: (i) young, i.e., discovered before maximum in the optical, (ii) nearby (z 0.01), (iii) low interstellar extinction along the line of sight ( mag), (iv) favorably located (distance from the host galaxy nucleus or bright field stars), and (v) low impact on Swift gamma-ray burst (GRB) studies (Sun angle ; angle from recent GRB ). These criteria led to the observation of 32 SNe with Swift UVOT during the first two years (2005–2006). For grism observations, an additional constraint on the target brightness (optical mag) was adopted that limits the sample of spectroscopic observations to 9 SNe. A brief introduction to these 9 individual SNe is given below; a summary of their main properties and the journal of UVOT grism observations are reported in Tables 1 and 2, respectively.
SN 2005am was discovered by Martin et al. (2005) in images taken on 2005-02-22.73 and 2005-02-24.58 UT and confirmed one week later by Yamaoka et al. (2005). An optical spectrum obtained on 2005-03-03.29 UT showed it to be a SN Ia, one or two weeks before maximum (Modjaz et al., 2005a). Swift grism observations were taken between 2005-03-08 and 2005-03-24 UT. Five spectra were obtained both with the UV and the V-grism, for a total of 10 spectra. A preliminary analysis was presented by Brown et al. (2005). Of all UV-grism exposures, only the spectrum taken on JD 2453439.1 turned out to be useful because of contamination with a nearby field star. The light curve shows that the -band maximum occurred on JD 2453438 1 day (Brown et al., 2005).
SN 2005cf was discovered with the Katzman Automatic Imaging Telescope (KAIT) in unfiltered image taken on 2005-05-28.36 UT (Pugh & Li, 2005) and classified as a SN Ia about ten days before maximum light on 2005-05-31.22 UT (Modjaz et al., 2005b). Twelve UV grism and ten V-grism observations were obtained with Swift between 2005-06-04 and 2005-06-29 UT. The observations are the most detailed campaign of a SN obtained with UVOT so far. A -band maximum on JD 2453534.0 0.3 day (Pastorello et al., 2007a) is adopted in this paper.
SN 2005cs was discovered on 2005-06-28.90 UT by Kloehr et al. (2005) and classified as a young SN II by Modjaz et al. (2005c). On the basis of pre-discovery limits, Pastorello et al. (2006) estimated that the explosion occurred on 2005-06-27.5 UT (JD=2453549 1). Swift observations began on 2005-07-03 and ended on 2005-07-19 UT. A total of 6 UV-grism and 2 V-grism spectra were collected which have been presented and discussed in Brown et al. (2007).
SN 2005df was discovered by Evans (2005) on 2005-08-4.62 UT. Salvo & Schmidt (2005) classified it as a peculiar SN Ia a few days before maximum light based on a spectrum obtained on 2005-08-05.83 UT with the Australian National University (ANU) 2.3-m telescope (wavelength range 390–700 nm). No light curve has yet been published to date and no UVOT photometry was collected in the optical bands, leaving the epoch of -band maximum unconstrained. Unfiltered observations reported on the SN Web333See http://astrosurf.com/snweb2/2005/05df/05dfMeas.htmhttp://astrosurf.com/snweb2/2005/05df/05dfMeas.htm suggest that SN 2005df peaked around 2005-08-18.1 UT (JD 2453600.6). UV-grism observations were obtained on four epochs, starting on 2005-08-11 UT.
SN 2005hk was discovered by the Lick Observatory Supernova Search (LOSS) on 2005-10-30.25 UT (Burket & Li, 2005). Initially, SN 2005hk was classified as a SN Ia one or two weeks before maximum light, similar to SN 1991T (Serduke et al., 2005). The unusually low expansion velocity (6000–7000 km s-1) suggested that SN 2005hk was a SN 2002cx-like object which was confirmed by a spectrum taken by the Carnegie Supernova Project on 2005-11-23.2 UT (Chornock et al. 2006, Stanishev et al. 2007, Sahu et al. 2007, Phillips et al. 2007). Only one UV-grism spectrum was taken with Swift on 2005-11-08 UT, about 3 days before maximum in the -band (JD 2453685.1 0.5 days, Phillips et al. 2007) at which time it was already rapidly fading in the UV (Brown et al., 2008).
SN 2005ke was discovered on 2005-11-13.33 UT by KAIT (Baek et al., 2005) and later classified as an under-luminous SN Ia from the presence of the characteristic 4200 Å Ti II band (Patat et al., 2005). We assume JD 2453699 2 days as the epoch of the -band maximum on the basis of Swift/UVOT photometric observations (Immler et al., 2006a). One V-grism and three UV-grism spectra of low S/N before maximum were collected. Therefore, we have no insight into the spectroscopic UV properties or nature of the UV excess seen in the light curves starting 15 days after maximum (Immler et al., 2006a).
SN 2006X was discovered independently by Suzuki and Migliardi on 2006-02-07.10 UT (Suzuki & Migliardi, 2006). Soon thereafter, Quimby et al. (2006a) classified it as a very young SN Ia. The spectral features are similar to those of SN 2002bo (Benetti et al., 2004) 1–2 weeks before maximum light, but with a red continuum. Prompt imaging obtained with Swift (Immler, 2006b) revealed only weak emission at short wavelengths, likely due to strong interstellar absorption in the host galaxy. As a consequence, only V-grism spectroscopy was obtained about 10 and 1 day before maximum (occurred on 2006-02-19.93 UT, JD 2453786.2, Wang et al. 2008a). Variability in narrow features of the Na I D lines has revealed the existence of CSM suggesting that the white dwarf was accreting material from a companion star during the red-giant phase (Patat et al., 2007).
SN 2006bp was discovered on 2006-04-09.60 UT (Nakano et al., 2006a). Immler et al. (2006c) classified it as a young SN II on the basis of the and colors measured with UVOT (Brown et al., 2008). This classification was confirmed by a HET spectrum taken two days later (Quimby et al., 2006b). The spectrum of SN 2006bp showed a blue continuum with a narrow emission line consistent with rest-frame H. Seven UV-grism spectra were taken between 3 and 14 days after the explosion, which is assumed to have occurred around 2006-04-09 UT (Quimby et al. 2006b, Immler et al. 2007). Strong contamination due to bright field stars affected the early spectra, but using the ’clocked’ grism mode (see § 3.2), two useful follow-up UV spectra were obtained. A single V-grism observation was also taken on 2006-04-21 UT.
SN 2006jc was discovered in UGC 4904 by Nakano et al. (2006b) on 2006-10-9.75 UT. An upper limit was obtained earlier on 2006-09-22 UT, but a possible precursor eruption was registered two years prior to the SN (Nakano et al. 2006b, Pastorello et al. 2007b). Because of the lack of H features and the presence of narrow He I emission lines superimposed on a broad-line spectrum, SN 2006jc was defined as a peculiar Ib object (e.g., Crotts et al. 2006, Fesen et al. 2006, Benetti et al. 2006, Modjaz et al. 2006, Pastorello et al. 2007b, Foley et al. 2007). Benetti et al. (2006) highlighted the similarity with other rare events, namely SN 1999cq (Matheson et al., 2000) and 2002ao (Filippenko & Chornock, 2002). According to Immler et al. (2008), the SN explosion occurred on 2006-09-25 UT ( 5 days). Recently, Pastorello et al. (2008) discussed the physical properties of this class of objects. For SN 2006jc, we obtained three UV-grism and three V-grism spectra, but only one of them was not contaminated by the zeroth-order spectrum of a field star.
5 Results and Discussion
In this section we group the targets into two samples: 6 thermonuclear and 3 core collapse SNe for a total of 9 SNe for which Swift/UVOT spectra are available. For each SN we study the spectral evolution before and after maximum light while focusing on the main features and highlighting similarities and/or differences. As shown in Tab. 2, Swift collected a total of 41 UV-grism spectra and 24 V-grism spectra, of which 29 and 22, respectively, turned out to be useful for our purposes. In col. 5 of Tab. 2, we list the total exposure time of each spectrum, resulting from either a single long exposure or a series of co-added shorter exposures (cfr. § 3.2) and corrected for dead-time. The exposure times relative to SN 2005am are slightly different from those published by Brown et al. (2005), who reported the total elapsed exposure time.
5.1 Thermonuclear SNe
5.1.1 SN 2005cf
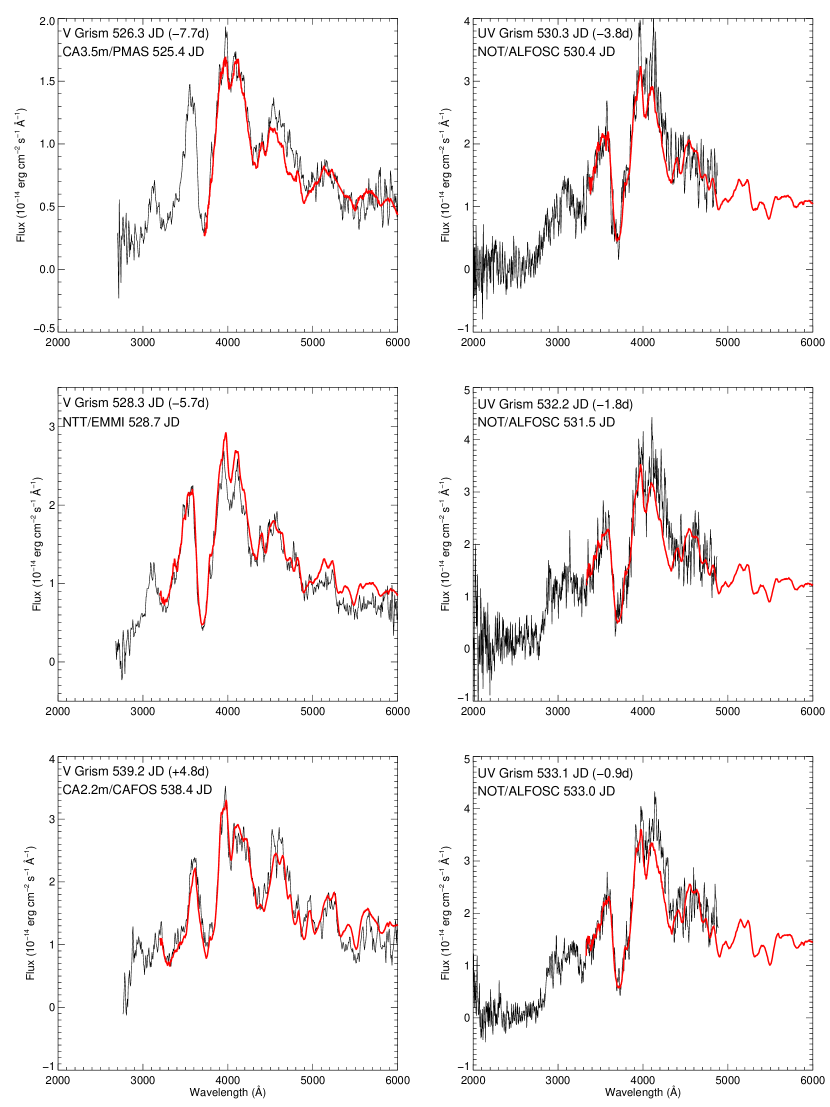
Of all SNe observed by Swift, SN 2005cf has the most detailed time sequence of UV spectra. The UV and V-grism spectra are displayed in Fig. 1. The UV spectra have a typical S/N 10 per pixel and provide unique information about the SN behavior in the range between 2000 and 3500 Å. The MgII 2798 absorption doublet redshifted to about Å is difficult to identify because its blue wing is suppressed by heavy metal line blanketing. Because of the limited S/N, SN Ia spectra are limited blue-ward of this wavelength. A number of features are easily recognizable at longer wavelengths: a strong CaII H&K doublet at 3900 Å (possibly contaminated by SiII 3858), SiII 4130 and 4580, MgII 4481, and blends of FeII and FeIII lines in the red part of the spectra. Identified UV-optical lines are marked in Fig. 3.
A careful analysis of the spectra at different epochs shows irregular shifts in wavelength. These are not intrinsic but caused by problems in determining the anchor point of the wavelength scale (see § 3.2). Where possible, the anchor point offsets have been determined by a cross-correlation with quasi-simultaneous ground-based spectra (Garavini et al., 2007), listed in Tab. 3 along with the measured offsets. The offsets are typically on the order of tens of Å and do not show a systematic trend with SN epoch. In Fig. 2 we overplot part of the UVOT spectra with the corresponding ground-based spectra. After wavelength correction, good overall agreement is obtained for the SEDs and line intensities for both grisms. UV-grism spectra are reliable long-ward of Å since second-order contamination is negligible because of the low flux below Å. Around 4500 Å, V-grism spectra taken at d and +4.8d from maximum show a (non-systematic) excess of about 10–15% with respect to the corresponding ground-based spectra.
Following Foley et al. (2008b), we have tried to estimate the ”UV-ratio” () for the spectra near-maximum ( d), that were corrected for the anchor point offset (Tab. 3). , defined as the flux ratio , is used as an indicator of the SN UV spectral shape. Foley et al. (2008b) found a correlation with the SN luminosity, with bright (slowly declining) SNe Ia characterized by a small UV-ratio (ranging between about 0.23 and 0.33). For the d spectrum (2005-06-10.7 UT), the measurement is uncertain because of the low signal from the short exposure time. For the d spectrum (2005-06-11.6 UT), we find . With a mag, SN 2005cf confirms the trend reported by Foley et al. (2008b).
The combined UV-optical spectra between d and +5d are shown in Fig. 3. An increase in flux at all wavelengths is observed for SN 2005cf as it approaches the maximum while the SED becomes redder. The broad P-Cygni lines, among which the strongest are CaII and SiII, become progressively narrower. Garavini et al. (2007) made a detailed analysis of the optical and near IR evolution of SN 2005cf, confirming that it followed the evolution of a normal SN Ia. The early spectra plotted in Fig. 3 show clear signatures of high velocity features (HVF, Mazzali et al. 2005) in CaII (both H&K and the IR triplet) and SiII, with velocities of 24,000 km s-1 and 19,500 km s-1 respectively. These remain well detectable up to maximum light (Garavini et al., 2007).
Focusing our attention on the UV range between 1800 and 3500 Å, which represents the novel contribution of Swift, we note two features at 3050 Å and 3250 Å (cfr. Fig. 1). The 3250 Å feature is relatively broad before maximum and becomes narrower when approaching it. Past maximum, the line profile becomes again broader in the red wing likely caused by a blend with other absorptions. The minimum near 3050 Å becomes strong and well defined close to maximum. Branch & Venkatakrishna (1986) suggested that the spectral features seen in the 2750–3450 Å range of the early spectra are produced by blends of FeII and CoII lines. These ions are not responsible for the conspicuous features in the optical spectrum, which is shaped by neutral or singly ionized ions such as OI, MgII, SiII, SII and CaII. In particular, the 3250 Å minimum has been explained with blue-shifted CoII absorption (rest wavelength 3350–3500 Å; Branch et al. 1985) while the Å one with FeII absorptions (Branch & Venkatakrishna, 1986). The identification of Fe and Co is consistent with the theoretical prediction that the light curve is powered by the radioactive decay chain 56Ni–56Co–56Fe. Based on a study of the UV spectra of SN 1992A taken around maximum both with IUE and HST/FOS, Kirshner et al. (1993) confirmed that the spectrum in this range is shaped by blends of Fe-peak element lines. In particular, they found a significant contribution from CrII and FeII at Å and from CrII, MnII and FeII at Å, but excluded a contribution from CoII and NiII at the earliest epochs because the freshly synthesized Ni and Co are confined to the inner region. Similar results were recently reported by Sauer et al. (2008) who also highlighted the importance of the contribution of TiII in forming the absorption at Å and of the double ionized Co and Fe to the 3250 Å feature, especially at epochs around the maximum. In general, strong blending makes line identification in the UV difficult.
5.1.2 SNe 2005df and 2005am
The spectral evolution of SNe 2005df and 2005am is shown in Figures 4 and 5, respectively. The lack of available ground-based optical spectroscopy makes the wavelength scale of the grism data uncertain and possible measurements not reliable. Most UV-grism spectra for SN 2005df were collected before maximum. The gap between 2300–2500 Å in the spectrograms of Fig. 4 is due to contamination by a field star. Similarly to SN 2005cf, two broad minima at about 3050 Å and 3250 Å are present and show the same temporal evolution. Only post-maximum spectra are available for SN 2005am. The SN shows deep absorption features at maximum which become weaker about a week later, such as the strong SiII 4130 absorption at about Å. The SiII 3859 and CaII H&K absorption lines, usually blended in a broad feature at 3600–3800 Å (e.g. SN 2005cf), are narrow and appear resolved. The persistence of the separation of the two features two weeks after maximum seems to exclude the presence of HVF of CaII H& K and supports the identification of the blue component as the SiII line. Seven days after maximum, the optical spectrum is characterized by the usual broad absorption lines, including SiII (4130, 5051 and 5972), MgII (4481) and numerous blends of FeII and FeIII lines. The minima near 3050 Å and 3250 Å qualitatively follow the evolution of SN 2005cf.
5.1.3 Comparison of SN Ia around maximum light
In Fig. 6 we compare the spectra of five SNe Ia, 1992A, 1990N, 2005df, 2005cf, and 2005am at two epochs, one week before (upper panel) and about 5 days after maximum (lower panel). The UV spectra of SN 1992A taken both with IUE and HST are of high S/N and allow a useful comparison of the performance of various instruments. The UV spectrum is produced in the outer layers because of the large opacity and can be strongly modified by small changes in the physical conditions (chemical composition, density structure, etc.) which may have negligible impact at other wavelengths. Our comparison confirms that UV spectra of SNe Ia can differ significantly, both before and after maximum, as shown also by Sauer et al. (2008) and Foley et al. (2008a). Before maximum, SNe 2005df and 2005cf appear more similar to SN 1990N than to SN 1992A. While red-ward of the CaII H&K absorption the four SNe are quite similar, in the UV they are markedly different. In SN 1992A the Å absorption trough is narrow and lacks the extended red wing. The relative ratio SiII 4130 / SiIII 4560 is much larger in SN 1992A than in other objects, which indicates lower temperature and ionization (Mazzali et al., 1993). In general, all features of SN 1992A seem broader, as if washed out by larger expansion velocities: a clear example is the SiIII 4560 line.
The differences between SN 1992A and all other SNe persist also after maximum. Again, the expansion velocities seem higher so that the MgII and SiIII visible in 2005cf at about 4300 and 4400 Å (Garavini et al., 2007) are completely blended to form a broad feature, which was attributed to FeII and FeIII lines by Kirshner et al. (1993). SN 1992A also shows an absorption at Å. This can be possibly recovered only in the noisy spectrum of SN 2005am, which shares with SN 1992A the same photometric behavior (m 1.4). In Fig. 7, the comparison between the two objects reveals an overall similarity with exception of an apparent slower expansion velocity for SN 2005am.
5.1.4 Peculiar SNe 2005ke and 2005hk
Two peculiar SNe Ia are included in our sample: SN 2005ke, a sub-luminous 1991bg-like
SN, and SN 2005hk, a rare 2002cx-like SN.
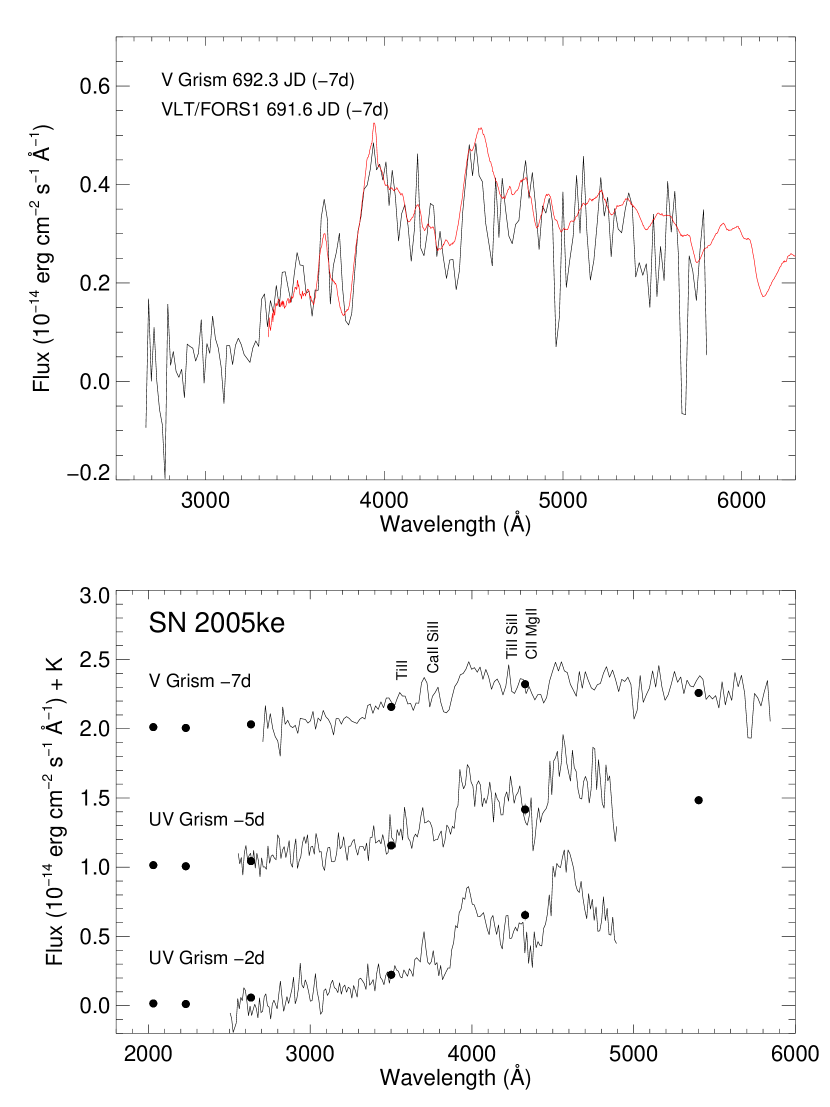
The spectral evolution of SN 2005ke is shown in the lower panel of Fig. 8.
All spectra were taken before maximum, but the wavelength calibration could only be checked
for the V-grism spectrum at d, by using the quasi-simultaneous
ground-based spectrum taken at VLT/FORS1 on Nov. 17 (courtesy of F.Patat), to correct for
an apparent offset of the anchor point of 41 Å (Fig. 8, upper panel).
From the comparison we have recognized most
of the features and identified them on the basis of the similarities found
with the SN 1991bg-like SN 2005bl (Taubenberger et al., 2008).
SN 2005ke shows two broad absorption features, the CaII H&K and Si II line at 3700 Å and the
4200 Å TiII — typical for this SN sub-class — to which CII, SiII and MgII contribute.
Unlike normal SN Ia, there is no clear evidence of
the 3050 Å and 3250 Å minima in the UV region of the spectra,
as shown by the comparison (Fig. 9) with the spectrum
of SN 2005cf obtained at the same epoch.
The single UVOT spectrum of SN 2005hk ( d) has a very poor S/N (5) because of
the faintness of the object (, Phillips et al. 2007).
We also used the Keck/LRIS spectrum ( d, Chornock et al. 2006)
to recognize several narrow lines, indicative of low expansion
velocities: we note the 4404 FeIII and CaII H&K, both at
6,000 km s-1, NiII plus TiII at about 3700 Å and CoII at 3300 Å.
All these features were found previously only in SN 2002cx (Li et al., 2003).
5.1.5 SN 2006X
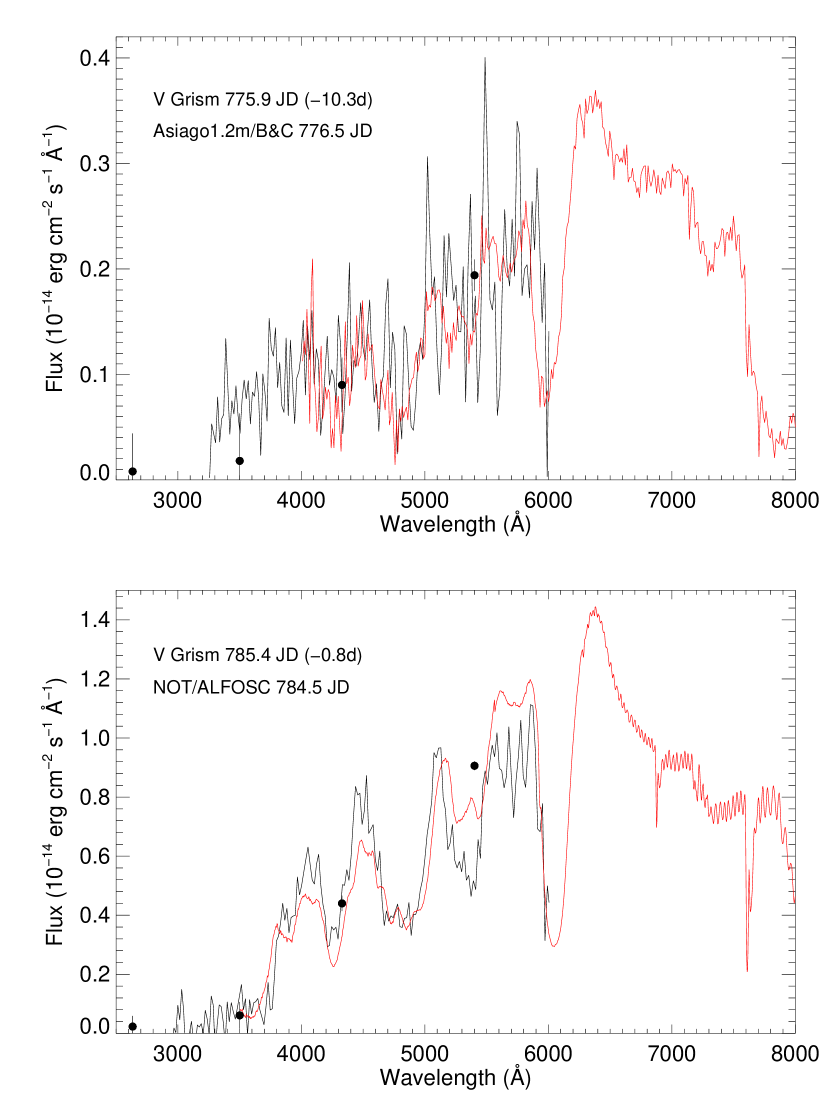
The two pre-maximum V-grism spectra of SN 2006X are given in Fig. 10, together with ground-based data (Asiago 1.2m/B&C and NOT/ALFOSC, Elias-Rosa et al. 2009, in preparation). Because of the faintness of SN 2006X and the short exposure time, the spectra remain noisy even after smoothing with a boxcar of 18 ÅḞor the first spectrum (upper panel in Fig. 10), it was not possible to compute from the cross-correlation with the ground-based spectrum an unique solution for the wavelength shift correction because of the strong noise, though good agreement with the SED is found. At shorter wavelengths, possible contamination with the host galaxy might be present, as suggested by a comparison with the UVOT photometry. The second spectrum (lower panel) has better S/N, thus a wavelength offset of 0 Å has been found by cross-correlating it with the quasi-simultaneous ground-based spectrum. Numerous absorption lines of SiII ( 4130, 5051), SII (5468, 5612), FeII (4924) and FeIII at 4404 blended with MgII 4481 can be recognized. SN 2006X shows a redder SED compared to normal SNe Ia, likely caused by strong circumstellar and interstellar absorption in the parent galaxy disk.
5.2 Core Collapse SNe
Our sample of core collapse SNe includes two SNe II Plateau (SNe II-P 2005cs and 2006bp) and one SN Ib, the peculiar SN 2006jc. The Swift observations began soon after discovery of each of these targets and their spectral evolution was followed for as long as they remained detectable over the background. Preliminarily reduced UVOT spectra were presented in Brown et al. (2007) for SN 2005cs, Immler et al. (2007) for 2006bp, and Immler et al. (2008) for 2006jc. In this paper we present the spectra obtained after applying the new extraction procedure, as described in § 3.2.
5.2.1 Type II SNe 2005cs and 2006bp
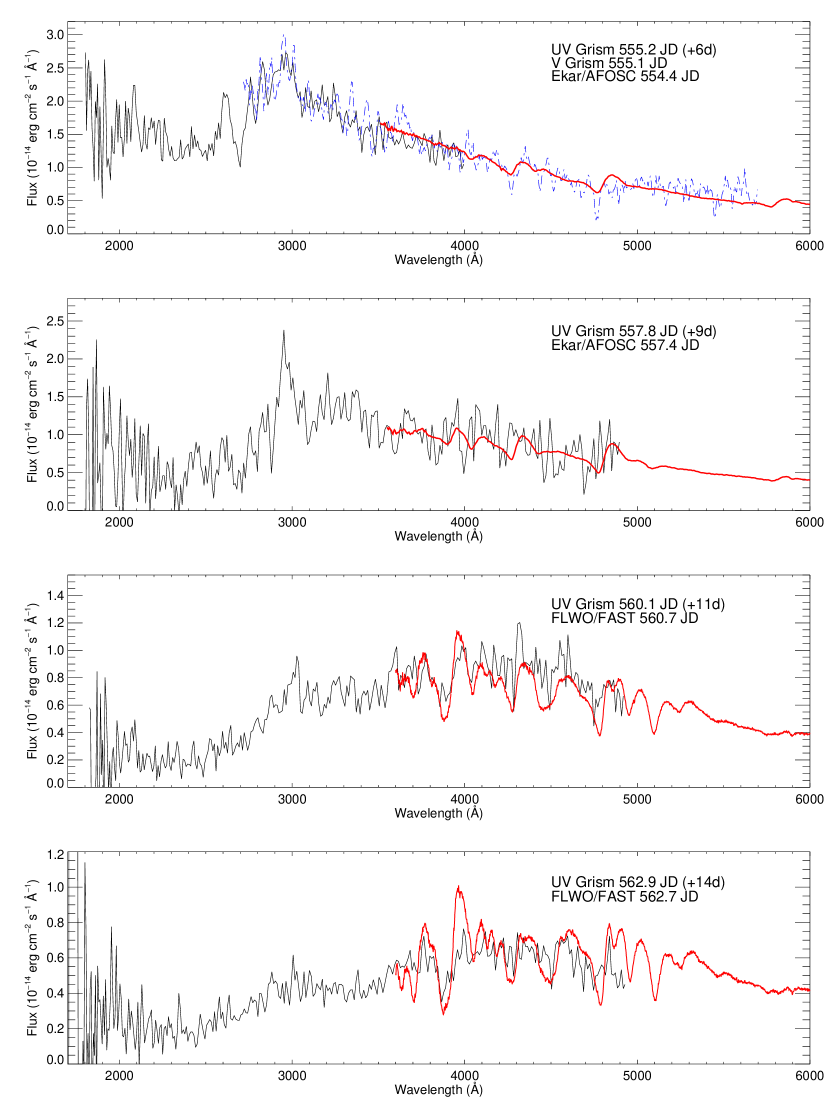
The spectral evolution of SN 2005cs is shown in Fig. 11. The extracted spectra are smoothed using a boxcar of 10 Å and scaled to match the quasi-simultaneous UVOT (Dessart et al. 2008, Brown et al. 2007) or ground-based (Ekar 1.82m/AFOSC, Pastorello et al. 2006) photometry, where available. Spectra taken after d are not shown in Fig. 11 because of poor S/N. In contrast to SN Ia, SNe II are characterized by substantial UV emission, especially at early epochs. Since the UV-grism covers a range from 2000 Å to 5000 Å, significant second-order contamination is expected above 4000 Å. The first UV-grism spectrum (2453555.2 JD) shows a flux excess red-ward of Å. This excess amounts to % of the simultaneous V-grism flux. Because of the rapid decrease of the UV emission, second-order contamination becomes rapidly negligible (Fig. 11).
Comparisons with ground-based spectra are shown in Fig. 12 and the derived wavelength offsets of the anchor point reported in Tab. 4. In the top panel of Fig. 12, the UVOT UV- and V-grism spectra taken on day are compared with the quasi-simultaneous Asiago spectrum (Pastorello et al., 2006). The part of the UV-grism spectrum with Å has been removed as it was contaminated by second-order light. An overall good agreement among the 3 spectra is found, and Hydrogen Balmer lines (H and H) are easily recognizable. While the poor S/N of the UV-grism prevents us from estimating an unique solution for the wavelength shift correction, a 0 Å offset is derived for the V-grism spectrum. In Fig. 15, SN 2005cs spectrum shows significant resemblance to the HST spectrum of SN II-P 1999em (Baron et al. 2000, Fig. 2) although the latter corresponds to a somewhat later phase ( d). In the UV, we can identify a broad absorption due to MgII 2798 and FeII absorption lines at about Å and 3100 Å (Dessart & Hillier, 2005). The CaII H&K doublet at about Å is barely visible because of the poor S/N. It is evident only in the UVOT spectra taken at and d (Fig. 11). Similarly to SN 1999em (Baron et al., 2000; Dessart & Hillier, 2005, 2006), the spectrum of SN 2005cs is shaped at short wavelengths mainly by blends of lines of singly ionized iron-peak elements.
In Fig. 12 (second panel from the top), we compare the UVOT UV-grism of 2005-07-06 UT with an optical spectrum obtained at Asiago/Ekar at the same epoch. The agreement of the SEDs is excellent, but the S/N is again too low to estimate an unique wavelength shift correction from the cross-correlation. The second order effect seems already reduced at this late epoch. The V-grism spectrum (not shown) has an even poorer S/N. Fitting the UV-optical flux distribution with a black body at Å to avoid the line-blanketing effect, we obtain color temperatures for the two early spectra of K and K, respectively, with an uncertainty of 5%.
Finally, the last two epochs UV-grism spectra have been compared to the
quasi-simultaneous optical ones taken at the FLWO 1.2m telescope (FAST spectrograph,
Dessart et al. 2008). We obtain a wavelength shift of Å and Å,
respectively (See Tab. 4).
In Fig. 13, the time evolution of SN 2005cs spectral energy distribution in the range
1800–8000 ÅÅ is presented, showing the combined UV-optical spectra where the correction of the
anchor point wavelength offset has been possible. During the early phases,
the UV flux is stronger than the optical
one, but the SN emission peak rapidly moves red-ward with time.
The UV flux, produced during the SN shock breakout, is progressively blocked by
a forest of overlapping metal lines strengthening with time.
The synthetic spectra published by Dessart et al. (2008) show a good agreement
with the observed UVOT spectra, here presented. The models well reproduce the observed drop
of the continuum level blue-ward 2800 Å, due to the strong absorptions
by FeII. An important contribution to the line blanketing is given by the TiII in the 3000 Å region
and by NiII in the 2500 Å one.
We confirm the presence in the early spectra of broad absorptions centered approximately
at 2350 Å and 2500 Å and the further continuum drop blue-ward 2000 Å
though a high noise characterizes this region. In addition, observed early spectra show
a shallower MgII absorption at 2700 Å and stronger FeII lines at 2800 Å and
2900 Å than the corresponding models (Fig. 4c and Fig. 5b in Dessart et al. 2008).
Such FeII lines appear only in synthetic spectra relative to later phases (Fig. 5c and Fig. 5e
in Dessart et al. 2008), as well as the broad absorptions at 3100 Å and in the optical region.
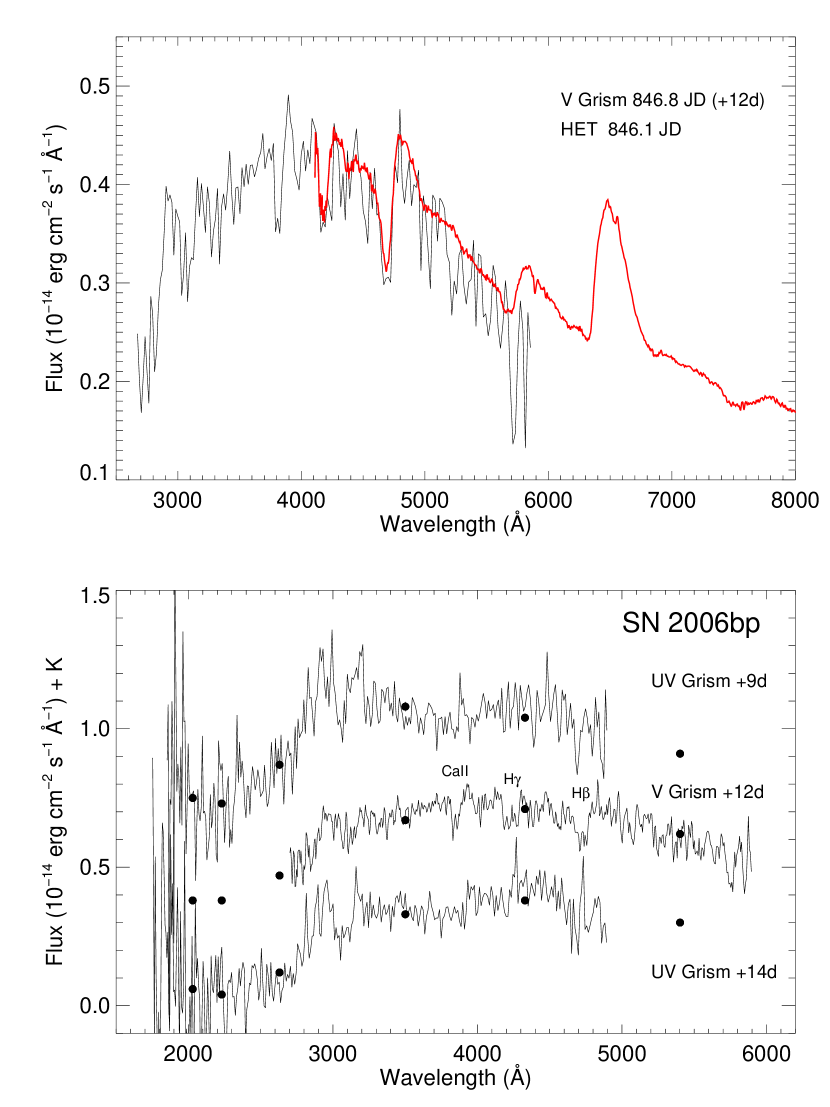
A single V-grism and seven UV-grism spectra were taken for SN 2006bp, 5 of which were contaminated by a nearby field star. In Fig. 14 (lower panel), two UV and the V-grism spectra are plotted. As described above, they have been flux calibrated with the simultaneous Swift photometry (Dessart et al., 2008) and smoothed (boxcar of 10 Å). Since the UV-grism spectrum has a very poor S/N, the wavelength calibration check was possible only for the V-grism one by cross-correlating it with a quasi-simultaneous ground-based spectrum taken at the HET (Quimby et al. 2007). A shift of Å has been derived. The SED of the UVOT V-grism results in satisfactory agreement with ground-based data (upper panel of Fig. 14). The Å CaII H & K is detectable only with the V-grism for the first epoch ( d).
The identification of the UV lines in SN 2006bp is facilitated by a comparison with other objects. In Fig. 15, we compare the UV-spectra of SNe 2006bp and 2005cs with those of SN 1999em at the same epoch (Baron et al., 2000). We recognize FeII at Å and Å, and MgII at Å (Dessart & Hillier, 2005) during the first epoch ( d). A blue-shift of the wavelength calibration scale is visible in SN 2006bp, taking SN 2005cs as a reference.
Five days later (lower panel of Fig. 15), the continuum level decreases and the spectra are redder because the ejecta cool down. Very few features can be identified. The spectra of these two objects clearly show the need for considerably longer exposure times for future SN observations in order to improve the quality of the data and allow a more in-depth analysis and comparison with spectral models.
5.2.2 Type Ib SN 2006jc
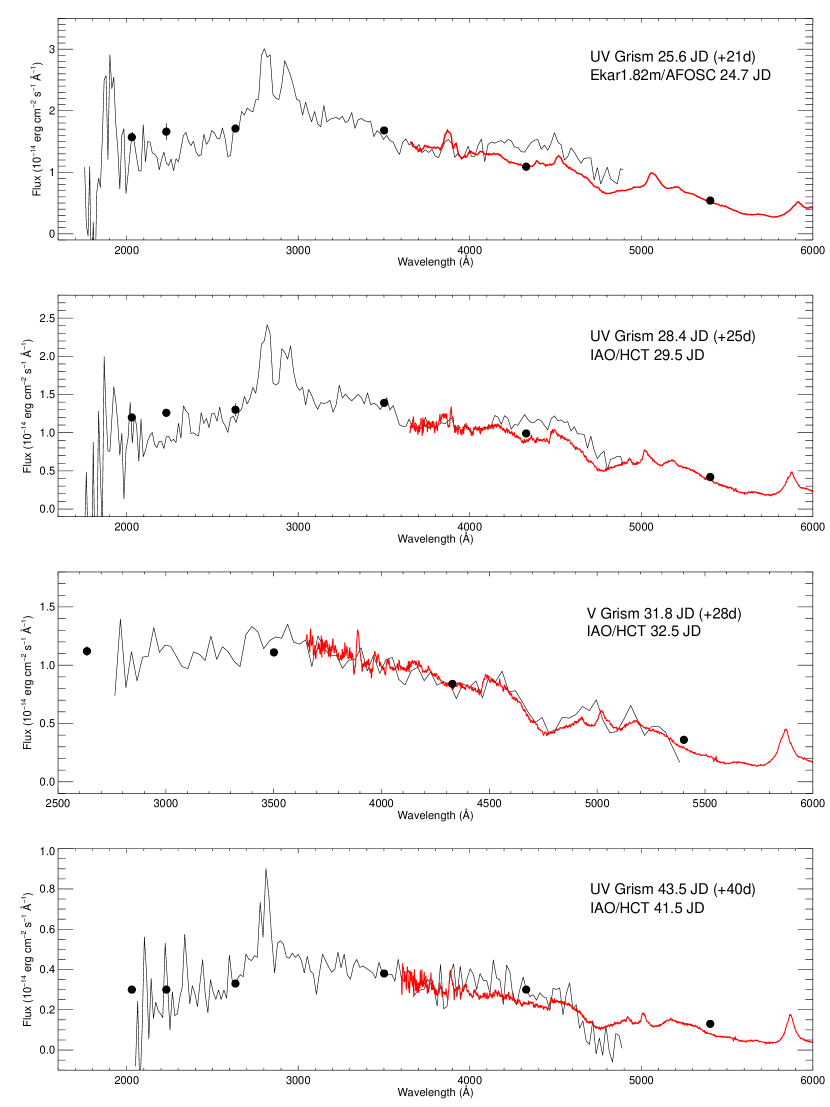
For SN 2006jc, a cross-correlation was possible for all the UVOT spectra (Fig. 16), comparing them with quasi-simultaneous ground-based optical spectra (Asiago/Ekar spectrum from Pastorello et al. 2007b and IAO/HCT from Anupama et al. 2009). Differently from the general constrain adopted along this paper (see § 3.2), we compared the last epoch UV-grism spectrum (+40 days after explosion) with an optical spectrum taken 2 days later. This choice was based on the slow evolution that characterizes SN 2006jc at this phase, as evident from the light curves (see Foley et al. 2007 and Pastorello et al. 2007b).
The resulting wavelength offsets are negligible, as reported in Tab. 4.
Similarly to the other SNe, the flux scale of each spectrum was matched to the UVOT photometry
(Modjaz et al. 2009, in preparation), but at the earlier epochs ( d and d) the comparison
with both the photometry and the ground-based spectra
reveals a flux excess red-ward of 4000 Å, caused by second-order contamination
(as discussed in the previous section).
The time evolution of the UV-optical combined spectrum (range 1800-9000 Å) of SN 2006jc is shown in Fig. 17. A preliminary discussion of the spectral properties of SN 2006jc UV is reported in Immler et al. (2008). Unlike SN 1983N (Panagia, 1985), the only SN Ib extensively observed in the UV range by IUE, the spectral features of SN 2006jc do not resemble those of a Type Ia SN. Absorption features are recognizable at 2400 Å and 2600 Å, but detailed fitting with a spectral model is needed to identify the elements that cause them. SN 2006jc shows two strong and broad emission lines at 2800 Å and 2950 Å, probably MgII and FeII, respectively. The appearance of these features in emission at early epochs is rather unusual. The MgII 2800 emission line has been observed in the spectra of SN IIL 1979C (Panagia et al., 1980) and SN IIn 1998S (Panagia 2003, Fransson et al. 2005). In these SNe the emission line became stronger relative to the continuum after maximum, and broader. Such an evolution was explained as the direct result of the interaction of the SN ejecta with a circumstellar medium. MgII emission lines form mainly in layers that are close to the SN photosphere, but distinctly separated from it in space, velocity and excitation conditions (Panagia et al. 1980, Fransson et al. 1984). Such a UV emitting shell may consist of gas originally ejected by the stellar progenitor as a stellar wind or during an episodic mass ejection. MgII emission is more commonly observed in late phase spectra, e.g., for SN 1995N (Fransson et al., 2002), of the previously quoted SN 1979C (Fesen et al., 1999), or of the SN 1993J and SN 1998S (Fransson et al., 2005), and is interpreted as interaction with pre-existing CSM shell. The X-ray and UV photons emitted in the propagation of the radiative reverse shock into the supernova ejecta, highly ionize the unshocked material (with resulting CIII-IV, NIII-IV and OIII-IV lines in the far UV). At the same time, the reprocessed radiation emerges mostly as emission from neutral and singly ionized ions (such as HI lines, MgII and FeII) because of the high density of the region between the reverse shock and the contact discontinuity (Fransson et al., 2005).
Observations at different wavelength ranges give independent evidence for CSM interaction. X-ray detections were obtained with Swift/XRT and Chandra at seven epochs, which showed that the flux increased by a factor of 5 up to about days after the explosion. This unusual X-ray rise and subsequent decline has never been observed for any other SN and could be explained as shock-heating of the previously ejected progenitor shell by the SN blast wave (Immler et al., 2008). Indeed, SN 2006jc has been associated with a luminous outburst discovered two years earlier (Nakano et al. 2006b, Pastorello et al. 2007b), which may indicate that the progenitor was a Wolf-Rayet star with activity similar to a Luminous Blue Variable (LBV). This scenario is also consistent with the strong and narrow HeI emission lines observed in the optical and IR (Pastorello et al. 2007b; Foley et al. 2007).
6 Conclusions and Outlook
We have presented all Swift archival of UV/optical spectroscopic data of SNe obtained during the first two years of observations (2005–2006). The sample includes 29 UV grism and 22 V grism spectra for a total of 9 SNe (6 SNe Ia, 2 SNe II and 1 SN Ib). In SNe Ia the UV spectrum is thought to originate predominantly from reverse fluorescence in iron group ions in the outermost layers that converts photons from red to blue wavelengths (Mazzali, 2000), thus the emerging UV spectrum changes with the metal content of the outermost layers of the ejecta (line blanketing effect) and its ionization (backwarming effect) (Lentz et al. 2000, Sauer et al. 2008). We confirmed that the broad absorptions at around Å and Å [due to Fe, Co, Cr and Ti lines; Kirshner et al. (1993); Sauer et al. (2008)], along with the 2800 Å MgII, are the main features characterizing the UV spectrum of SNe Ia. A comparison of the Swift SN Ia spectra with those of SNe 1992A and 1990N shows that SNe Ia with similar optical properties may have different properties in the UV.
SN 2006jc is the only Type Ib/c SN in our spectroscopic sample, although it is peculiar in many aspects. Unlike the previous UV-detected SN Ib 1983N (Panagia, 2003), the UV spectra of SN 2006jc do not show features similar to SNe Ia. Two strong and broad emission features are present in the range 2800–3000 Å. These lines are unusual at early epochs and are likely due to MgII. Resembling the strongly interacting SNe 1979C (Panagia et al., 1980) and 1998S (Panagia 2003, Fransson et al. 2005), the emission can be interpreted as a signature of the interaction between the SN ejecta and material originally ejected by the progenitor.
Most of the UV flux of SNe II is emitted during the shock breakout. In some cases, a strong UV excess is also seen, together with highly ionized species lines, as a consequence of the inverse Compton scattering by energetic, thermal electrons ( K), produced when the SN ejecta interacts with the pre-existing CSM (Fransson et al., 1984). Similar to SN 1999em (Baron et al., 2000), the UV spectra of both Type II-P SNe 2005cs and 2006bp are shaped by blends of singly ionized iron-peak elements lines (FeII, NiII) and MgII. The presence of numerous resonance lines yields a line blanketing effect that increases with decreasing temperature. SNe II-P constitute a homogeneous class in the UV wavelength range. This confirms the recent claims by Gal-Yam et al. (2008), who found, based on the GALEX UV spectrum of SN 2005ay, a remarkable similarity among the UV spectral properties of these SNe. This open new perspectives for their use as cosmological probes. A deep discussion on the UV homogeneity of Type II-P SNe and the comparison with the UV properties of other Type II classes is presented in Bufano et al. (2009, in prep.).
Our analysis is limited by the low S/N of the data as a result of short exposure times. However, the data presented here highlight the large and unique scientific potential of Swift grism observations of SNe and justify the continuation of the ongoing Swift program to monitor SNe of all types with a sufficiently large investment in exposure time.
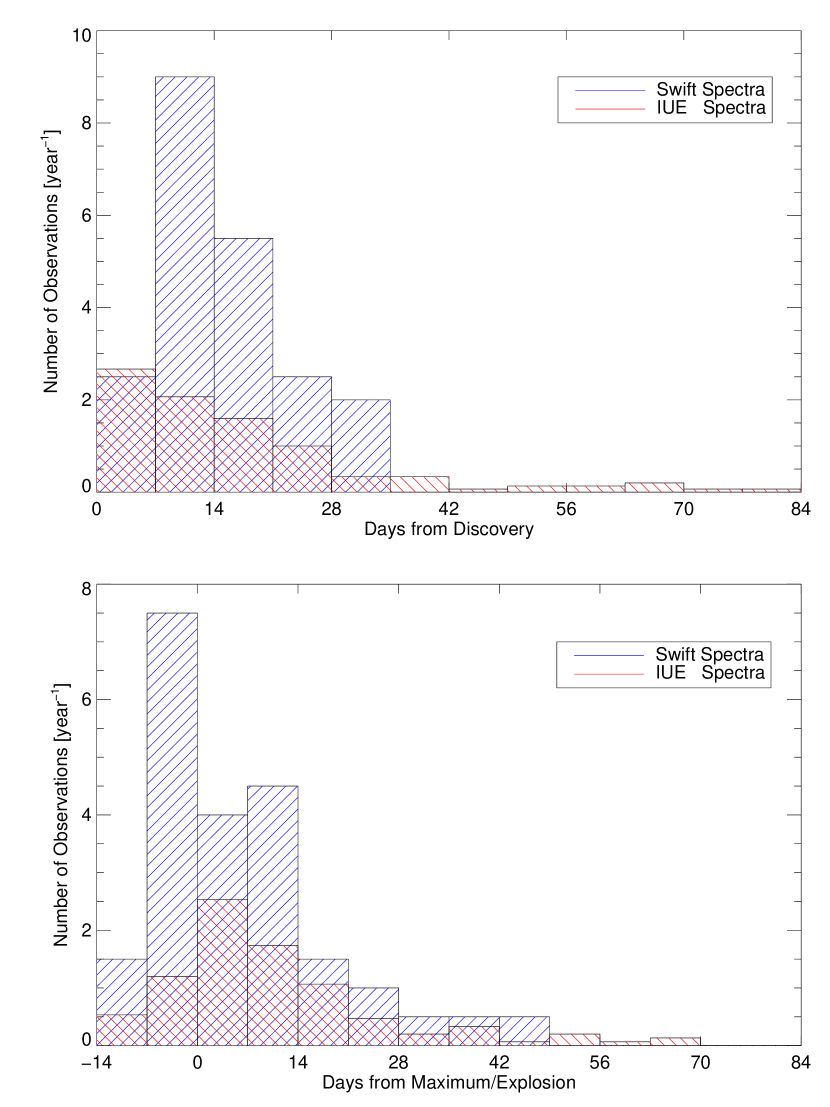
Currently (and for years to come) Swift is the only instrument capable of monitoring the rapid evolution of SN UV emission. By using its flexible scheduling capabilities, we have obtained prompt observations and carried out intensive follow-up campaigns. For SN 2005cf, for example, the best SN Ia spectroscopic UV observations ever have been obtained that include 7 UV spectra before maximum. This improves the exceptional performance of IUE (6 pre-maximum spectra of SN 1990N). In Fig. 18 we compare the first 2-years of Swift spectroscopic visits to the 15-year IUE activity on SNe. Our results are encouraging, especially considering the small collecting area of Swift UVOT. The large number of observations that Swift already collected stands out, as a result of its unsurpassed capabilities: it has a faster and flexible response time (1 day) making feasible systematic follow-up of SNe starting from early phases, when the SN evolves faster, the UV emission is stronger and the photosphere is located in the outermost layers that still retain information on the SN progenitors. However, a more aggressive strategy for brighter SNe, especially closer to the discovery, when Swift remains slightly lower than IUE, is recommended. Future observations will probe further the diversity of SNe of all types, their environments, constrain theoretical stellar models and test their possible cosmological evolution, fundamental for using SNe as distance indicators.
References
- Anupama et al. (2009) Anupama, G. C., Sahu, D. K., Gurugubelli, U. K., Prabhu, T. P., Tominaga, N., Tanaka, M., & Nomoto, K. 2009, MNRAS, 392, 894
- Baron et al. (2000) Baron, E., et al. 2000, ApJ, 545, 444
- Barthelmy et al. (2005) Barthelmy, S. D., et al. 2005, Space Science Reviews, 120, 143
- Baek et al. (2005) M. Baek, M., Prasad, R. R. & Li, W. 2005, IAU Circ. 8630
- Benetti et al. (2004) Benetti, S., et al. 2004, MNRAS, 348, 261
- Benetti et al. (2006) Benetti, S., et al. 2006, CBET, 674
- Benvenuti et al. (1982) Benvenuti, P., Sanz Fernandez de Cordoba, L., Wamsteker, W., Macchetto, F., Palumbo, G. C., Panagia, N., & Battrick, B. 1982, NASA STI/Recon Technical Report N, 84, 25563
- Bianchi & The GALEX Team (2000) Bianchi, L., & The GALEX Team 2000, Memorie della Societa Astronomica Italiana, 71, 1117
- Blinnikov & Bartunov (1993) Blinnikov, S. I., & Bartunov, O. S. 1993, A&A, 273, 106
- Blinnikov et al. (1998) Blinnikov, S. I., Eastman, R., Bartunov, O. S., Popolitov, V. A., & Woosley, S. E. 1998, ApJ, 496, 454
- Blinnikov & Sorokina (2000) Blinnikov, S. I., & Sorokina, E. I. 2000, A&A, 356, L30
- Branch et al. (1985) Branch, D., Doggett, J. B., Nomoto, K., & Thielemann, F.-K. 1985, ApJ, 294, 619
- Branch & Venkatakrishna (1986) Branch, D., & Venkatakrishna, K. L. 1986, ApJ, 306, L21
- Branch (1987) Branch, D. 1987, ApJ, 320, L23
- Breeveld et al. (2005) Breeveld, A. A., et al. 2005, Proc. SPIE, 5898, 391
- Brown et al. (2005) Brown, P. J. et al. 2005, AJ, 635, 1192
- Brown et al. (2007) Brown, P. J., et al. 2007, ApJ, 659, 1488
- Brown et al. (2008) Brown, P. J., et al. 2008, ArXiv e-prints, 803, arXiv:0803.1265
- Burket & Li (2005) Burket, J., & Li, W. 2005, IAU Circ., 8625
- Burrows (1994) Burrows, C. J. 1994, Hubble Space Telescope Handbook, V2
- Burrows et al. (2005) Burrows, D. N., et al. 2005, Space Sci. Rev., 120, 165
- Campana et al. (2006) Campana, S., et al. 2006, Nature, 442, 1008
- Cappellaro et al. (1995) Cappellaro, E., Turatto, M., & Fernley, J. 1995, ESA Special Publication, 1189
- Chornock et al. (2006) Chornock, R., Filippenko, A. V., Branch, D., Foley, R. J., Jha, S., & Li, W. 2006, PASP, 118, 722
- Crotts et al. (2006) Crotts, A., Eastman, J., Depoy, D., Prieto, J. L., & Garnavich, P. 2006, CBET, 672, 1
- Dessart & Hillier (2005) Dessart, L., & Hillier, D. J. 2005, A&A, 437, 667
- Dessart & Hillier (2006) Dessart, L., & Hillier, D. J. 2006, A&A, 447, 691
- Dessart et al. (2008) Dessart, L., et al. 2008, ApJ, 675, 644
- Elmhamdi et al. (2003) Elmhamdi, A., et al. 2003, MNRAS, 338, 939
- Ensman & Burrows (1992) Ensman, L., & Burrows, A. 1992, ApJ, 393, 742
- Eastman & Kirshner (1989) Eastman, R. G., & Kirshner, R. P. 1989, ApJ, 347, 771
- Elias-Rosa, (2008) Elias-Rosa, N, 2008, to appear in “Supernovae: light in the darkness (XXIII Trobades cientifiques de la Mediterrania)”, 2007 October, Maó, Menorca, Proceedings of Science
- Ellis et al. (2008) Ellis, R. S., et al. 2008, ApJ, 674, 51
- Evans (2005) Evans, R. , 2005, IAU Circ., 8584, 3
- Fesen et al. (1999) Fesen, R. A., et al. 1999, AJ, 117, 725
- Fesen et al. (2006) Fesen, R., Milisavljevic, D., & Rudie, G. 2006, CBET, 672, 2
- Filippenko & Chornock (2002) Filippenko, A. V., & Chornock, R. 2002, IAU Circ., 7825, 1
- Foley et al. (2007) Foley, R. J., Smith, N., Ganeshalingam, M., Li, W., Chornock, R., & Filippenko, A. V. 2007, ApJ, 657, L105
- Foley et al. (2008a) Foley, R. J., et al. 2008, ApJ, 684, 68
- Foley et al. (2008b) Foley, R. J., Filippenko, A. V., & Jha, S. W. 2008b, ApJ, 686, 117
- Fransson (1994) Fransson, C. 1994, Supernovae, 677
- Fransson et al. (1984) Fransson, C., Benvenuti, P., Wamsteker, W., Gordon, C., Hempe, K., Reimers, D., Palumbo, G. G. C., & Panagia, N. 1984, A&A, 132, 1
- Fransson et al. (2002) Fransson, C., et al. 2002, ApJ, 572, 350
- Fransson et al. (2005) Fransson, C., et al. 2005, ApJ, 622, 991
- Gal-Yam et al. (2008) Gal-Yam, A., et al. 2008, ApJ, 685, L117
- Garavini et al. (2007) Garavini, G., et al. 2007, A&A, 471, 527
- Gehrels et al. (2004) Gehrels, N., et al. 2004, ApJ, 611, 1005 (erratum, 621, 558 [2005])
- Gezari et al. (2008) Gezari, S., et al. 2008, ApJ, 683, L131
- Ghisellini et al. (2007) Ghisellini, G., Ghirlanda, G., & Tavecchio, F. 2007, MNRAS, 382, L77
- Hillebrandt & Niemeyer (2000) Hillebrandt, W., & Niemeyer, J. C. 2000, ARA&A, 38, 191
- Hoeflich et al. (1998) Hoeflich, P., Wheeler, J. C., & Thielemann, F. K. 1998, ApJ, 495, 617
- Immler et al. (2005) Immler, S., et al. 2005, ApJ, 632, 283
- Immler et al. (2006a) Immler, S., et al. 2006a, ApJ, 648, L119
- Immler (2006b) Immler, S. 2006b, The Astronomer’s Telegram, 726, 1
- Immler et al. (2006c) Immler, S., Brown, P., & Milne, P. 2006c, ATel, 793, 1
- Immler et al. (2007) Immler, S., et al. 2007, ApJ, 664, 435
- Immler et al. (2008) Immler, S., et al. 2008, ApJ, 674, L85
- Jeffery et al. (1994) Jeffery, D. J., et al. 1994, ApJ, 421, L27
- Kirshner et al. (1993) Kirshner, R. P., et al. 1993, ApJ, 415, 589
- Kloehr et al. (2005) Kloehr W., Muendlein R., Li W., Yamaoka H., & Itagaki K., 2005, IAU Circ., 8553, 1
- Leibundgut et al. (1991) Leibundgut, B., Kirshner, R. P., Filippenko, A. V., Shields, J. C., Foltz, C. B., Phillips, M. M., & Sonneborn, G. 1991, ApJ, 371, L23
- Lentz et al. (2000) Lentz, E. J., Baron, E., Branch, D., Hauschildt, P. H., & Nugent, P. E. 2000, ApJ, 530, 966
- Lentz et al. (2001) Lentz, E. J., et al. 2001, ApJ, 547, 406
- Levesque et al. (2005) Levesque, E. M., Massey, P., Olsen, K. A. G., Plez, B., Josselin, E., Maeder, A., & Meynet, G. 2005, ApJ, 628, 973
- Li et al. (2003) Li, W., et al. 2003, PASP, 115, 453
- Lucy (1999) Lucy, L. B. 1999, A&A, 345, 211
- Matheson et al. (2000) Matheson, T., Filippenko, A. V., Chornock, R., Leonard, D. C., & Li, W. 2000, AJ, 119, 2303
- Martin et al. (2005) Martin, R., 2005, IAU Circ. 8490, 1
- Mason et al. (2001) Mason, K. O., et al. 2001, A&A, 365, L36
- Mazzali et al. (1993) Mazzali, P. A., Lucy, L. B., Danziger, I. J., Gouiffes, C., Cappellaro, E., & Turatto, M. 1993, A&A, 269, 423
- Mazzali & Lucy (1993) Mazzali, P. A., & Lucy, L. B. 1993, A&A, 279, 447
- Mazzali & Chugai (1995) Mazzali, P. A., & Chugai, N. N. 1995, A&A, 303, 118
- Mazzali (2000) Mazzali, P. A. 2000, A&A, 363, 705
- Mazzali et al. (2005) Mazzali, P. A., et al. 2005, ApJ, 623, L37
- Mazzali et al. (2008) Mazzali, P. A., et al. 2008, Science, 321, 1185
- Milliard et al. (2001) Milliard, B., et al. 2001, Mining the Sky, 201
- Modjaz et al. (2005a) Modjaz, M., Kirshner, R., & Challis, P. 2005a, IAU Circ. 8491, 2
- Modjaz et al. (2005b) Modjaz, M., Kirshner, R., Challis, P., & Berlind, P. 2005b, IAU Circ., 8534, 3
- Modjaz et al. (2005c) Modjaz M., Kirshner R., Challis P., & Hutchins R. 2005c, IAU Circ., 8555, 1
- Modjaz et al. (2006) Modjaz, M., Blondin, S., Kirshner, R., Challis, P., Matheson, T., & Mamajek, E. 2006, CBET, 677, 1
- Modjaz et al. (2008) Modjaz, M., et al. 2008, arXiv:0805.2201
- Nakano et al. (2006a) Nakano, S. 2006a, IAU Circ., 8700, 2
- Nakano et al. (2006b) Nakano, S., Itagaki, K., Puckett, T., & Gorelli, R. 2006, CBET, 666
- Panagia et al. (1980) Panagia, N., et al. 1980, MNRAS, 192, 861
- Panagia (1985) Panagia, N. 1985, Supernovae as Distance Indicators, Lecture Notes in Physics, 224, 14
- Panagia (2003) Panagia, N., 2003, in ”Supernovae and Gamma-Ray Bursters”, ed. K.W.Weiler (Springer-Verlag:Berlin), p.113-114
- Panagia (2007) Panagia, N. 2007, American Institute of Physics Conference Series, 937, 236
- Pastorello et al. (2006) Pastorello, A., et al. 2006, MNRAS, 370, 1752
- Pastorello et al. (2007a) Pastorello, A. 2007a, MNRAS, 376, 1301
- Pastorello et al. (2007b) Pastorello, A., et al. 2007b, Nature, 447, 829
- Pastorello et al. (2008) Pastorello, A., et al. 2008, MNRAS, 389, 113
- Patat et al. (2005) Patat, F., Baade, D., Wang, L., Taubenberger, S., & Wheeler, J. C. 2005, IAU Circ. 8631
- Patat et al. (2007) Patat, F., et al. 2007, Science, 317, 924
- Pauldrach et al. (1996) Pauldrach, A. W. A., Duschinger, M., Mazzali, P. A., Puls, J., Lennon, M., & Miller, D. L. 1996, A&A, 312, 525
- Phillips et al. (2007) Phillips, M. M., et al. 2007, PASP, 119, 360
- Poole et al. (2008) Poole, T. S., et al. 2008, MNRAS, 383, 627
- Pugh & Li (2005) Pugh, H., & Li, W., 2005, IAU Circ., 8534, 1
- Pun et al. (1995) Pun, C. S. J., et al. 1995, ApJS, 99, 223
- Quimby et al. (2006a) Quimby, R., Brown, P., Gerardy, C., Odewahn, S. C., & Rostopchin, S. 2006, CBET, 393, 1
- Quimby et al. (2006b) Quimby, R., Brown, P., Caldwell, J., & Rostopchin, S. 2006b, Central Bureau Electronic Telegrams, 471, 1
- Quimby et al. (2007) Quimby, R. M., Wheeler, J. C., Höflich, P., Akerlof, C. W., Brown, P. J., & Rykoff, E. S. 2007, ApJ, 666, 1093
- Roming et al. (2005) Roming, P. W. A. et al. 2005, Space Sci. Rev., 120,95
- Salvo & Schmidt (2005) Salvo, M., & Schmidt, B. 2005, IAU Circ. 8581, 2
- Sauer et al. (2008) Sauer, D. N., et al. 2008, MNRAS, 391, 1605
- Sahu et al. (2007) Sahu, D. K., et al. 2008, ApJ, 680, 580
- Schawinski et al. (2008) Schawinski, K., et al. 2008, Science, 321, 223
- Schlegel et al. (1998) Schlegel, D. J., Finkbeiner, D. P., & Davis, M. 1998, ApJ, 500, 525
- Serduke et al. (2005) Serduke, F. J. D., Wong, D. S., & Filippenko, A. V. 2005, CBET, 269, 1
- Soderberg et al. (2008) Soderberg, A. M., et al. 2008, Nature, 453, 469
- Stanishev et al. (2007) Stanishev, V., et al. 2007, American Institute of Physics Conference Series, 924, 336
- Suzuki & Migliardi (2006) Suzuki, S., & Migliardi, M. 2006, IAU Circ., 8667, 1
- Taubenberger et al. (2008) Taubenberger, S., et al. 2008, MNRAS, 385, 75
- Turatto (2003) Turatto, M. 2003, Supernovae and Gamma-Ray Bursters, 598, 21
- Yamaoka et al. (2005) Yamaoka, H., 2005. IAU Circ. 8490, 2
- Wang et al. (2008a) Wang, X., et al. 2008a, ApJ, 675, 626
- Wang et al. (2008b) Wang, X., et al. 2008b, arXiv:0811.1205
- Wheeler et al. (1986) Wheeler, J. C., et al. 1986, PASP, 98, 1018
- Waxman et al. (2007) Waxman, E., Mészáros, P., & Campana, S. 2007, ApJ, 667, 351
| SN | Type | Coordinates [J2000.0] | Host Galaxy | Offset [arcsec] | z |
|---|---|---|---|---|---|
| (1) | (2) | (3) | (4) | (5) | (6) |
| SN 2005am | Ia | NGC 2811 | 17E 31N | 0.007 | |
| SN 2005cf | Ia | MCG-01-39-003 | 15W 123N | 0.006 | |
| SN 2005cs | II | M51 | 15W 67S | 0.002 | |
| SN 2005df | Ia | NGC 1559 | 15E 40N | 0.004 | |
| SN 2005hk | Ia | UGC 272 | 17E 6N | 0.013 | |
| SN 2005ke | Ia | NGC 1371 | 40E 40S | 0.005 | |
| SN 2006X | Ia | M100 | 12W 48S | 0.005 | |
| SN 2006bp | II | NGC 3953 | 62E 93N | 0.003 | |
| SN 2006jc | Ib/pec | UGC 4904 | 11W 7S | 0.005 |
Note. — (1) SN name; (2) SN Type; (3) R.A. and Dec.; (4) host galaxy name; (5) SN positional offset with respect to the nucleus of the host galaxy; (6) red-shift of the host galaxy, from NASA/IPAC Extragalactic Database (NED) and references therein.
| SN (Type) | Grism | Date | JD | Exposure Time | Epoch |
|---|---|---|---|---|---|
| (1) | (2) | (3) | (4) | (5) | (6) |
| SN 2005am (Ia) | UV | 2005-03-08 | 2453437.5 | 1657.8 | -1** Spectrum contaminated by field star. |
| V | 2005-03-08 | 2453438.2 | 1784.1 | 0 | |
| UV | 2005-03-09 | 2453439.1 | 2232.4 | +1 | |
| V | 2005-03-10 | 2453440.1 | 2290.3 | +2 | |
| V | 2005-03-15 | 2453445.4 | 1800.0 | +7 | |
| V | 2005-03-17 | 2453447.3 | 1799.4 | +9 | |
| UV | 2005-03-18 | 2453448.4 | 1533.5 | +10** Spectrum contaminated by field star. | |
| UV | 2005-03-22 | 2453451.6 | 1777.6 | +14** Spectrum contaminated by field star. | |
| V | 2005-03-23 | 2453452.6 | 1810.4 | +15 | |
| UV | 2005-03-24 | 2453454.0 | 1441.0 | +16** Spectrum contaminated by field star. | |
| SN 2005cf (Ia) | UV | 2005-06-04 | 2453526.2 | 1577.1 | 7.8 |
| V | 2005-06-04 | 2453526.3 | 1391.5 | 7.7 | |
| UV | 2005-06-05 | 2453527.2 | 1626.9 | 6.8 | |
| V | 2005-06-05 | 2453527.3 | 993.4 | 6.7 | |
| UV | 2005-06-06 | 2453528.2 | 1385.6 | 5.8 | |
| V | 2005-06-06 | 2453528.3 | 1371.4 | 5.7 | |
| V | 2005-06-07 | 2453529.3 | 55.3 | 4.7 | |
| UV | 2005-06-08 | 2453530.3 | 1438.3 | 3.7 | |
| UV | 2005-06-09 | 2453531.0 | 531.7 | 3.0 | |
| UV | 2005-06-10 | 2453532.2 | 460.9 | 1.8 | |
| V | 2005-06-10 | 2453532.3 | 1544.0 | 1.7 | |
| UV | 2005-06-11 | 2453533.1 | 1679.7 | 0.9 | |
| V | 2005-06-11 | 2453533.2 | 1580.5 | 0.8 | |
| V | 2005-06-15 | 2453536.6 | 1511.4 | +2.6 | |
| UV | 2005-06-16 | 2453537.8 | 1507.6 | +3.8 | |
| V | 2005-06-16 | 2453538.4 | 1505.6 | +4.4 | |
| UV | 2005-06-17 | 2453538.8 | 1342.4 | +4.8 | |
| V | 2005-06-17 | 2453539.2 | 1647.4 | +5.2 | |
| UV | 2005-06-20 | 2453542.2 | 1663.1 | +8.2 | |
| V | 2005-06-20 | 2453542.3 | 1564.7 | +8.3 | |
| UV | 2005-06-26 | 2453547.8 | 1665.1 | +13.8 | |
| UV | 2005-06-29 | 2453550.6 | 1767.2 | +16.6 | |
| SN 2005cs (IIP) | V | 2005-07-03 | 2453555.1 | 2045.3 | +6 |
| UV | 2005-07-03 | 2453555.2 | 2041.4 | +6 | |
| V | 2005-07-06 | 2453557.7 | 2104.4 | +9 | |
| UV | 2005-07-06 | 2453557.8 | 2102.0 | +9 | |
| UV | 2005-07-08 | 2453560.1 | 1985.9 | +11 | |
| UV | 2005-07-11 | 2453562.9 | 2042.8 | +14 | |
| UV | 2005-07-13 | 2453564.6 | 1760.1 | +16**** Very low S/N spectrum (average S/N 5). | |
| UV | 2005-07-19 | 2453570.7 | 1924.4 | +22**** Very low S/N spectrum (average S/N 5). | |
| SN 2005df (Ia) | UV | 2005-08-11 | 2453593.5 | 1608.9 | 7 |
| UV | 2005-08-14 | 2453596.6 | 976.9 | 4 | |
| UV | 2005-08-17 | 2453600.4 | 1986.3 | 1 | |
| UV | 2005-08-21 | 2453604.1 | 415.4 | +3 | |
| SN 2005hk (Ia) | UV | 2005-11-08 | 2453682.7 | 2014.9 | 2.4 |
| SN 2005ke (Ia) | UV | 2005-11-15 | 2453690.0 | 1836.0 | 9**** Very low S/N spectrum (average S/N 5). |
| V | 2005-11-17 | 2453692.3 | 478.8 | 7 | |
| UV | 2005-11-20 | 2453694.9 | 1633.4 | 4 | |
| UV | 2005-11-22 | 2453696.9 | 3068.6 | 2 | |
| SN 2006X (Ia) | V | 2006-02-09 | 2453775.9 | 1263.5 | 10.3 |
| V | 2006-02-18 | 2453785.4 | 2740.0 | 0.8 | |
| SN 2006bp (IIP) | UV | 2006-04-12 | 2453837.6 | 662.1 | +3** Spectrum contaminated by field star. |
| UV | 2006-04-14 | 2453839.8 | 607.9 | +5** Spectrum contaminated by field star. | |
| UV | 2006-04-14 | 2453840.2 | 768.4 | +5** Spectrum contaminated by field star. | |
| UV | 2006-04-16 | 2453841.8 | 2479.7 | +7** Spectrum contaminated by field star. | |
| UV | 2006-04-16 | 2453842.2 | 1264.47 | +7** Spectrum contaminated by field star. | |
| UV | 2006-04-18 | 2453843.3 | 2430.5 | +9 | |
| V | 2006-04-21 | 2453846.8 | 2697.6 | +12 | |
| UV | 2006-04-23 | 2453848.6 | 3202.9 | +14 | |
| SN 2006jc (Ib) | UV | 2005-10-17 | 2454025.6 | 2024.1 | +21 |
| UV | 2006-10-20 | 2454028.4 | 2201.0 | +25 | |
| V | 2006-10-23 | 2454031.8 | 1492.2 | +28 | |
| UV | 2006-11-04 | 2454043.5 | 2909.7 | +40 | |
| V | 2006-11-04 | 2454043.6 | 1910.0 | +40** Spectrum contaminated by field star. | |
| V | 2006-11-19 | 2454059.0 | 3820.0 | +46** Spectrum contaminated by field star. |
Note. — (1) Name of the SN and Type; (2) UVOT grism used; (3) observation date (yy-mm-dd); (4) start of the UV grism observation in Julian Days; (5) exposure time in unit of seconds; (6) days after the -band maximum light for SNe Ia or after explosion day for CC SNe (Type Ib/c and Type II)
| Swift Spec. | Ground-Based Spec.a | Offset | ||
|---|---|---|---|---|
| Grism | JD [days] | Teles./Instrum. | JD [days] | [Å] |
| UV | 2453526.2 | CA3.5m/PMAS | 2453525.4 | 0 |
| V | 2453526.3 | CA3.5m/PMAS | 2453525.4 | 0 |
| UV | 2453527.2 | TNG/DOLORES | 2453527.6 | 8 |
| V | 2453527.3 | TNG/DOLORES | 2453527.6 | 22 |
| UV | 2453528.2 | NTT/EMMI | 2453528.7 | 24 |
| V | 2453528.3 | NTT/EMMI | 2453528.7 | 13 |
| UV | 2453530.3 | NOT/ALFOSC | 2453530.4 | 12 |
| UV | 2453531.0 | NOT/ALFOSC | 2453530.4 | 16 |
| UV | 2453532.2 | NOT/ALFOSC | 2453531.5 | 6 |
| V | 2453532.3 | NOT/ALFOSC | 2453531.5 | 12 |
| UV | 2453533.1 | NOT/ALFOSC | 2453533.0 | 19 |
| V | 2453533.2 | NOT/ALFOSC | 2453533.0 | 27 |
| V | 2453538.4 | CA2.2m/CAFOS | 2453538.4 | 56 |
| UV | 2453538.8 | CA2.2m/CAFOS | 2453538.4 | 8 |
| V | 2453539.2 | CA2.2m/CAFOS | 2453538.4 | 66 |
| Swift Spec. | Ground-Based Spec.a | Offset | ||
|---|---|---|---|---|
| Grism | JD [days] | Teles./Instrum. | JD [days] | [Å] |
| SN 2005cs | ||||
| V | 2453555.1 | Ekar/AFOSC1 | 2453554.4 | 0 |
| UV | 2453555.2 | Ekar/AFOSC1 | 2453554.4 | –∗ |
| V | 2453557.7 | Ekar/AFOSC1 | 2453557.4 | –∗ |
| UV | 2453557.8 | Ekar/AFOSC1 | 2453557.4 | –∗ |
| UV | 2453560.1 | FLWO/FAST2 | 2453560.7 | -23 |
| UV | 2453562.9 | FLWO/FAST2 | 2453562.7 | -33 |
| SN 2006bp | ||||
| UV | 2453843.3 | McDonald Obs/HET3 | 2453844.1 | –∗ |
| V | 2453846.8 | McDonald Obs/HET3 | 2453846.1 | -28 |
| UV | 2453848.6 | FLWO/FAST2 | 2453849.7 | –∗ |
| SN 2006jc | ||||
| UV | 2454025.6 | Ekar/AFOSC4 | 2454024.7 | 0 |
| UV | 2454028.4 | IAO/HCT5 | 2454029.49 | 0 |
| V | 2454031.8 | IAO/HCT5 | 2454032.46 | 0 |
| UV | 2454043.5 | IAO/HCT5 | 2454041.48 | 4 |