Optical and submillimetre observations of Bok globules – tracing the magnetic field from low to high density
Abstract
We present optical and submillimetre polarimetry data of the Bok globule CB3. We also present optical polarimetry and submillimetre continuum data of the Bok globule CB246. We use each set of polarimetry data to infer the magnetic field orientation in each of the clouds. The optical data can only trace the field orientation in the low density edge regions of clouds, because if the extinction is too high then no optical emission is transmitted. The submillimetre data can only trace the field orientation in the high density central regions of the clouds, because current submillimetre polarimeters are only sensitive to high column densities.
It has previously been found that near-infrared polarisation mapping of background stars does not accurately trace the magnetic field in dense cloud regions, and hence that the grains responsible for near-infrared polarisation are under-represented in those regions. This may be due to a lack of aligned grains in dense regions. We test this by comparing the field orientations measured by our two independent methods of optical and submillimetre polarimetry. We find that the field orientation deduced from the optical data matches up well with the orientation estimated from the submillimetre data. We therefore claim that both methods are accurately tracing the same magnetic field in CB3. Hence, in this case, there must be significant numbers of aligned dust grains in the high density region, and they do indeed trace the magnetic field in the submillimetre.
We find an offset of 4014 degrees between the magnetic field orientation and the short axis of the globule. This is consistent with the mean value of 313 degrees found in our previous work on prestellar cores, even though CB3 is a protostellar core. CB246 is a prestellar core, and in this case the offset between the magnetic field orientation inferred from the optical polarisation data and the short axis of the core inferred from the submillimetre continuum data is 2820 degrees. Taken together, the six prestellar cores that we have now studied in this way show a mean offset between magnetic field orientation and core short axis of 303 degrees, in apparent contradiction with some models of magnetically dominated star formation.
keywords:
stars: formation – ISM: clouds – ISM: dust, extinction – polarimetry1 Introduction
Many models of star formation predict that magnetic fields play some role in the star formation process (Mestel & Spitzer, 1956; Mouschovias, 1976a, b; Nakano & Nakamura, 1978; Ciolek & Mouschovias, 1994; Ostriker, Gammie, & Stone, 1999; Li & Nakamura, 2004). However, measuring magnetic fields in space is notoriously difficult. Zeeman measurements allow one to measure the line-of-sight field strength using the line splitting of different electronic magnetic moment states in the presence of a magnetic field (Zeeman, 1897; Verschuur, 1969; Crutcher, 1999; Troland & Crutcher, 2008). Faraday rotation of a background polarized source seen through a region containing a magnetic field can also be used to measure the line-of-sight field strength through that region (Burn, 1966; Sokoloff et al., 1998).
The orientation of the magnetic field in the plane of the sky can be measured via the effects of aligned dust grains. The method of grain alignment has been a matter of debate for many years (e.g. Davis & Greenstein, 1951; Jones & Spitzer, 1967; Purcell, 1979; Lazarian, 1995a, b; Draine & Weingartner, 1996). However, the various methods are generally lumped together under the name of the Davis-Greenstein effect (Davis & Greenstein, 1951).
All methods predict that the grains align with their long axes perpendicular to the magnetic field. Hence in the optical and near-infrared, where the polarization is caused by preferential extinction by aligned elongated grains of a background unpolarized source (Hall, 1949; Hiltner, 1949), the polarization orientation is parallel to the field. In the far-infrared and submillimetre, where the polarization is caused by preferential emission from aligned elongated dust grains (Dennison, 1977; Cudlip et al., 1982; Hildebrand, Dragovan, & Novak, 1984), the polarization orientation is perpendicular to the field orientation (Dennison, 1977).
The method of tracing the magnetic field using optical polarization of background starlight typically only works in regions of low extinction (AV 1–5). So this technique is mainly applicable towards the low-density edge regions of the clouds. This is because these data use preferential extinction of background starlight by aligned grains to produce the polarisation. At higher extinctions the background starlight tends to be completely extinguished and it is not possible to measure any polarization (e.g. Vrba, Strom, & Strom, 1976; Wilking et al., 1979)
The method of tracing the magnetic field using submillimetre polarization by preferential emission can typically only be measured in regions of high extinction – AV 10-100 (e.g., Ward-Thompson et al., 2000; Matthews, Wilson, & Fiege, 2001; Kirk, Ward-Thompson, & Crutcher, 2006). Hence the submillimetre data can only trace the field orientation towards the high density central regions of the clouds. This is because these data use preferential emission from aligned dust grains to produce the polarisation, and are only sensitive to very high column densities in cloud centres.
At lower column densities, submillimetre polarimeters do not currently have the sensitivity to detect polarized emission. Furthermore, the nature of the usual data-taking method, using a chopping secondary mirror, ensures that any spatially extended components associated with the outer parts of the cloud are chopped away. Consequently, a combination of these two methods, of optical and submillimetre polarimetry, in theory provides a way of tracing the magnetic field from the low extinction outer parts of molecular clouds, to the high extinction, compact, central, dense parts of clouds.
It has previously been found (Goodman et al., 1995) that near-infrared polarisation mapping of background stars does not accurately trace the magnetic field in dense cloud regions. This is based on the observation that near-infrared polarisation levels, caused by preferential extinction by aligned grains, do not appear to rise sufficiently in denser cloud regions (Goodman et al., 1995).
This is not an effect of extinction preventing the infrared emission from escaping the cloud. Instead, these authors concluded that the grains responsible for polarising background starlight are under-represented in dense cloud regions (Goodman et al., 1995). There are two possible explanations for this: either there is a lack of aligned grains in dense regions; or that only a small fraction of the dust grain size population in dense regions lies in the correct size range to polarise near-infrared emission from background stars.
In this paper we attempt to test the first of these hypotheses, whether or not there are significant numbers of aligned grains in high density regions. We do this by comparing submillimetre polarization measurements in high-density regions with optical polarization measurements in lower-density regions of the same cloud for a case in which both sets of measurements have been taken.
The submillimetre data cannot be affected by lower density foreground, or extended, field components, since they are not sensitive to these components. If the submillimetre and optical polarisations agree, then it would be difficult to avoid the conclusion that the magnetic field is continuous from low to high density and that the dust grains in the high-density regions are tracing the magnetic field in those regions. This would lead to the conclusion that there are significant numbers of aligned grains in the high-density regions.
2 Observations
Optical polarization measurements were made at the 1.2-metre telescope at Gurushikhar, Mount Abu, India, at latitude 24o 36′, longitude 72o 43′ (Sen et al., 2000). The Cassegrain focal station was used, giving an focus. The instrument used was the Imaging Polarimeter, IMPOL, of the Inter University Centre for Astronomy and Astrophysics (IUCAA), Pune, India. A description of the instrument is given by Sen & Tandon (1994) and Ramaprakash et al. (1998).
The design of the IMPOL polarimeter was based on the Durham Polarimeter (Scarrott et al., 1983; Ward-Thompson et al., 1985). It uses a Wollaston prism and half-wave plate to observe two orthogonal polarization states simultaneously. This removes the effects of sky polarization. A CCD camera was used to image the data. A broad-band white light filter was used, which corresponds to the wavelength range 0.45–0.7 m. The observations were carried out with typically a 500-sec exposure time for each object. The polarimetric data reduction procedure is described in detail by Sen et al. (2000).
We here report on optical polarization data of Bok globules CB3 and CB246, from the catalogue of Clemens & Barvainis (1988). These data were first published by Sen et al. (2000) as part of a larger study. The data were taken on 1997 December 23–25. The polarization was measured of stars background to the clouds and seen through the cloud periphery. The stars are generally of visual magnitude 12 or fainter.
| No. | R.A. | Dec. | PA | ||||
| (2000) | (2000) | [∘] | |||||
| Submm | |||||||
| – | 00h | 28m | 45.1s | +56∘ | 41′ | 55′′ | 9019 |
| – | 00h | 28m | 42.7s | +56∘ | 41′ | 55′′ | 9814 |
| – | 00h | 28m | 40.3s | +56∘ | 41′ | 55′′ | 598 |
| – | 00h | 28m | 45.1s | +56∘ | 42′ | 15′′ | 9912 |
| – | 00h | 28m | 42.7s | +56∘ | 42′ | 15′′ | 10214 |
| – | 00h | 28m | 40.3s | +56∘ | 42′ | 15′′ | 4618 |
| – | 00h | 28m | 45.1s | +56∘ | 42′ | 35′′ | 4723 |
| – | 00h | 28m | 40.3s | +56∘ | 42′ | 35′′ | 5815 |
| – | 00h | 28m | 37.8s | +56∘ | 42′ | 35′′ | 527 |
| – | 00h | 28m | 45.1s | +56∘ | 42′ | 55′′ | 879 |
| Optical | |||||||
| 16 | 00h | 28m | 39.0s | +56∘ | 41′ | 19′′ | 736 |
| 19 | 00h | 28m | 49.0s | +56∘ | 41′ | 45′′ | 761 |
| 20 | 00h | 28m | 40.2s | +56∘ | 41′ | 48′′ | 1061 |
| 21 | 00h | 28m | 46.1s | +56∘ | 41′ | 50′′ | 702 |
| 27 | 00h | 28m | 43.5s | +56∘ | 42′ | 52′′ | 661 |
| 29 | 00h | 28m | 43.7s | +56∘ | 43′ | 18′′ | 716 |
Maps of the optical polarization vectors for these globules were mostly produced for the outer parts of the clouds, where the optical extinction was not so high. CB3 exhibited polarization values generally below 2% , whereas for CB246 it was a little higher. A detailed analysis of the nature of these polarization values was presented by Sen et al. (2005).
The submillimetre observations were made at the James Clerk Maxwell Telescope (JCMT), Mauna Kea, Hawaii, using the Submillimetre Common User Bolometer Array (SCUBA). SCUBA contained a pair of hexagonal, close-packed, bolometer arrays that could take data at 850 and 450 microns simultaneously, using a dichroic beam-splitter (Holland et al., 1999). SCUBA polarisation measurements were taken with the SCUBA polarimeter, SCUBAPOL (Greaves et al., 2003), which used a rotating half-waveplate and fixed analyser.
The waveplate was stepped through 16 positions (each offset from the last by 22.5∘) and a Nyquist-sampled image (using a 16-point jiggle pattern) was taken at each waveplate position (Holland et al. 1996; Greaves et al. 2003). The observations were carried out whilst chopping the secondary mirror 120 arcsec in azimuth at 7 Hz and synchronously detecting the signal, thus rejecting sky emission. The integration time per point in the jiggle cycle was 1 sec, in each of the left and right beams of the dual-beam telescope chop. The total on-source integration time per complete cycle was 512 sec. Only 850-micron data have been used in this paper. The instrumental polarization (IP) was removed using the measured value of Greaves et al. (2003). This was 0.920.05% at a position angle of 1632 degrees. This was measured on planets and found to be stable with time. The main cause of the IP was believed to be the telescope wind blind. SCUBA and SCUBAPOL suspended operations in 2006, pending the commissioning of the next generation SCUBA2 instrument.
Di Francesco et al. (2008) and Matthews et al. (2009) have released near-complete legacy datasets for SCUBA and SCUBAPOL respectively. The SCUBA polarisation data presented in this paper come from the Matthews et al. (2009) legacy data set. The data were originally taken on 1998 August 10. The Stokes I, Q & U maps were calculated by Matthews et al. (2009) by fitting a sinusoid to the intensity measurements from the different waveplate angles. The Stokes maps were then converted by us into tabulated lists of polarisation vectors. We binned the I, Q & U maps to a resolution of 20 arcsec, and then calculated the polarisation vector at each pixel. Finally, a signal-to-noise ratio cut was applied to remove spurious vectors. The remaining vectors are plotted in Figure 1.
The continuum submillimetre data were taken separately from the polarisation data. For CB3 the data were downloaded from the SCUBA data archive while the data for CB246 were taken from Launhardt et al. (2009). The data were reduced in the usual manner (see, for example, Nutter & Ward-Thompson, 2007) using the SURF software package (Jenness & Lightfoot, 2000). The submillimetre zenith opacity for atmospheric extinction removal was determined by comparison with the 1.3-mm sky opacity (Archibald et al., 2002).
3 Results
3.1 CB3
CB3 was catalogued by Clemens & Barvainis (1988), who noted it has an angular size of 6.75.6 arcmin. It is also known as Lynds 594 (Lynds, 1962). It lies at an approximate distance of 2.5kpc (Launhardt & Henning, 1997). It contains at least two young stellar objects (YSOs), one of which is a Class 0 source (Andre, Ward-Thompson, & Barsony, 1993) driving a chemically active bipolar outflow (Codella & Bachiller, 1999). Additionally there appear to be more than 20 very red K-band sources in the field clustered around the core (Launhardt et al., 1998). This cluster was compared to the submillimetre emission by Huard, Weintraub, & Sandell (2000). CB3 is sometimes referred to as a site of intermediate mass star formation (Codella & Bachiller, 1999; Klein et al., 2000). It is coincident with the IRAS source 00259+5625, which has a luminosity of 930 L⊙ (Codella & Bachiller, 1999). There is also a water maser source associated with this globule (Scappini, Caselli, & Palumbo, 1991).
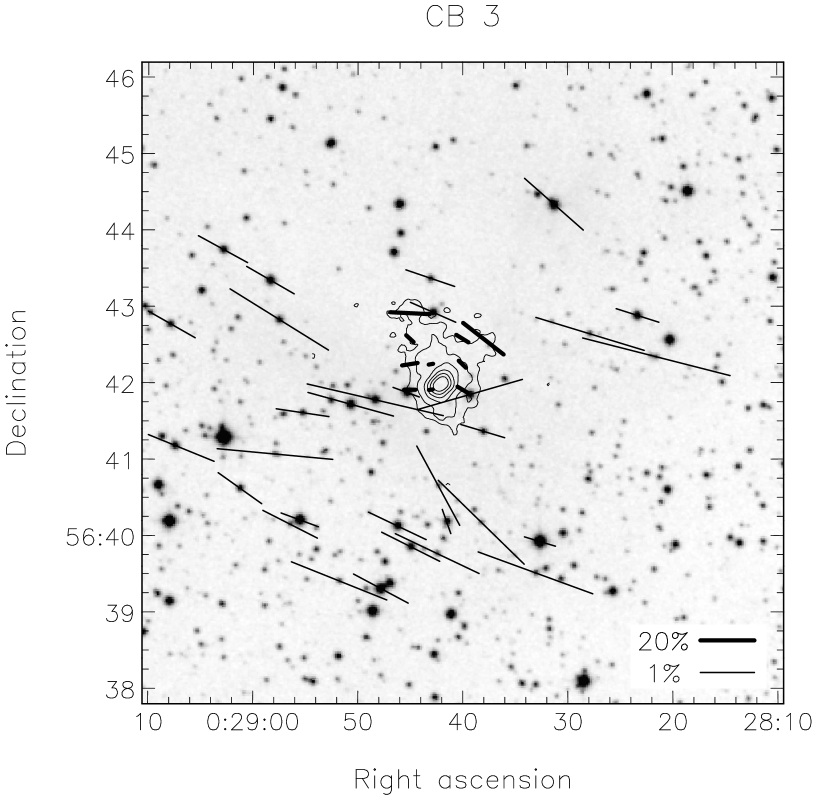
Figure 1 shows the optical and submillimetre polarisation maps of CB3, superposed on a contour map of submillimetre continuum emission and a grey-scale image of optical continuum emission. The region of brightest submillimetre emission coincides with a blank area in the optical image, as expected for a dark dust cloud. Nevertheless, background stars are visible through the edge of the cloud. The optical and submillimetre polarisation vectors mostly appear to lie in a similar orientation.
We find the E(BV) colours of the background stars to all lie in the range between 0.1 and 0.6 (Sen et al., in prep.). Taking the canonical ratio (Whittet et al., 2008, and references therein), we therefore estimate that these stars have AV 0.3–1.8. In the region covered by the outermost submillimetre contour, the mean column density is 1022cm-2 (Launhardt et al., 1997). This corresponds approximately to AV 10 (Frerking et al., 1982). This is precisely the level of extinction in which Goodman et al., (1995) found near-infrared polarisation levels lower than expected.
Table 1 lists the positions and position angles of the submillimetre vectors across CB3. The angles have been rotated by 90 degrees to show the orientation of the magnetic field. The mean and standard deviation of the position angle of the magnetic field derived from the Q and U values at each of the 10 positions is 6914 degrees.
Table 1 also lists the six optical magnetic field vectors which are closest to the submillimetre vectors – those optical vectors within an arcmin of the centre of the submillimetre emission. The mean and standard deviation of the position angle of these six optical vectors is 7715 degrees. Vector number 20 is seen to be significantly different from the other five vectors. This may be due to it being a foreground star. We note that it does have a lower than average value of E(B-V), consistent with this explanation (Sen et al., in prep.). If we exclude this vector and calculate the mean of the remainder, we obtain a mean of 724 degrees.
Therefore, we see that the field orientation as estimated from the submillimetre polarisation is in very good agreement with that estimated from the optical polarisation. Consequently, we deduce that the magnetic field is continuous from the low to the high density regions, with a mean position angle of 7114 degrees. Furthermore, the dust grains in the high density region appear to be tracing the magnetic field well.
The submillimetre contours on Figure 1 show that this Bok globule is elongated. The same elongation is seen in various molecular line tracers of this core, such as CS (Codella & Bachiller 1999). We estimate that the position angle of the long axis of the globule is 215 degrees. This is at an angle of 5014 degrees to the magnetic field orientation. Models of magnetically dominated star formation predict that the magnetic field should lie along the short axis of the star-forming core (e.g. Ciolek & Mouschovias, 1994, 1998; Li & Shu, 1996). In this case we see an offset of 4014 degrees from the short axis. This is similar to results we have seen previously in prestellar cores (Ward-Thompson et al., 2000; Kirk, Ward-Thompson, & Crutcher, 2006). We return to this in section 4 below.
3.2 CB246
CB246 was catalogued by Clemens & Barvainis (1988), who noted it has an angular size of 7.84.5 arcmin. It is also known as Lynds 1253 (Lynds, 1962). It lies at an approximate distance of 140pc (Launhardt & Henning, 1997). It is a starless core, possibly prestellar in nature (Ward-Thompson et al., 2007). Scappini & Codella (1996) list this source as inactive, with neither a water maser nor molecular outflow. However, their detection of NH3 and C2S made them postulate that the source was more advanced than the other sources in their survey. They followed up their survey with a targeted observation (Codella & Scappini, 1998), which confirmed their earlier findings. Lee, Myers, & Tafalla (2001) classified CB246 as having significant red excess, but no blue asymmetry in the CS spectra, indicating that the core has not begun to collapse.
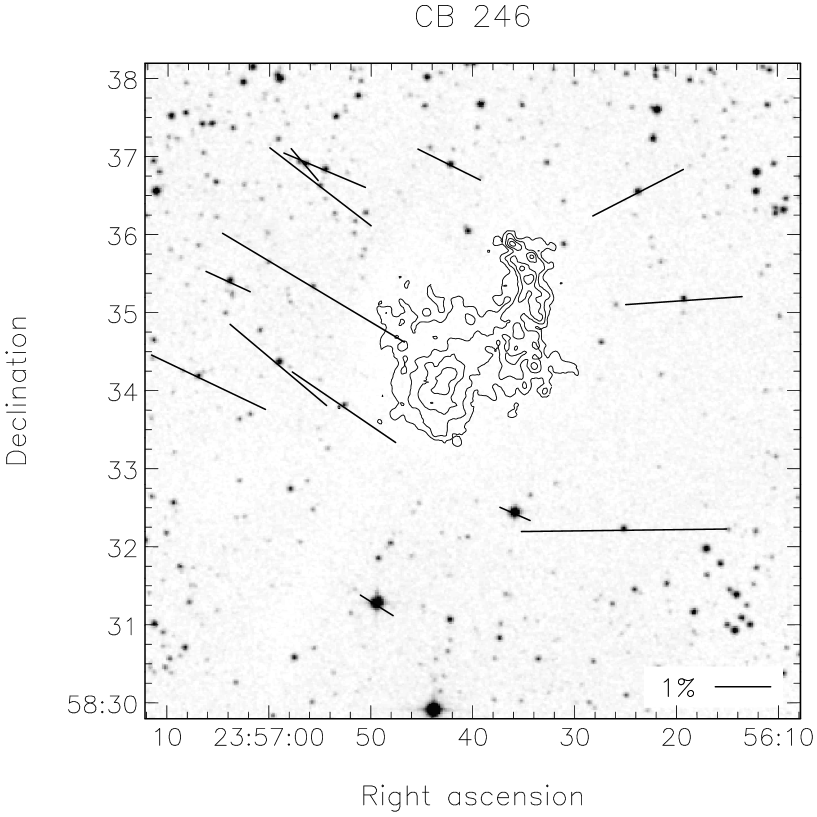
Figure 2 shows the optical polarisation map of CB246, superposed on a contour map of submillimetre continuum emission and a grey-scale image of optical continuum emission. The region of brightest submillimetre emission coincides with a blank area in the optical image, as expected for a dark dust cloud. Nevertheless, background stars are visible through the edge of the cloud. No submillimetre polarimetry data were available for this cloud, but we can infer the plane-of-sky magnetic field orientation from the optical polarisation vectors.
We note that the vectors to the east of the core centre have a systematically different mean position angle from those to the west. Similarly the core long axis orientation also appears to shift from east to west. Therefore, we compare the mean position angles of the magnetic field and core long axis separately in the eastern and western parts of the core. In the east, the plane-of-sky magnetic field lies at a position angle of 603 degrees. The long axis of the core in the east appears to lie along a position angle of roughly 1225 degrees. Hence the short axis is at position angle 325 degrees. The approximate angular offset between the magnetic field and the short axis of the globule is therefore 288 degrees for the eastern half of the core.
In the west, the plane-of-sky magnetic field lies at a position angle of 945 degrees. The long axis of the core in the west appears to lie along a position angle of roughly 1575 degrees. Hence the short axis is at position angle 675 degrees. The approximate angular offset between the magnetic field and the short axis of the globule is therefore 2710 degrees for the western half of the core.
The weighted mean of these two offsets is therefore 28 degrees. The mathematical error-bar on this value is less than 10 degrees. However, given that the core and field both curve by more than 30 degrees we do not claim an error-bar of less than 20 degrees for this estimate, as this is the error-bar obtained if one treats the whole core simultaneously. A detailed submillimetre polarisation map of CB246 could potentially confirm that the curvature of the field exactly mirrors the curvature of the core throughout its length. In that case a smaller error-bar could be ascribed to the offset value. Nevertheless, the value of 28 degrees is still consistent with prestellar cores we have observed previously (see next section).
| Core | Offset |
|---|---|
| L1544 | 29 6 |
| L183 | 34 6 |
| L43 | 44 6 |
| L1498 | 19 12 |
| L1517B | 25 6 |
| CB3 | 40 14 |
| CB246 | 28 20 |
4 Discussion
The fact that we have observed a consistent magnetic field orientation in CB3 for both the optical and submillimetre polarisation data shows that both are tracing the same magnetic field. This implies that dust grains in the high-density regions of this globule are indeed tracing the magnetic field. Hence, there must be significant numbers of aligned grains in the high-density regions. Furthermore, the magnetic fields must be continuous from low to high density. Therefore, the previous finding (Goodman et al., 1995), that dust grains in high-density regions do not trace the magnetic field in near-infrared polarisation measurements, cannot be explained by a lack of aligned grains. Our findings are consistent with those of Whittet et al. (2008), who conclude from their data that there is no change in grain alignment efficiency from low- to high-density regions of dust clouds.
In addition, these data allow us to comment on the influence of magnetic fields on the star formation process. Magnetically-dominated models of star formation predict that a cloud should collapse first along the magnetic field lines, and then subsequently contract quasi-statically perpendicular to the field orientation (e.g. Ciolek & Mouschovias, 1994). Hence these models predict that the magnetic field should lie along the short axis of a collapsing cloud core.
Ward-Thompson et al. (2000) presented the first observations of the magnetic field geometry in pre-stellar cores when they mapped L183, L1544 and L43 with the SCUBA polarimeter. Their maps showed relatively smooth and uniform magnetic fields over the central core regions. However, in each case they observed an offset between the short axis of the core and the magnetic field orientation. Kirk, Ward-Thompson, & Crutcher (2006) studied the pre-stellar cores L1498 and L1517B in a similar manner and also observed similar offsets. An attempt to explain these offsets in terms of tri-axial cores viewed from arbitrary angles was proposed by Basu (2000), but no magnetic model incorporating this additional complication has been put forward.
Table 2 lists the cores observed previously, together with those from this work, and the offset observed in each case between the magnetic field orientation and the short axis of the core. The weighted mean offset of the five previously observed cores is 313 degrees. We note that the two globules observed in the current study both have offsets consistent with this value. This is in spite of the fact that CB3 is not a starless core, but a protostellar core. CB246 is a starless core. The weighted mean of the six starless cores in Table 2 is 303 degrees. This appears to be in contradiction with some models of magnetically moderated star formation.
5 Conclusions
We have used optical and submillimetre polarimetry of Bok globule CB3 to infer the magnetic field orientation. The optical data trace the field orientation in low density regions and the submillimetre data trace the field orientation in high density regions. We have tested a hypothesis that there is a lack of aligned dust grains in high density regions, causing near-infrared polarisation levels to be lower than expected, by comparing the field orientations measured by our two independent methods.
We found that the field orientation deduced from the optical polarization data matches up well with the orientation estimated from the submillimetre measurements. The inferred field lines join up from low to high extinction and produce a consistent and coherent picture of the whole magnetic field in CB3. We saw that both methods accurately trace the same magnetic field. Hence we deduce that there are significant numbers of aligned grains in the high-density regions of CB3. Furthermore, these aligned dust grains appear to trace the magnetic fields in those regions, as mapped in submillimetre polarisation.
We have also compared polarisation data with submillimetre continuum data in Bok globules CB3 and CB246. We have compared the field orientations with the core morphologies and found an offset in each case between the field orientation and the short axis of the globule. These offsets are consistent with those seen in previous studies of prestellar cores, despite the fact that, of our two globules, only CB246 is a starless core. Taken together, the six starless cores that we have now studied in this way are beginning to show a consistent picture of an offset between magnetic field orientation and core short axis of 303 degrees, in apparent contradiction with some models of magnetically dominated star formation.
Acknowledgements
JMK and DJN acknowledge the UK STFC for PDRA support through the Cardiff Astronomy Rolling Grant. The JCMT is operated by the Joint Astronomy Centre, Hawaii, on behalf of the UK STFC, the Netherlands NWO, and the Canadian NRC. The 1.2-metre telescope at Mount Abu is operated by the Physical Research Laboratory of India. This research used the facilities of the Canadian Astronomy Data Centre, operated by the National Research Council of Canada, with the support of the Canadian Space Agency. The Digitized Sky Survey was produced at the Space Telescope Science Institute under U.S. Government grant NAG W-2166. The images of these surveys are based on photographic data obtained using the Oschin Schmidt Telescope on Palomar Mountain and the UK Schmidt Telescope at Siding Spring. The plates were processed into the present compressed digital form at the Royal Observatory Edinburgh (ROE) photolabs, with the permission of these institutions. The authors also acknowledge the use of NASA’s SkyView facility (http://skyview.gsfc.nasa.gov).
References
- Andre, Ward-Thompson, & Barsony (1993) Andre P., Ward-Thompson D., Barsony M., 1993, ApJ, 406, 122
- Archibald et al. (2002) Archibald E. N., et al., 2002, MNRAS, 336,1
- Basu (2000) Basu S., 2000, ApJ, 540, L103
- Burn (1966) Burn B. J., 1966, MNRAS, 133, 67
- Ciolek & Mouschovias (1994) Ciolek G. E., Mouschovias T. C., 1994, ApJ, 425, 142
- Ciolek & Mouschovias (1998) Ciolek G. E., Mouschovias T. C., 1998, ApJ, 504, 280
- Clemens & Barvainis (1988) Clemens D. P., Barvainis R., 1988, ApJS, 68, 257
- Codella & Bachiller (1999) Codella C., Bachiller R., 1999, A&A, 350, 659
- Codella & Scappini (1998) Codella C., Scappini F., 1998, MNRAS, 298, 1092
- Crutcher (1999) Crutcher R. M., 1999, ApJ, 520, 706
- Cudlip et al. (1982) Cudlip W., Furniss I., King K. J., Jennings R. E., 1982, MNRAS, 200, 1169
- Davis & Greenstein (1951) Davis L. J., Greenstein J. L., 1951, ApJ, 114, 206
- Dennison (1977) Dennison B., 1977, ApJ, 215, 529
- Di Francesco et al. (2008) Di Francesco J., Johnstone D., Kirk H., MacKenzie T., Ledwosinska E., 2008, ApJS, 175, 277
- Draine & Weingartner (1996) Draine B. T., Weingartner J. C., 1996, ApJ, 470, 551
- Goodman et al. (1995) Goodman A. A., Jones T. J., Lada E. A., Myers P. C., 1995, ApJ, 448, 748
- Greaves et al. (2003) Greaves J. S., et al., 2003, MNRAS, 340, 353
- Hall (1949) Hall J. S., 1949, Sci, 109, 166
- Hildebrand, Dragovan, & Novak (1984) Hildebrand R. H., Dragovan M., Novak G., 1984, ApJ, 284, L51
- Hiltner (1949) Hiltner W. A., 1949, Sci, 109, 165
- Huard, Weintraub, & Sandell (2000) Huard T. L., Weintraub D. A., Sandell G., 2000, A&A, 362, 635
- Holland, Greaves et al. (1996) Holland W. S., Greaves J. S., Ward-Thompson D., André P., 1996, A&A, 309, 267
- Holland et al. (1999) Holland W. S., et al., 1999, MNRAS, 303, 659
- Jenness & Lightfoot (2000) Jenness T., Lightfoot J.F., 2000, Starlink User Note 216, Starlink Project, CCLRC
- Jones & Spitzer (1967) Jones R. V., Spitzer L. J., 1967, ApJ, 147, 943
- Kirk, Ward-Thompson, & Crutcher (2006) Kirk J. M., Ward-Thompson D., Crutcher R. M., 2006, MNRAS, 369, 1445
- Klein et al. (2000) Klein R., Henning T., Launhardt R., Feldt M., 2000, AGM, 17, 6
- Lasker (1994) Lasker B. M., 1994, IAUS, 161, 167
- Launhardt et al. (1998) Launhardt R., Evans N. J., II, Wang Y., Clemens D. P., Henning T., Yun J. L., 1998, ApJS, 119, 59
- Launhardt et al. (1997) Launhardt R., Ward-Thompson D., Henning T., 1997, MNRAS, 288, 45
- Launhardt et al. (2009) Launhardt R., Nutter D., Ward-Thompson D., Khanzadyan T., Bourke T. L., Wolf S., Henning Th., Zylka R., A&A, in prep.
- Launhardt & Henning (1997) Launhardt R., Henning T., 1997, A&A, 326, 329
- Lazarian (1995a) Lazarian A., 1995a, ApJ, 451, 660
- Lazarian (1995b) Lazarian A., 1995b, MNRAS, 277, 1235
- Lee, Myers, & Tafalla (2001) Lee C. W., Myers P. C., Tafalla M., 2001, ApJS, 136, 703
- Li & Nakamura (2004) Li Z.-Y., Nakamura F., 2004, ApJ, 609, L83
- Li & Shu (1996) Li Z.-Y., Shu F. H., 1996, ApJ, 472, 211
- Lynds (1962) Lynds B. T., 1962, ApJS, 7, 1
- Matthews, Wilson, & Fiege (2001) Matthews B. C., Wilson C. D., Fiege J. D., 2001, ApJ, 562, 400
- Matthews et al. (2009) Matthews B., McPhee C., Fissel L., Curran R., ApJS, 2009, in press
- McGlynn & Scollick (1994) McGlynn T., Scollick K., 1994, ASPC, 61, 34
- Mestel & Spitzer (1956) Mestel L., Spitzer L., Jr., 1956, MNRAS, 116, 503
- Mouschovias (1976a) Mouschovias T. C., 1976a, ApJ, 206, 753
- Mouschovias (1976b) Mouschovias T. C., 1976b, ApJ, 207, 141
- Nakano & Nakamura (1978) Nakano T., Nakamura T., 1978, PASJ, 30, 671
- Nutter & Ward-Thompson (2007) Nutter D., Ward-Thompson D., 2007, MNRAS, 374, 1413
- Ostriker, Gammie, & Stone (1999) Ostriker E. C., Gammie C. F., Stone J. M., 1999, ApJ, 513, 259
- Purcell (1979) Purcell E. M., 1979, ApJ, 231, 404
- Ramaprakash et al. (1998) Ramaprakash A. N., Gupta R., Sen A. K., Tandon S. N., 1998, A&AS, 128, 369
- Scappini & Codella (1996) Scappini F., Codella C., 1996, MNRAS, 282, 587
- Scappini, Caselli, & Palumbo (1991) Scappini F., Caselli P., Palumbo G. G. C., 1991, MNRAS, 249, 763
- Scarrott et al. (1983) Scarrott S. M., Warren-Smith R. F., Pallister W. S., Axon D. J., Bingham R. G., 1983, MNRAS, 204, 1163
- Sen & Tandon (1994) Sen A. K., Tandon S. N., 1994, SPIE, 2198, 264
- Sen et al. (2000) Sen A. K., Gupta R., Ramaprakash A. N., Tandon S. N., 2000, A&AS, 141, 175
- Sen et al. (2005) Sen A. K., Mukai T., Gupta R., Das H. S., 2005, MNRAS, 361, 177
- Sokoloff et al. (1998) Sokoloff D. D., Bykov A. A., Shukurov A., Berkhuijsen E. M., Beck R., Poezd A. D., 1998, MNRAS, 299, 189
- Troland & Crutcher (2008) Troland T. H., Crutcher R. M., 2008, ApJ, 680, 457
- Verschuur (1969) Verschuur G. L., 1969, ApJ, 156, 861
- Vrba, Strom, & Strom (1976) Vrba F. J., Strom S. E., Strom K. M., 1976, AJ, 81, 958
- Ward-Thompson et al. (1985) Ward-Thompson D., Warren-Smith R. F., Scarrott S. M., Wolstencroft R. D., 1985, MNRAS, 215, 537
- Ward-Thompson et al. (2000) Ward-Thompson D., Kirk J. M., Crutcher R. M., Greaves J. S., Holland W. S., André P., 2000, ApJ, 537, L135
- Ward-Thompson et al. (2007) Ward-Thompson D., André P., Crutcher R., Johnstone D., Onishi T., Wilson C., 2007, Protostars and Planets V, 33
- Whittet et al. (2008) Whittet D. C. B., Hough J. H., Lazarian A., Hoang T., 2008, ApJ, 674, 304
- Wilking et al. (1979) Wilking B. A., Lebofsky M. J., Kemp J. C., Rieke G. H., 1979, AJ, 84, 199
- Zeeman (1897) Zeeman P., 1897, ApJ, 5, 332