Discovery of three new pulsars in a 610 MHz pulsar survey with the GMRT
Abstract
We report on the discovery of three new pulsars in the first blind survey of the north Galactic plane (; ) with the Giant Meterwave Radio telescope (GMRT) at an intermediate frequency of 610 MHz. The survey covered 106 square degrees with a sensitivity of roughly 1 mJy to long-period pulsars (pulsars with period longer than 1 s). The three new pulsars have periods of 318, 933, and 1056 ms. Their timing parameters and flux densities, obtained in follow up observations with the Lovell Telescope at Jodrell Bank and the GMRT, are presented. We also report on pulse nulling behaviour in one of the newly discovered pulsars, PSR J2208+5500.
keywords:
Stars:neutron – Pulsars:general – Pulsars:individual:J0026+6320 – Pulsars:individual:J2208+5500 – Pulsars:individual:J2217+57331 Introduction
The earliest pulsar surveys typically used low frequencies (i.e. below MHz) due to technological constraints, the steep spectrum of pulsed radio emission and the larger low-frequency beamwidths (Large & Vaughan 1971; Manchester et al. 1978; Hulse & Taylor 1975; Stokes et al. 1986; Manchester et al. 1996). Recently, however, most pulsar surveys have been conducted at frequencies above GHz to combat the effects of dispersion and scattering of pulsed signal by the interstellar medium, and to take advantage of the wider bandwidths typically available at these frequencies. The most notable of these surveys was the Parkes multibeam survey, which has discovered almost half of the pulsars known to date (see, e.g., Manchester et al. 2001). The limitation of the small beamwidth at 20 cm in this survey was overcome by using a 13-beam receiver. This allowed longer (35 min) integration times, yielding sensitivities of 0.2 mJy to long-period pulsars with low dispersion measures (DMs), and making this the most sensitive pulsar survey carried out in the Southern sky to date.
In these surveys with single dish telescopes, there is a trade-off between the collecting area and the beamwidth, and consequently the rate of the survey. Such a limitation does not exist for a multi-element telescope such as Giant Meterwave Radio Telescope (GMRT), where a large number of smaller antennas can be combined to provide sensitivity equivalent to a larger dish and yet retain a relatively large beamwidth. In this paper, we report on the discovery of three new pulsars in an ongoing survey of the northern Galactic plane using this feature of the GMRT at 610 MHz. The survey was conducted at this frequency to compromise between pulsars’ increased flux density at low frequencies, interstellar scattering and dispersion, and beamwidth for the 45-m GMRT antennas. The observations, analysis and localization procedure is described in Sections 2 and 3. The parameters and the integrated profiles for the new pulsars are presented in Section 4.
2 Observations

The observations were conducted using the GMRT antennas in an incoherent array mode at a frequency of 610 MHz. The full width at half maximum (FWHM) of a 45-m GMRT antenna at this frequency is 0.67∘ (40 arcmin), giving a sky coverage per pointing of 0.4 square degrees, about two-thirds of the Parkes 13-beam receiver (Manchester et al. 2001). Each antenna provides two hands of circularly polarized voltages, received using a coaxial waveguide feed with a nominal bandwidth of 40 MHz. These signals are amplified with GaAs MESFET based uncooled low noise amplifiers. The system noise temperature for this configuration on cold sky is 101 K with a system equivalent flux density of 316 Jy. The amplified signals are mixed with appropriate local oscillators at each antenna to obtain two 32 MHz signals at an intermediate frequency of 70 MHz, which are transmitted to the central building using analog modulated optical signals over an optical fiber. The signals from each antenna are further mixed at the central building to obtain two 16 MHz sidebands for each polarization and are digitized with 4 bit precision for processing in an FX digital correlator.
For our observations, the GMRT correlator was used as a digital filterbank to obtain 256 spectral channels, each having a bandwidth of 62.5 KHz, across the 16 MHz upper sideband of each polarization received from each of the 30 antennas of GMRT. The digitized signals from typically 20 to 25 GMRT antennas were added after detecting the voltages in each channel, forming an incoherent sum of signals with the GMRT Array Combiner (GAC). The summed powers in each channel were then acquired into 16-bit registers every 16 s after summing the two polarizations in a digital backend and were accumulated before being written to an output buffer to reduce the data volume. The data were then acquired using a PCI card and recorded to an SDLT tape for off-line processing. The effective sampling time for this configuration, used for most of the survey, was 256 s. Roughly 25 percent of the survey in the beginning was carried out with a sampling time of 512 s.
High-pass filtering was usually employed in previous surveys, such as the Parkes multi-beam survey, to minimize the effect of slow gain variations as well as to remove a mean baseline allowing 1-bit digitization of data to reduce data volumes. No such high-pass filter is present in the entire acquisition chain for our survey. While this preserves higher signal-to-noise ratios (S/Ns) in our survey, it also makes us more sensitive to Radio Frequency Interference (RFI). Since high-pass filtering can lead to reduced sensitivity to long period pulsar candidates, one of the main targets of this survey, we chose not to filter the data for this experiment.
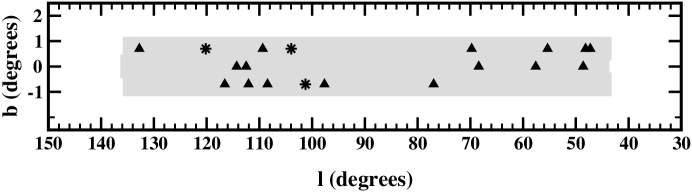
The survey covered an area of sky defined by Galactic coordinates in the range 45 and . In Fig. 1, we show the 300 pointings comprising the survey, for a total sky coverage of 106 square degrees. The survey pointings were arranged in three strips at constant Galactic latitude ( and 0.7) offset with each other by 0.7∘. Pointings were also separated by 0.9∘ in Galactic longitude. Each field was observed for 35 minutes. In a typical session, 1015 pointings were observed. In addition, known pulsars near the survey region, with flux densities ranging from 1 to 83 mJy at 610 MHz, were observed in some sessions to check the quality of data.
The observing bandpass can be displayed online and this was periodically checked to note the presence of any narrowband RFI feature. Such features are sometimes present in a small number of GMRT antennas only and the data quality can be improved by omitting these antennas at the cost of a marginal reduction of sensitivity. The antenna selection took this into account whenever possible.
The S/N of the combined output of an incoherent array of more than one antenna as compared to that for a single antenna improves by a factor , where is the number of antennas used and is an experimentally determined loss factor (0.8) introduced while adding antennas incoherently due to marginally different power levels across different antennas. The configuration, however, retains the 40’ FWHM of the primary beam of the single antenna. An incoherent array of 25 GMRT antennas provides a S/N five times that of a single dish with no change in the resultant FWHM. This mode thus provides a faster coverage of the search region than a single large dish, while providing an equivalent sensitivity. The 8- threshold for detecting a pulsed signal with a duty cycle of 10 percent for the configuration used is 0.5 mJy, comparable to the sensitivity of Parkes multibeam survey when scaled to our lower observing frequency assuming the mean spectral index for normal pulsars to be -1.6 (Kramer et al. 1998). This threshold was calculated using the radiometer equation assuming a system noise temperature of 91 K and a sky background temperature of 10 K. Given the known pulsar detections discussed in Section 4, we detect on average known pulsars at 50% of their expected S/N, probably due to contamination by RFI. Thus, our true sensitivity is likely to be closer to 1 mJy.
3 Analysis
The data were analyzed using the SIGPROC111http://sigproc.sourceforge.net pulsar data analysis software on computer clusters at Jodrell Bank, West Virginia University and the National Centre for Radio Astrophysics. The data were dedispersed using 145 trial DMs ranging from 0 to 2000 pc cm-3, the maximum DMs we expect in the searched region (Cordes & Lazio 2003). DMs were spaced more coarsely at higher frequencies, due to the greater dispersion smearing across each individual frequency channel.
We searched for periodicities using both a Fast Fourier Transform (FFT) and a Fast Folding Algorithm (FFA). We summed up to 32 harmonics in the FFT search and used a threshold S/N of 8. This same threshold was used in the FFA search, which searched for periodicities greater than 3 seconds using an algorithm described in Lorimer & Kramer (2005). Known interference periodicities as well as periodicities occurring in multiple beams were eliminated from our candidate lists. Pulsar candidates were identified by inspecting the profile over eight 2-MHz subbands and eight 4 min time subintegrations in a composite diagnostic plot. Confirmation observations with the GMRT were undertaken for any signals which showed the characteristics expected of a pulsar.
3.1 Candidate Localization
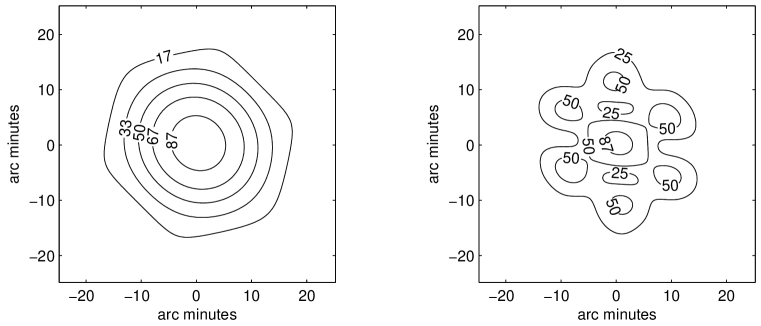
The wide beam for the configuration of the GMRT used in the survey results in a large uncertainty for the pulsar position. However, by using the GMRT as a phased array, where the phased voltages from individual antennas are added in the GMRT digital backends, we were able to obtain refined estimates of the pulsar positions. The FWHM for this configuration depends upon the separation between the different antennas. Simulations were carried out to estimate the synthesized beam of GMRT for different combinations of GMRT antennas. Fig. 2 shows the synthesized beams for two different configurations of GMRT antennas, with FWHM of about 20’ and 10’. Three such configurations were selected for localization allowing a refinement of position upto 3’.
| Parameter | J0026+6320 | J2208+5500 | J2217+5733 |
|---|---|---|---|
| Right Ascension (J2000) | 00:26:50.561(8) | 22:08:23.72(1) | 22:17:55.03(2) |
| Declination (J2000) | 63:20:00.87(5) | 55:00:08.41(5) | 57:33:04.0(2) |
| Galactic longitude (deg) | 120.2 | 100.9 | 103.5 |
| Galactic latitude (deg) | 0.6 | 0.6 | |
| Period (s) | 0.318357731235(1) | 0.933161074780(6) | 1.05684421944(4) |
| Period Derivative (10-15 s/s) | 0.15006(6) | 6.9878(6) | 0.651(2) |
| Epoch (MJD) | 54000.0 | 54315.0 | 54315.0 |
| Dispersion measure (pc cm-3) | 230.31 | 101.03 | 162.75 |
| Timing data span (MJD) | 5324954750 | 5386454769 | 5386654769 |
| Number of TOAs | 147 | 126 | 85 |
| Flux density S626 (mJy) | 1.9(2) | 1.4(2) | 2.2(4) |
| Flux density S1400(mJy) | 1.0(3) | 0.26(8) | 0.26(8) |
| Pulse width at half maximum W626 (ms) | 15(1) | 14(1) | 26(4) |
| Pulse width at half maximum W1400 (ms) | 8.1(8) | 8.6(6) | 13(2) |
| Spectral Index | |||
| DM distance (kpc) | 9.7 | 3.5 | 5.0 |
| L1400 (mJy kpc2) | 94.8 | 3.2 | 6.5 |
| Inferred surface dipole magnetic Field (1012 G) | 0.2 | 2.6 | 0.8 |
| Characteristic Age (Myr) | 33.6 | 4.2 | 51.5 |
| Name | P | DM | S610 | S/N expected | S/N detected | Distance | Comment | |||
|---|---|---|---|---|---|---|---|---|---|---|
| s | pc cm-3 | mJy | ||||||||
| B2027+37 | 76.9 | –0.7 | 1.216805 | 190.7 | 5.7 | 66 | 46 | 0.07 | ||
| B1916+14 | 49.1 | 0.9 | 1.181023 | 27.2 | 1.3 | 16 | * | 0.10 | RFI | |
| B1915+13 | 48.3 | 0.6 | 0.194631 | 94.5 | 15.0 | 112 | 266 | 0.19 | ||
| B2148+52 | 97.5 | –0.9 | 0.332206 | 148.9 | 7.8 | 57 | 11 | 0.19 | RFI | |
| B2319+60 | 112.1 | –0.6 | 2.256488 | 94.6 | 24.9 | 180 | 66 | 0.22 | RFI | |
| B1952+29 | 65.9 | 0.8 | 0.426677 | 7.9 | 7.0 | 60 | * | 0.23 | RFI | |
| B2334+61 | 114.3 | 0.2 | 0.495300 | 58.4 | 5.2 | 32 | 12 | 0.23 | RFI | |
| B1929+20 | 55.6 | 0.6 | 0.268217 | 211.2 | 9.9 | 35 | 59 | 0.27 | ||
| B2002+31 | 69.0 | 0.0 | 2.111265 | 234.8 | 7.2 | 74 | 120 | 0.29 | ||
| B1937+21 | 57.5 | –0.3 | 0.001558 | 71.0 | 82.3 | 293 | 122 | 0.30 | RFI | |
| J0215+6218 | 132.6 | 1.0 | 0.548879 | 84.0 | 10.6 | 33 | 9 | 0.37 | RFI | |
| J2302+6028 | 109.9 | 0.4 | 1.206404 | 156.7 | 6.1 | 18 | 9 | 0.40 | RFI | |
| B2000+32 | 69.3 | 0.9 | 0.696761 | 142.2 | 3.3 | 10 | 22 | 0.42 | ||
| B2255+58 | 108.8 | –0.6 | 0.368246 | 151.1 | 21.9 | 63 | 74 | 0.43 | ||
| B1919+14 | 49.1 | 0.0 | 0.618183 | 91.6 | 1.9 | 3 | 12 | 0.44 | ||
| B2324+60 | 112.9 | 0.0 | 0.233652 | 122.6 | 10.8 | 22 | 17 | 0.45 | ||
| B1953+29 | 65.8 | 0.4 | 0.006133 | 104.6 | 6.2 | 5 | * | 0.46 | ||
| B1914+13 | 47.6 | 0.4 | 0.281842 | 237.0 | 5.5 | 15 | 13 | 0.46 | ||
| B1924+16 | 51.9 | 0.1 | 0.579823 | 176.9 | 4.3 | 5 | * | 0.56 | Edge of beam | |
| B0154+61 | 130.6 | 0.3 | 2.351745 | 30.2 | 4.3 | 8 | * | 0.52 | Edge of beam and RFI | |
| B1911+11 | 45.6 | 0.2 | 0.600997 | 100.0 | 2.1 | 1 | * | 0.61 | Edge of beam | |
| B2351+61 | 116.2 | –0.2 | 0.944784 | 94.7 | 11.3 | 16 | 10 | 0.66 | RFI |
Each new pulsar was localized by carrying out five pointings using the phased array, one at the assumed pulsar position and the other four offset from it by half of FWHM in the north, south, east and west directions. The pulsar was usually detected in at least two of the grid pointings. The position of the grid pointing was weighted by the measured S/N of detection to arrive at a more refined position. The localization accuracy was improved by a grid using first the survey setup with FWHM of 40’ and subsequent grids with each of the three selected phased array configurations, with FWHMs of 20’, 10’ and 5’. The position of the pulsar was refined after every iteration. An experiment with known pulsars of varying flux densities was carried out to test this procedure. It was observed that this procedure yielded the final positions with up to 3’ accuracy in about 7 hours of observations for a weak pulsar (Flux density at 626 MHz of about 2 mJy). The required observing time for this procedure is less for a pulsar with higher flux density.
PSR J0026+6320 is very close to the beam centre in the discovery observations, so its position was refined using a grid pointing procedure similar to that described above using the Lovell telescope at Jodrell Bank Observatory at a higher observing frequency of 1.4 GHz. The new localization procedure described here was very useful for the other two pulsars, particularly for PSR J2217+5733, as these pulsars were discovered at the edge of the beam.
3.2 Timing observations and analysis
Once a position accurate to approximately 3’ was obtained using the procedure outlined above, the new pulsar was observed using 76-m Lovell telescope at Jodrell Bank Observatory on multiple epochs to obtain a timing solution. The Lovell telescope is equipped with a dual channel cryogenic receiver with a receiver temperature of about 35 K at 1400 MHz. This receiver is sensitive to two hands of circular polarizations. The radio frequency signals are down-converted to an intermediate frequency at the focus of the telescope and brought to the receiver room, where these are further down-converted before being fed to the pulsar hardware. The pulsars were observed with a 32-channel dual hardware filterbank across a 32 MHz bandpass centered around 1400 MHz. The total intensity data were then dedispersed in a hardware dedispersion unit and folded synchronously at the nominal topocentric period of the pulsar for subintegrations of between 1 to 2 minutes. The folded data for typically 6 to 10 subintegrations were written to disk for every epoch and observations were usually made at approximately regular intervals of between 10 to 15 days. A time stamp derived from a hydrogen maser clock was recorded with each folded profile. The time-span covered by these observations as well as the total number of times of arrival used are indicated for each pulsar in Table 1.
Total intensity profiles were obtained by adding the subintegrations. These were then cross-correlated with a standard template to give pulse topocentric times of arrival which were then corrected to the Solar system barycenter using JPL ephemeris DE200 (Standish 1982). Assessment of arrival time residuals, which are the differences between actual pulse arrival times and times calculated from a simple model involving an assumed position of the source and its rotation, provides measurements of pulsar parameters. Specifically, we fit for pulse phase, right ascension, declination, rotational frequency and its first time derivative. The measured values of these parameters from the timing analysis are given in Table 1.
4 Results
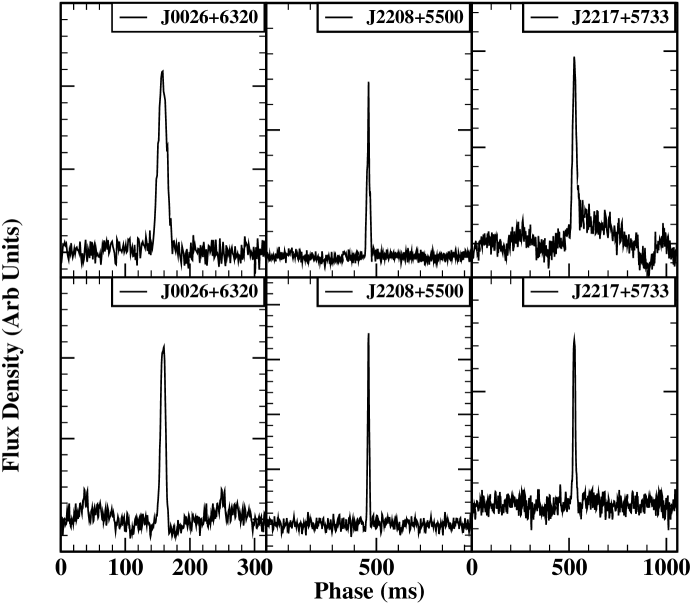
Three new pulsars have been discovered in the data analyzed so far (see Fig. 1). Their average profiles at 626 MHz, obtained using the GMRT, and those at 1400 MHz with the Lovell telescope are presented in Fig. 3. Measured and derived parameters for the three new pulsars are presented in Table 1. The flux densities at 626 MHz were estimated by scaling the data by the expected system noise, while those at 1400 MHz were calibrated against a noise source.
There is no obvious association of the newly discovered pulsars with either globular clusters or supernova remnants. Likewise, these pulsars are also not associated with any known high-energy source. The radio luminosities, magnetic fields and characteristic ages of these pulsars are similar to the normal pulsar population.
We detected 16 out of 22 known pulsars that were in our surveyed area (see Table 2). To evaluate the sensitivity of our survey in terms of these detections, the expected S/N for each pulsar was calculated using the following procedure. The flux density of the known pulsars at 610 MHz was estimated using the flux density at 400 and 1400 MHz and/or the spectral index quoted in the ATNF pulsar catalog (Manchester et al. 2005). For PSR J0215+6218, the flux density at 610 MHz was taken from Lorimer et al. (1998). This estimate was then corrected for the position of the pulsar in the search beam assuming a Gaussian beam with FWHM of 0.67∘. The noise was estimated using the radiometer equation (Lorimer and Kramer 2005) assuming 25 GMRT antennas in an incoherent array. The system temperature took into account the sky brightness temperature for each field, obtained from an all-sky map at 610 MHz computed using Global Sky Model (de Oliveira-Costa et al. 2008). Pulse width at ten percent as quoted in the ATNF catalog was used wherever available. Otherwise, the duty cycle was assumed to be 10 percent.

A comparison of the expected S/N with the detected S/N indicates that we detect on average 8 pulsars at 50% of their expected S/N and 5 pulsars with a S/N greater than expected. Three pulsars were detected with expected S/N, while three non-detections were consistent with these pulsars being weaker than our expected sensitivity. Modeling the effects of inter-stellar scintillations and/or errors in the quoted spectral index of low frequency flux densities for the 8 pulsars, detected with lower S/N, still leaves a significant discrepancy between the expected and detected S/Ns. There does not seem to be a correlation between DM, period or Galactic latitude and S/N loss, suggesting that propagation effects are not to blame. We therefore attribute the loss to RFI, which was considerable in the latter part of the survey. All our detections except PSR B1919+14 had a beam position corrected flux density of about 1 mJy, which we adopt as the sensitivity of the survey.
Taking account of this empirical sensitivity limit, we used the pulsar population model from Lorimer et al. (2006) to predict the likely yield for our survey. Using the Monte Carlo techniques and the parameters for model C’ described in that paper, we find that our survey should have detected about 20 pulsars, in excellent agreement with our total of 16 redetection and 3 new discoveries found in practice. No new millisecond pulsars were detected in this survey. To model the expected millisecond pulsar detections, we use the population models developed by Smits et al. (2009), and find the number of millisecond pulsar detections is expected to be of order unity, i.e. consistent with our lack of new detections.
The above population estimates do not predict the number of rotating radio transients that may be present in the survey data. We are working on RFI excision algorithms that will allow us to probe this area of the neutron star population using single-pulse searches. The results of this study will be presented elsewhere.
Follow up observations of PSR J2208+5500 with 13 antennas of GMRT in a phased array mode (145-m equivalent single dish) at 626 MHz indicate a nulling behaviour similar to other nulling pulsars. The phased array data were dedispersed to the nominal DM of the pulsar and were folded every 16 periods, with 128 bins across the pulse. As an example, the pulse energy modulation in 16 period subintegrations, for a duration of 180 s out of a 4000 s observations, is shown in Fig. 4 alongwith the average profile of the pulsar. In this plot, the lack of any significant emission is evident at subintegration 99. This was investigated further by using the following procedure. First, a baseline, estimated using bins 9 to 69 away from the pulse, was subtracted from the data for each subintegration. Then, two sequences were formed by averaging the energy in bins 109 to 114 (OFF-pulse energy) and 87 to 92 (ON-pulse energy). The two sequences were then compensated for interstellar scintillation by the mean ON-energy for a block of 300 periods. The procedure is similar to that used for detecting pulse nulling in single pulse sequences (Ritchings 1976; Vivekanand 1995).
A visual examination of the two sequences for the entire 4000 s of data shows sudden drop of pulse energy for 13 subintegrations (e.g. similar to subintegration 99) similar to pulse nulling. The average profile for these nulled subintegrations shows no detectable emission. The average energy in the pulsed emission during burst subintegrations (i.e. subintegrations with detectable emission in the ON-pulse window) is about 18 times higher than that during the nulled subintegrations.
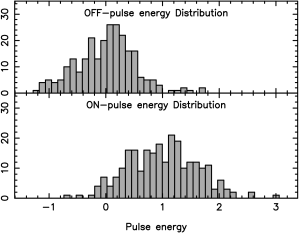
The energy in the scaled sequences were also binned to 40 bins to form ON-pulse and OFF-pulse energy distributions shown in Fig. 5. The ON-pulse histogram in Fig. 5 shows an excess at zero energies indicating fraction of nulled 16 period subintegrations. This fraction, called the nulling fraction, can be estimated by removing a scaled version of OFF-pulse histogram at zero energy from the ON-pulse histogram. The procedure used above is not sensitive to nulls shorter than 16 periods. Thus, a lower limit of 7.5 percent nulling fraction is estimated from the distribution presented in Fig. 5. An examination of pulse sequences averaged over fewer numbers of periods confirms the nulls mentioned above, but indicates more frequent shorter nulls. However, the signal to noise ratio for shorter subintegration is not sufficient to estimate the nulling fraction more accurately. Higher sensitivity observations at lower frequencies will be useful to characterize nulling in this pulsar in the future.
The nulling behaviour for PSR J2208+5500 is similar to other nulling pulsars, such as PSRs B0809+74 or B0834+06. Both these pulsars have small nulling fractions and periods similar to PSR J2208+5500. The pulsed emission of PSR J2208+5500 seem to occur in long bursts interspersed with short 1 to 16 period nulls similar to PSR B0834+06 (Ritchings 1976). In particular, the distributions in Fig. 5, apart from an overlap between ON-pulse and OFF-pulse distributions, are very similar in shape to those for PSRs B0809+74 and B0834+06. The factor by which the radio emission decreases during null () is much less than that reported for pulsars such as PSR B0031-07, B0809+74 and B1944+17 (Lyne & Ashworth 1983; Deich et al. 1986; Vivekanand & Joshi 1997), but is still significant. Higher sensitivity observations at a lower frequency are required to characterize pulse-nulling in terms of these parameters.
Acknowledgments
The Giant Meterwave Radio Telescope is operated by National Centre for Radio Astrophysics, which is funded by Tata Institute of Fundamental Research and Department of Atomic Energy. BCJ acknowledges the use of 72-node cluster on the NCRA East Campus, funded by Department of Atomic Energy. MAM is an Alfred P. Sloan research fellow. MAM and DRL acknowledge support from West Virginia EPSCoR in the form of a Research Challenge Grant.
References
- Cordes & Lazio (2003) Cordes J. M., Lazio T. J. W., 2003, preprint(astro-ph/0207156)
- Deich et al. (1986) Deich et al., 1986, ApJ, 300, 540
- Hulse & Taylor (1975) Hulse R. A., Taylor J. H., 1975, ApJ, 201, L55
- Large & Vaughan (1971) Large M. I, Vaughan A. E., 1971, MNRAS, 151, 277
- Lyne & Ashworth (1983) Lyne A. G., Ashworth M., 1983, MNRAS, 204, 519
- Kramer et al. (1998) Kramer M. et al. 1998, ApJ, 501, 270
- Lorimer et al. (1998) Lorimer D. R., Lyne A. G., Camilo F., 1998, A&A, 331, 1002
- Lorimer & Kramer (2005) Lorimer D. R., Kramer M., 2005, Handbook of pulsar Astronomy, Cambridge Univ. Press, Cambridge, UK
- Lorimer et al. (2006) Lorimer D. R. et al., 2006, MNRAS, 372, 777
- Manchester et al. (1978) Manchester R. N. et al., 1978, MNRAS, 185, 409
- Manchester et al. (1996) Manchester R. N. et al., 1996, MNRAS, 279, 1235
- Manchester et al. (2001) Manchester R. N. et al., 2001, MNRAS, 328, 17
- Manchester et al. (2001) Manchester R. N. et al., 2005, AJ, 129, 1993
- McLaughlin et al. (2006) McLaughlin M. A. et al., 2006, Nature, 439, 817
- Oliveira-Costa et al. (2008) de Oliveira-Costa A. et al., 2008, MNRAS, 388, 247
- Ritchings (1976) Ritchings R. T., 1976, MNRAS, 176, 249
- Smits et al. (2009) Smits et al., 2009, A&A, 493, 1161
- Standish (1982) Standish E. M., 1982, A&A, 114, 297
- Stokes et al. (1986) Stokes G. H. et al., 1986, ApJ, 311, 694
- Vivekanand (1995) Vivekanand M., 1995, MNRAS, 274, 785
- Vivekanand & Joshi (1997) Vivekanand M., Joshi B. C., 1997, ApJ, 477, 431