e-mail pgegenw@gwdg.de, Phone: +49-551-397607, Fax: +49-551-3919546
XXXX
Ferromagnetic quantum phase transition in Sr1-xCaxRuO3 thin films
Abstract
\abstcolThe ferromagnetic quantum phase transition in the perovskite ruthenate Sr1-xCaxRuO3 is studied by low-temperature magnetization and electrical resistivity measurements on thin films. The films were grown epitaxially on SrTiO3 substrates using metalorganic aerosol deposition and characterized by X-ray diffraction and room temperature scanning tunneling microscopy. High residual resistivity ratios of 29 and 16 for and , respectively, prove the high quality of the investigated samples. We observe a continuous suppression of the ferromagnetic Curie temperature from K at towards at . The analysis of the electrical resistivity between 2 and 10 K reveals and behavior at and , respectively. For undoped CaRuO3, the measurement has been extended down to 60 mK, revealing a crossover to behavior around 2 K, which suggests a Fermi-liquid ground state in this system.
pacs:
71.10.Hf, 73.61.At, 71.20.BeIntroduction
Quantum phase transitions (QPTs) in weak itinerant ferromagnets have recently attracted much interest due to the discovery of exciting low-temperature states such as unconventional superconductivity [1], partial magnetic order [2] or non-Fermi liquid (NFL) phases [3]. The system Sr1-xCaxRuO3 represents a rare example of an oxide NFL metal that displays an itinerant electron ferromagnetic (FM) QPT [4, 5, 6]. Although the general trend of a continuous suppression of ferromagnetism with increasing Ca concentration is well established, details close to the QPT differ substantially in previous reports. Early studies on sintered polycrystals have suggested a FM quantum critical point at [5]. Subsequent Muon-spin rotation measurements on the same crystals have proven that the magnetically ordered volume fraction at low- decreases from 100% upon increasing Ca content well before [7], indicating magnetic phase separation. Most interestingly, similar behavior has also been found near the pressure-driven first-order QPT in MnSi [7]. On the other hand, magnetization measurements on flux grown single crystals have shown FM order beyond with a smooth crossover to spin-glass-like behavior at larger , extending towards [4]. Electrical resistivity measurements on thin films, prepared by pulsed-laser deposition have revealed an anomalous temperature dependence in a wide concentration range at temperatures between 2 and 10 K, which resembles the NFL phase observed in MnSi under hydrostatic pressure. However, these thin films have a poor residual resistivity ratio, even for the undoped systems SrRuO3 and CaRuO3 and the experiments should be extended towards lower temperatures. In this paper, we report magnetization and electrical resistivity measurements on epitaxial Sr1-xCaxRuO3 thin films that have been grown using metal-organic aerosol deposition (MAD) [8].
Experimental
Thin films of Sr1-xCaxRuO3, where grown by MAD on MgO and SrTiO3 substrates [8]. In the former case, the larger lattice mismatch leads to a polycrystalline growth of islands, resulting in a substantial film roughness. By contrast, in the latter case epitaxial growth was obtained with very small values of the roughness detected by room temperature scanning tunneling microscopy. In this paper, we focus only on films grown on SrTiO3 with in-plane dimensions of mm. Details of their preparation and structural characterization by X-ray diffraction and room-temperature scanning tunneling microscopy are reported in [8]. The thickness of each film has been determined by small-angle X-ray scattering and varies between 40 and 50 nm. Magnetization and electrical resistivity measurements at temperatures between 2 and 300 K where preformed using Quantum Design MPMS and PPMS systems, respectively. The electrical resistivity between 60 mK and 10 K has been determined in an adiabatic demagnetization cryostat on a microstructured film. Electrical contacts were made using silver paste.
Magnetization
To determine the magnetization of the Sr1-xCaxRuO3 thin
films, the background contribution of the SrTiO3 substrate must
be subtracted. A measurement on a plain substrate has revealed a
diamagnetic magnetization with an additional Curie-Weiss
contribution at low temperatures resulting from a small amount of
magnetic impurities. While the substrate contribution to the total
magnetization is small for FM samples below their Curie temperature,
it dominates in the paramagnetic regime in particular for at low temperatures. Since our analysis assumes similar
substrate contributions for all samples, which, however, may be
incorrect for substrates with differing amount of magnetic
impurities, a substantial error arises at low temperatures and large
Ca concentrations. Thus, the exact position of the QPT cannot be
determined from these experiments. As estimate for , we have
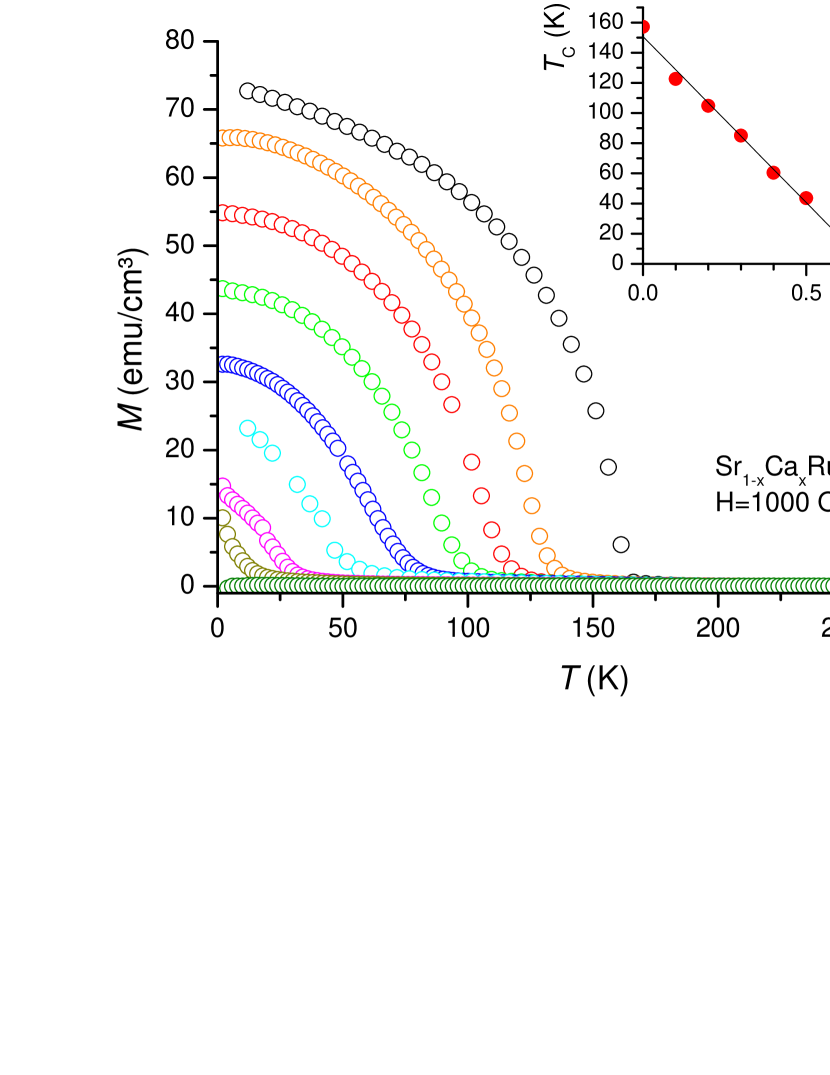
analyzed the positions of the inflection points of measured at Oe.
As displayed in Fig. 1, the so-derived data indicate a clear
and systematic evolution from a FM in ground state at towards
a paramagnetic ground state at , in good agreement with
[6, 7]. For a closer analysis of the magnetic
properties close to the FM QPT it would be required to measure for
each film the substrate contribution before the synthesis and
to explore the exact positions of by Arrott-plot analysis.
Electrical resistivity
| Sample | (K-n) | RRR | ||
|---|---|---|---|---|
| T449 | 0 | () | 28.9 | |
| T648 | 0.1 | () | 4.2 | |
| T643 | 0.2 | () | 3.7 | |
| T642 | 0.3 | () | 3.6 | |
| T644 | 0.4 | () | 3.6 | |
| T414 | 0.5 | () | 2.9 | |
| T499 | 0.6 | () | 3.3 | |
| T498 | 0.7 | () | 3.2 | |
| T496 | 0.8 | () | 4.2 | |
| T495 | 0.9 | () | 6.1 | |
| T440 | 1.0 | () | 15.7 |
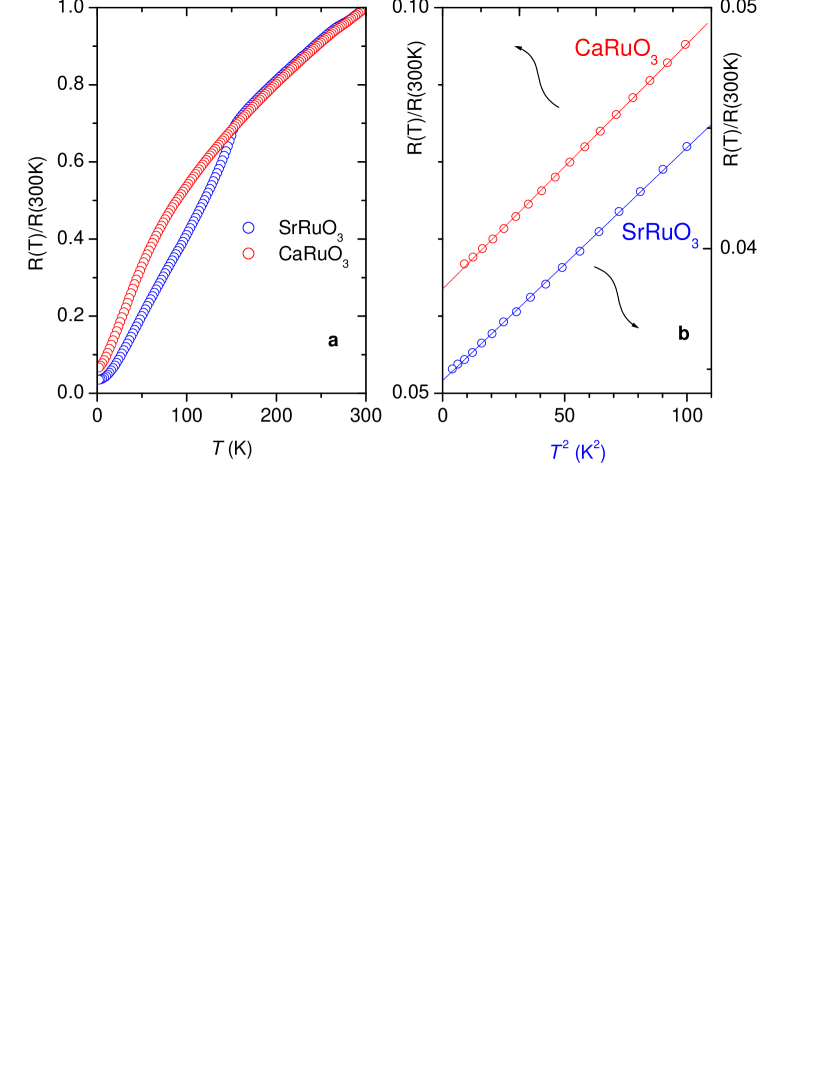
We now turn to the temperature dependence of the electrical resistivity of the Sr1-xCaxRuO3 thin films. Fig. 2a displays normalized data at temperatures between 2 and 300 K for and . Similar measurements have been performed for all concentrations listed in Table 1. At low Ca concentrations, , sharp decreases in are observed upon cooling through the respective Curie temperatures. For larger , the signature becomes very weak and disappears. The residual resistivity ratios of 29 and 16 for and , respectively, are much better compared to those reported in [6, 9] and indicate the good quality of the films. The lowest RRR value, is found for (cf. Table 1), as expected from the maximum disorder due to the random Sr- and Ca substitution. The low- data between 2 and 10 K have been fitted by a power-law temperature dependence, whose parameters are given in Table 1. Whereas a dependence, as expected for Fermi liquids, is found at , clear deviation is observed at larger Ca content. As shown in Fig. 2b for , the resistivity between 2 and 10 K could be described by a dependence, similar as found previously for thin films [6, 9] as well as single crystals in the same temperature range [4, 10]. The extension of the data towards lower is discussed later.

Fig. 3 summarizes the concentration dependence of the fit parameters given in Table 1. Since it is difficult to compare values of the coefficient obtained for varying exponents , we also show the difference of the resistance between 2 and 10 K, normalized to the room temperature resistance. This latter property could be taken as a measure for the low- scattering due to magnetic fluctuations in this system. A clear increase is found with increasing Ca-concentration suggesting enhanced magnetic fluctuations near the disappearance of long-range FM order. This is also compatible with an enhanced specific heat coefficient ( mJ/(K2mol-Ru) in CaRuO3 [10]).
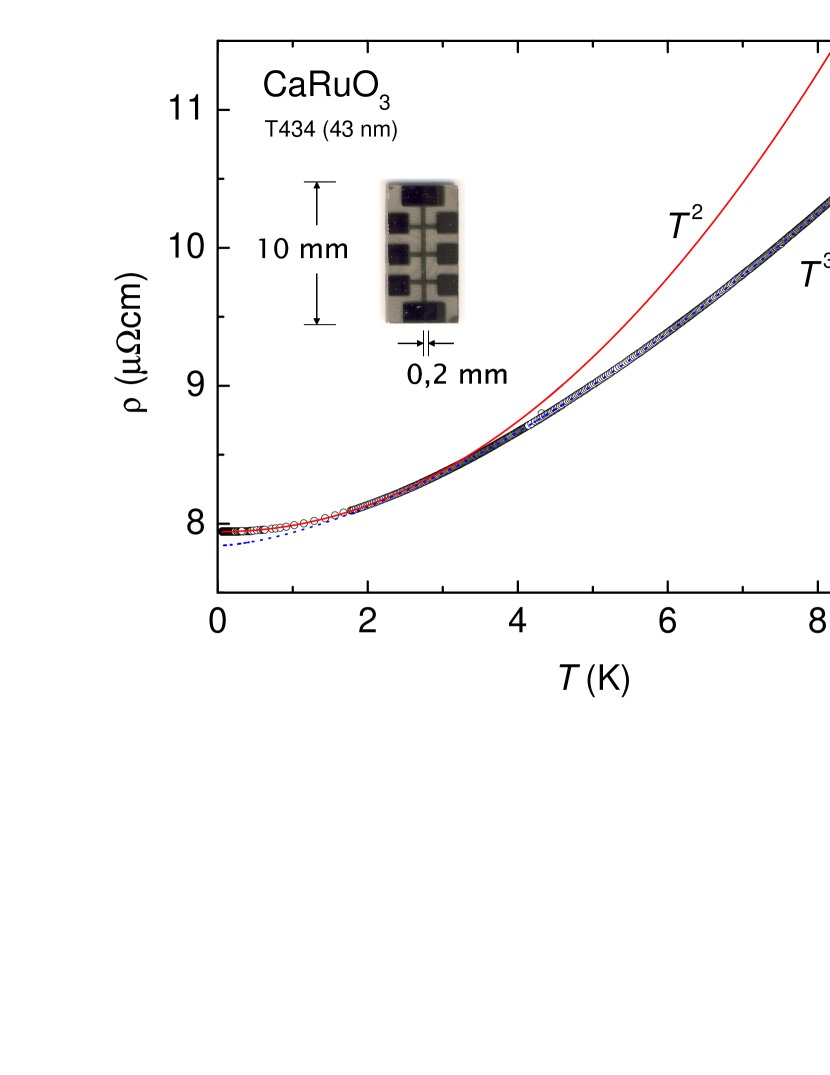
In order to study a possible NFL ground state in CaRuO3, the resistivity measurement has been extended down to 60 mK using a microstructured film shown in Fig. 4. Remarkably, we observe a crossover from to behavior below 2 K. This is in accordance with recent specific heat measurements on a high-quality single crystal, which show a constant specific heat coefficient at low temperatures [10]. Similar low- measurements on thin films with are underway to determine the exact region in the phase diagram where the resistivity displays NFL behavior.
Conclusion
The FM QPT in Sr1-xCaxRuO3 thin films has been studied using magnetization and electrical resistivity measurements. A clear and systematic evolution from K at towards at is observed. The analysis of the temperature dependence of the electrical resistivity between 2 and 10 K suggests a broad concentration range in which non-Fermi liquid like behavior () is observed. However, the extension of the data for undoped CaRuO3 down to 60 mK has revealed a crossover to Fermi liquid behavior at K.
We thank C. Stingl and K. Winzer for their help with the low- electrical resistivity measurement. Work supported by DFG through SFB 602.
References
- [1] S. S. Saxena et al., Nature 406, 587 (2000).
- [2] C. Pfleiderer et al., Nature 427, 227 (2004).
- [3] N. Doiron-Leyraud et al., Nature 425, 595 (2003).
- [4] G. Cao, S. McCall, M. Shepard, J.E. Crow, R.P. Guertin, Phys. Rev. B 56, 321 (1997).
- [5] K. Yoshimura et al., Phys. Rev. Lett. 83 4397 (1999).
- [6] P. Khalifah, I. Ohkubo, H.M. Christen, D.G. Mandrus, Phys. Rev. B 70, 134426 (2004).
- [7] Y.J. Uemura et al., Nature Phys. 3, 29 (2007).
- [8] M. Schneider, V. Moshnyaga, P. Gegenwart, arXiv:0905.4896 (2009).
- [9] L. Klein, L. Antognazza, T.H. Geballe, M.R. Beasley, A. Kapitulnik, Phys. Rev. B 60, 1448 (1999).
- [10] N. Kikugawa, L. Balicas, A.P. Mackenzie, J. Phys. Soc. Jpn. 78, 014701 (2009).