A very rare triple-peaked type-I X-ray burst in the low-mass X-ray binary 4U 1636–53
Abstract
We have discovered a triple-peaked X-ray burst from the low-mass X-ray binary (LMXB) 4U 1636–53 with the Rossi X-ray Timing Explorer (RXTE). This is the first triple-peaked burst reported from any LMXB using RXTE, and it is only the second burst of this kind observed from any source. (The previous one was also from 4U 1636–53, and was observed with EXOSAT.) From fits to time-resolved spectra, we find that this is not a radius-expansion burst, and that the same triple-peaked pattern seen in the X-ray light curve is also present in the bolometric light curve of the burst. Similar to what was previously observed in double-peaked bursts from this source, the radius of the emitting area increases steadily during the burst, with short periods in between during which the radius remains more or less constant. The temperature first increases steeply, and then decreases across the burst also showing three peaks. The first and last peak in the temperature profile occur, respectively, significantly before and significantly after the first and last peaks in the X-ray and bolometric light curves. We found no significant oscillations during this burst. This triple-peaked burst, as well as the one observed with EXOSAT and the double-peak bursts in this source, all took place when 4U 1636–53 occupied a relatively narrow region in the colour-colour diagram, corresponding to a relatively high (inferred) mass-accretion rate. No model presently available is able to explain the multiple-peaked bursts.
keywords:
stars: neutron — X-rays: binaries — X-rays: bursts — stars: individual: 4U 1636–53Accepted. Received; in original form
1 Introduction
Thermonuclear, type-I, X-ray bursts (also known as X-ray bursts, or simply bursts), are due to unstable burning of H and He on the surface of accreting neutron stars in low-mass X-ray binaries (LMXBs). During these bursts, the X-ray flux increases by factors of 10-100 within a second or less, after which it returns back to its pre-burst level over a time-span of tens of seconds, following an approximately exponential decay (e.g., Lewin et al., 1993; Strohmayer & Bildsten, 2003; Galloway et al., 2008).
One of the best studied sources of X-ray bursts is the LMXB 4U 1636–53. Also known as V801 Ara, 4U 1636–53 was discovered with OSO-8 (Swank et al., 1976), and was subsequently studied in great detail using observations with SAS-3, Hakucho, Tenma, and EXOSAT (see Lewin et al., 1987, for a review). The orbital period of this binary system is 3.8 hr (van Paradijs et al., 1990), and the spin period of the neutron star is 581 Hz (Strohmayer et al., 1998a, b). Using EXOSAT, Damen et al. (1989) detected 60 bursts from this source between 1983 and 1986; from observations with the Rossi X-ray Timing Explorer (RXTE), 172 bursts were detected up to 2007 June 3 (Galloway et al., 2008), and more than 250 bursts including data taken after that date (Zhang et al., in prep.). Most of these X-ray bursts have standard, single-peaked, fast rising and exponentially decaying light curves. Three superbursts have also been detected in this source (Wijnands, 2001; Kuulkers et al., 2004). Linares et al. (2009) detected a 5.4 minutes recurrence time between two X-ray bursts in 4U 1636–53, which is the shortest observed recurrence time in any neutron star low-mass X- ray binary.
However, there have also been several detections of bursts from 4U 163653 that have double-peaked light curves, both with EXOSAT (Sztajno et al., 1985) and RXTE (Bhattacharyya & Strohmayer, 2006b; Galloway et al., 2008). Only one triple-peaked X-ray burst has ever been detected from this source by van Paradijs et al. (1986) using EXOSAT observations. Several models have been proposed to explain the double-peaked bursts. For instance, Bhattacharyya & Strohmayer (2006b) suggested that these bursts are due to stalling of the nuclear-burning front near the equator of the neutron star following ignition near the neutron-star pole, whereas Fisker et al. (2004) suggested that these bursts are caused by a waiting point in the thermonuclear reaction chain.
In this paper, we report the first detection of a triple-peaked X-ray burst in 4U 163653 with RXTE, and only the second ever detected from this source. The paper is organized as follows: We describe the observations and data analysis in §2, we show the results in §3, and finally we discuss our findings in §4.
2 OBSERVATIONS AND DATA ANALYSIS
We analysed all data available from the RXTE Proportional Counter Array (PCA) of 4U 1636–53 as of March 15 2009. The PCA consists of an array of five collimated proportional counter units (PCUs) operating in the 260 keV range, with a total effective area of approximately 6500 cm2 and a field of view of FWHM (Jahoda et al., 1996). For each observation we calculated X-ray colours from the Standard2 data (16-s time-resolution and 129 energy channels in the keV band), and produced 1-s light curves from the Standard1 data (0.125-s time resolution with no energy resolution). To calculate the colours of the source, we first examined the 1-s Standard1 light curves to identify and remove any X-ray burst from the data, and we subsequently computed light curves in four energy bands every 16 s from the Standard2 data, separately for each PCU detector that was active during an observation. We subtracted the background contribution from each light curve, and we corrected the count rates for dead time. We defined the soft colour as the count rate in the 3.56.0 keV band divided by the count rate in the 2.03.5 keV band, and the hard colour as the count rate in the 9.716.0 keV band divided by the count rate in the 6.09.7 keV band. We used data of the Crab pulsar and nebula taken close to each observation of 4U 1636–53 to correct for instrumental effects (e.g. Altamirano et al., 2008). All colours of 4U 1636–53 presented in this paper are therefore normalised to the colours of Crab. Whenever we found an X-ray burst, we used 80 s of persistent emission just before the burst to represent the colours of the source at the time the burst started.
In this paper we concentrate on an unusual X-ray burst that took place at 18:23:25 UTC on December 11 2006 (MJD 54080.76626; ObsID 92023-01-44-10). To calculate the bolometric flux of the persistent emission before the burst, , we extracted energy spectra of s before the onset of the burst from the two main instruments on board RXTE, the PCA and the High Energy X-ray Timing Experiment (HEXTE). HEXTE consists of two clusters of four NaI/CsI phoswich scintillation detectors that are sensitive to X-rays in the keV range (Gruber et al., 1996). Cluster A of HEXTE stopped working properly in October 2006, an therefore only cluster B was available for our analysis. For the PCA spectrum we analysed the Standard2 data of PCU 2, while for the HEXTE spectrum we analysed the Standard data of cluster-B. We extracted PCA and HEXTE backgrounds, and produced response matrices for both instruments following the instructions in the RXTE pages. We added a % systematic error to the PCU-2 spectrum, but no systematic error was applied to the HEXTE spectrum.
To study this burst in detail, we analysed the PCA Event data, E_125us_64M_0_1s, in which each individual photon is time tagged at a s time resolution in 64 energy channels between keV. We used all PCUs that were operating at the time of the X-ray burst (PCUs 0,1,2 and 4) to produce 0.25-s resolution light curves in the full PCA band and in two other bands, keV and keV. For the time-resolved spectral analysis of this burst we extracted spectra in 64 channels every 0.25 s from the Event data of all available PCUs. Since the light curve of the decay of the burst is quite smooth, we extracted spectra over somewhat longer intervals in the tail of the burst to compensate for the lower count rates. We used a time resolution of 0.5 s, 1 s and 2 s, respectively, for each of the following time intervals: s, s, and s after the start of the burst. We generated an instrument response matrix, and we fitted the spectra using XSPEC version 12.4.0. Because of the short exposure, in this case the statistical errors dominate, and therefore we did not add any systematic error to the spectra. We restricted the spectral fits to the energy range keV. During the s previous to the onset of the burst, the light curve and colours of 4U 1636–53 were consistent with being constant, therefore we extracted a spectrum of those data to use as background in our fits; this approach is well established as a standard procedure in X-ray burst analysis (e.g. Kuulkers et al., 2002). We note that this procedure fails if the blackbody emission during the burst comes from the same source that produces the blackbody emission seen in the persistent emission, since the difference between two blackbody spectra is not a blackbody (van Paradijs & Lewin, 1986). This effect is significant only when the net burst emission is small, and therefore the problems may arise only at the start and tail of the burst, when the burst emission is comparable to the persistent emission (see the discussion in Kuulkers et al., 2002). We corrected each spectrum for dead time using the methods supplied by the RXTE team.
We computed Fourier power density spectra for the duration of the burst using the event data over the full PCA band pass. We calculated the power spectra from 1-s data segments, setting the start time of each segment to 0.125 s after the start time of the previous segment. Note that because of this, the individual power spectra are not independent.
3 RESULTS
In the top panel of Figure 1 we show the light curve of the burst at a resolution of 0.25 s. The light curve displays three peaks, similar to what was observed during the triple-peaked burst reported by van Paradijs et al. (1986) from EXOSAT data of this source, and we therefore call this a triple-peaked burst. Out of the three peaks in the burst, the first peak is the brightest in the full PCA band ( counts s-1 PCU-1) and the second is the weakest ( counts s-1 PCU-1). The separation in time between the first and third peak in the triple-peaked burst reported here is s, whereas in the triple-peaked burst in van Paradijs et al. (1986) it twice as long, s. In the bottom panel of Figure 1 we show the hardness curve during the burst. The hardness is defined as the count-rate ratio in the keV and keV energy bands.
Besides the main three peaks, both curves show structure on shorter time scales, which makes it difficult to accurately identify the times of the maxima of each peak. It is nevertheless apparent from this Figure that the first peak in the light curve occurs significantly later than the first peak in the hardness curve. Since the hardness is a measure of the temperature of the emitting surface (see below), this means that the emitting surface reaches the maximum temperature before the burst is the brightest. The first peak in the light curve occurs about 2.5 s after the first peak in the hardness curve. A similar delay between light curve and hardness curve has been observed in photospheric radius-expansion bursts (Strohmayer et al., 1998b), and is indicative of the start of the radius-expansion phase but, as we discuss below, this triple-peaked burst is not a radius expansion burst. After this initial mismatch between light and hardness curves, the other two maxima and the two minima of the light curve appear to coincide with the corresponding maxima and minima in the hardness curve.

3.1 Pre-burst spectrum
We fitted the PCA (in the keV range) and HEXTE-B (in the keV range) pre-burst spectra simultaneously with a model consisting of a combination of a blackbody, a power law, and a Gaussian emission line fixed at 6.4 keV, all affected by interstellar absorption. We included a multiplicative factor in the model to account for possible systematic differences in the relative calibration of the effective areas of the two instruments. We found a good fit to the spectra, for degrees of freedom (dof), using a model consisting of a blackbody with temperature keV and bolometric flux erg cm-2 s-1, a power law with photon index and normalization photons cm-2 s-1 keV-1 at 1 keV, and a Gaussian line with keV and normalization photon cm-2 s-1. We also included the effect of interstellar absorption using the cross-sections of Balucinska-Church & McCammon (1992) and solar abundances from Anders & Grevesse (1989), with a hydrogen equivalent column density fixed at cm-2 (Pandel et al., 2008). These parameters are comparable to those reported by Cackett et al. (2009) for this source in the soft state. Following Galloway et al. (2008), we used the unabsorbed keV flux, erg cm-2 s-1, and a bolometric correction , to estimate the bolometric flux before the burst, erg cm-2 s-1. We note that the error of can be as large as 40 % (Galloway et al., 2008). Using the Eddington luminosity for a 1.4- neutron star with a 10-km radius, for a range of hydrogen mass fraction .
3.2 Time-resolved spectra during the burst
We fitted the time-resolved net burst spectra with a single-temperature blackbody model (bbodyrad in XSPEC), as generally burst spectra are well fit by a blackbody. During the fitting, we kept the hydrogen column density fixed at cm-2 (Pandel et al., 2008), and to calculate the radius of the emitting area in km, we assumed a distance of 5.9 kpc (Fiocchi et al., 2006). The model provides the blackbody colour temperature () and a normalization proportional to the square of the blackbody radius () of the burst emission surface, and allows us to estimate the bolometric flux as a function of time.
It is well known (London et al., 1986; Titarchuk, 1994; Madej et al., 2004) that the colour temperature obtained from fitting the continuum spectra of an X-ray burst is higher than the effective temperature that enters in the calculation of the bolometric flux. In order to get the effective temperature , we assumed a neutron star with a mass of and a radius of 10 km. Interpolating the ratio of / from the table of Madej et al. (2004), and using the bolometric flux from the fit, we calculated the “corrected” blackbody radius (see also van Paradijs et al., 1986). We found correction factors between 1.3 and 1.5.

In Figure 2 we show the time evolution of the best-fitting spectral parameters: Effective temperature, ,“corrected” blackbody radius, , and bolometric flux, . For reference we also plot the keV light curve in this Figure. X-ray light curves with multiple peaks are often a signature of radius expansion bursts, since during the radius expansion phase the temperature of the emitting surface decreases, and part of the radiation falls outside the X-ray band (e.g., Lewin et al., 1993). In those bursts, however, the bolometric light curve shows a single peak. In this burst, the bolometric light curve also shows three peaks, at the same positions as the peaks in the X-ray light curve. This shows that the multiple peaks in the X-ray light curve are not due to photospheric radius expansion during the burst, which is consistent with the fact that the flux at the peak of this burst is about a factor smaller than in real radius expansion bursts in this source (Maurer & Watts, 2008). The total burst fluence was erg cm-2. From this, and the peak of the bolometric flux, the characteristic time scale of the burst was s. Most of the fits are good, although there are a few cases with relatively large reduced values. (Only in six occasions the reduced is larger than 2.) We note that we did not add a systematic error to the data (see §2). We confirmed that the distribution of values is consistent with a distribution with 18 dof, which is the number of degrees of freedom in the individual fits.
The top panel of Figure 2 shows that, after an initial rise, on average the effective temperature decreases with time. The temperature profile shows three maxima, and as in the case of the hardness curve, the first peak of the effective temperature takes place before the first peak of the X-ray and bolometric light curves. The second peak of the effective temperature profile more or less coincides with the second peak in the X-ray and bolometric light curves, while the two minima in the temperature profile also coincide with the times of minima in the bolometric and the X-ray light curves. The last peak in the temperature curve occurs significantly after the last peak in the light curve.
The second panel of Figure 2 shows the evolution of the radius of the emitting surface, corrected for the fact that the spectrum during the burst is non-Planckian (see above). On average, the radius increases steadily during the burst, similar to what was observed in double-peaked bursts (e.g. Bhattacharyya & Strohmayer, 2006a, b). After initially rising, the radius stops increasing at the time of the first peak in the light curve, although there is no apparent change in the trend of the temperature at that point in time. For s the radius remains more or less constant, and after the second maximum in the light curve, it increases again. More or less at the time of the second minimum in the light curve the radius stops increasing, or slightly decreases, and after the third maximum the radius continues increasing until the end of the burst. (We note that the slight increase in the radius at the time of minimum temperature could be due to limitations in the colour correction factor.)
3.3 Timing analysis of the burst
We searched this burst for oscillations around the known spin frequency of the neutron star in 4U 1636–53 (581 Hz; Strohmayer et al., 1998a). For this, we analysed the data within 15 s of the onset of the burst, and we searched only the frequency range Hz. We chose a detection limit given by a single trial probability of or less of having a given power due to random fluctuations in the data. This is equivalent to a detection limit considering the number of trials involved. We did not find any significant oscillations in this frequency range during the burst. The 95 confidence upper limits to any oscillation in the frequency range 579 Hz to 583 Hz were , and rms for each of the three peaks of the burst, respectively, and and rms for the rise and the decay of the burst, respectively. Previously, burst oscillations with amplitudes between and were detected from 4U 1636–53 (Zhang et al., 1997).
Most burst oscillations in 4U 1636–53 were so far detected in bright, photospheric radius expansion bursts (Maurer & Watts, 2008), with bolometric peak fluxes larger than erg s-1 cm-2. One of the few exceptions to this trend is the possible detection of oscillations during the first peak of a non-radius expansion double-peaked burst in Bhattacharyya & Strohmayer (2006b): The bolometric flux at the peak in which oscillations were reported was erg s-1 cm-2. The bolometric flux at the peak of the triple-peaked burst reported here was erg s-1 cm-2, similar to that of the double-peaked burst of Bhattacharyya & Strohmayer (2006b), and a factor weaker than other photospheric radius expansion bursts with oscillations in this source. The upper limit to the rms amplitude we found during the first maximum of the triple-peaked burst of 4U 1636–53 reported here, , is lower than the rms amplitude of the oscillations during the first maximum of the double-peaked burst, , reported by Bhattacharyya & Strohmayer (2006b) from this same source.
3.4 Colour-colour diagram
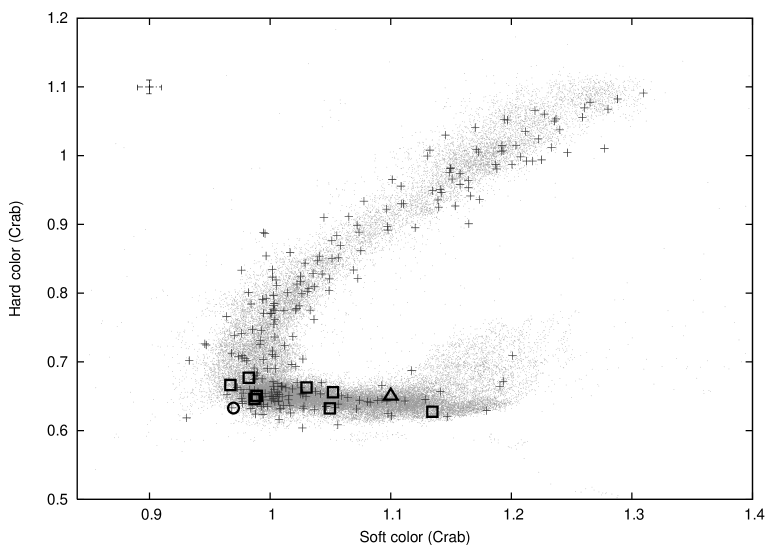
In Figure 3 we show the colour-colour diagram of all the RXTE observations of 4U 1636–53 to date (grey points), excluding times of X-ray bursts; the black crosses in the plot are the colours of the source at the start of an X-ray burst. There are more than 250 X-ray bursts shown in this Figure, from RXTE data taken before March 2009. The colour-colour diagram of 4U 1636–53 is typical of that of a low-luminosity LMXB, a so-called Atoll source (Hasinger & van der Klis, 1989). The X-ray bursts observed with RXTE distribute more or less uniformly across the colour-colour diagram (Belloni et al., 2007; Muno et al., 2004). The triple-peaked burst, which we indicated using a open circle, is located close to the vertex of this colour-colour diagram, in an area where there are several other bursts. For comparison, we plot the approximate position of the triple-peaked burst detected with EXOSAT in Figure 3 (van der Klis et al., 1990).
3.5 Bursts properties
In order to compare the properties of single-peaked bursts and muti-peaked bursts that occurred in the same area of colour-colour diagram, we selected all the bursts which have hard color less than 0.7 (see Figure 3), and calculated their fluences, peak fluxes and peak temperatures. We found that: (i) Single-peaked bursts have fluences in the range to ergs cm-2, whereas all the multi-peaked bursts have fluences that span a narrower range, from to ergs cm-2; (ii) single-peaked bursts show peak color temperatures from 1.3 to 2.7 keV, while the multi-peaked bursts have temperatures in the range 1.7 to 2.1 keV, with the exception of the double-peaked burst from Bhattacharyya & Strohmayer (2006b), which has a peak temperature of keV. (iii) single-peaked bursts show peak fluxes between and ergs cm-2 s-1, while the multi-peaked bursts have peak fluxes from and ergs cm-2 s-1, except for the same double-peaked burst from Bhattacharyya & Strohmayer (2006b) which has a peak flux of ergs cm-2 s-1 (Zhang et al. in prep.).
4 DISCUSSION
We have detected a triple-peaked X-ray burst in the LMXB 4U 1636–53. This is only the second triple-peaked burst ever detected from any LMXB, and the first one observed with RXTE. (The only other triple-peaked burst reported is also from 4U 1636–53, and was observed more than 20 years ago with EXOSAT; van Paradijs et al., 1986). The bolometric light curve of the triple-peaked burst shows a profile similar to that of the X-ray light curve, which indicates that this was not a radius expansion burst (see §3.2). This is consistent with the fact that the bolometric flux at the peak of this burst was a factor of smaller than the bolometric flux observed from radius-expansion bursts from this source (e.g. Maurer & Watts, 2008).
The temperature curve during this burst shows the same pattern of three maxima seen in the X-ray light curve, however the first and last peaks in the temperature curve occur significantly before and significantly after the first and last peaks in the X-ray light curve, respectively. The radius of the emitting surface increases more or less steadily during the burst, with small intervals during which the radius remains approximately constant or perhaps decreases slightly.
We found no oscillations in this burst, with upper limits that are consistent with oscillations detected in previous bursts in 4U 1636–53, but smaller than the amplitude of the oscillations seen during the non-radius expansion, double-peaked burst in Bhattacharyya & Strohmayer (2006b).
The triple-peaked X-ray burst took place when the source was at an intermediate position in the colour-colour diagram. There are several other X-ray bursts around this location in the colour-colour diagram, none of them showing a triple-peaked profile. If the position of the source along the -like shape of the colour-colour diagram (Fig. 3) is a measure of mass accretion rate (with mass accretion rate increasing as the source moves along the branches from the upper-right to the lower-left and then to the lower-right corner of this diagram; Hasinger & van der Klis, 1989), this indicates that the triple-peaked nature of this burst is not associated to a rate of mass accretion onto the neutron star that is different from that in other, single-peaked, bursts. The previously detected triple-peaked burst in 4U 1636–53 took place when the source was located in the middle of the branch that extends to the right of the position of the triple burst in this diagram (van der Klis et al., 1990), when mass accretion rate was presumably higher. Also in the case of the EXOSAT observations, there are other normal bursts around the position of triple-peaked burst of van Paradijs et al. (1986) in the colour-colour diagram.
The triple-peaked burst started s from the beginning of the RXTE observation; from the absence of another X-ray burst in those s, the wait time from the previous X-ray burst was s. The previous X-ray burst recorded by RXTE before the triple-peaked burst took place at 02:42:12 UTC on November 19 2006, therefore the wait time before the triple-peaked burst was s. Given the typical burst rate in 4U 1636–53 (Galloway et al., 2008), most likely several X-ray bursts were missed in between these two observations, and therefore we can only give a lower limit of to the value of of the triple-peaked burst.
Boirin et al. (2007) reported X-ray bursts that occur in triplets; we note that theirs is probably a completely different phenomenon than the triple-peaked burst that we report here. The bursts detected by Boirin et al. (2007) are single-peaked, with waiting times of min between the three components of the triplet. The burst we report here shows a triple-peaked structure within a single burst, with the time between peaks being less than seconds.
Most type-I X-ray bursts display a single peak in the bolometric light curve, with a profile that shows a fast rise and an exponential decay (Galloway et al., 2008). About a dozen double-peaked and two triple-peaked X-ray bursts have been detected from the LMXB 4U 163653 (Sztajno et al., 1985; Lewin et al., 1987; van Paradijs et al., 1986; Galloway et al., 2008; Bhattacharyya & Strohmayer, 2006a, b; Maurer & Watts, 2008, this paper). Double-peaked bursts were observed from other sources besides 4U 1636–53, e.g., 4U 1608-52 (Penninx et al., 1989), GX 17+2 (Kuulkers et al., 2002), and 4U 1709-267 (Jonker et al., 2004); but so far there is no report of a triple-peaked burst from another source besides 4U 1636–52.
In the past 20 years, several models have been proposed to explain the double-peaked non-radius expansion bursts. Regev & Livio (1984) proposed a model in which the neutron-star surface is divided in two zones, such that the burst starts in one zone and moves into the other. In this model, a temperature gradient develops between the zone where the burst ignites and the zone onto which the burst flame expands. A heat transport impedance between the two zones causes a dip in the temperature and the light curve, and produces a double-peaked burst. Fisker et al. (2004) repeated these calculations using up two 200 zones, and found that the effect disappears as the number of zones increases beyond . Fujimoto et al. (1988) explained the double-peaked bursts as a two-step energy generation due to shear instabilities in the fuel on the stellar surface. Bhattacharyya & Strohmayer (2006a) argued that this model cannot reproduce the double-peaked profiles that are observed, and that it is difficult to maintain sufficient unburnt material in a layer above the burning flame, as required for the instability to take place, without having the hot fuel mixing with the cold one. Melia & Zylstra (1992) suggested that these bursts are due to scattering of the X-ray emission by material evaporated from the accretion disc during the burst. This implies that double-peaked bursts can only take place over a certain range of inclination angles of the binary system. This model, however, does not explain the evolution of the temperature or the radius of the emitting area during the bursts, neither does it explain the fact that only a small fraction of the bursts are multi-peaked. Fisker et al. (2004) proposed that the double-peaked bursts are due to an interaction between the shell where the helium flash takes place, and a waiting point in the -processes of the shells above. This model can explain the multi-peaked bursts naturally in terms of a waiting point in the thermonuclear reaction during the burst, but it is difficult to reproduce the large dip observed between two peaks in some double-peaked bursts (Bhattacharyya & Strohmayer, 2006a).
Bhattacharyya & Strohmayer (2006a, b) proposed that the double-peaked shape of the profile of some type-I X-ray bursts may be due to the latitude at which the ignition of the burst takes place: For bursts that ignite at a high latitude, the spreading of the flame on the surface of the neutron star is opposed by the flow of material accreted from the disc as this material moves towards the pole. As it approaches the equator, the burning front stalls momentarily, causing a minimum in the light curve. Eventually the burning front overcomes the opposing effect of the accreting material, and extends across the whole surface of the neutron star, leading to a double-peaked burst. This model can reproduce both the light curve as well as the spectral evolution of double-peaked bursts. It also provides an explanation of the millisecond oscillations detected by Bhattacharyya & Strohmayer (2006b) during the first peak of a double burst in 4U 1636–53. However, polar ignition (a crucial factor of this model) should occur at the highest accretion rates (Cooper & Narayan, 2007), which makes it difficult for this model to explain that the inferred mass accretion rate at the time of the double-peaked burst with oscillations (Bhattacharyya & Strohmayer, 2006b) is lower than in single-peaked bursts without oscillations (Watts & Maurer, 2007). Notice, however, that Maurer & Watts (2008) suggested that polar ignition can occur in a small range of lower accretion rates as well. Furthermore, Maurer & Watts (2008) simulated burst light-curves for different ignition latitudes using a phenomenological model for the time-dependent surface-temperature profile on the neutron-star surface, and adopting the calculations of Spitkovsky et al. (2002) for the speed of the burning front. Maurer & Watts (2008) also simulated light curves of bursts igniting quasi-simultaneously in two different places on the neutron-star surface, with delays between ignitions of 0.5 s to 4 s. None of their simulations produced a multi-peaked profile.
Our detection of a triple-peaked burst in 4U 1636–53 casts doubt on the idea that the place of ignition of the burst is the cause of the multi-peaked light curves (Bhattacharyya & Strohmayer, 2006a). If this scenario applies to the triple-peaked burst, the burning front must stall twice before it engulfs the whole surface of the neutron star. In their model of the double-peaked bursts, Bhattacharyya & Strohmayer (2006a) argued that the burning front stalls as it approaches the neutron-star equator, and it regains speed after it crosses the equator. Clearly, a more complicated pattern of stalling is required in the case of a triple-peaked burst.
Both double- and triple-peaked bursts in 4U 1636–53 have very similar properties: (i) The fluence of the triple-peaked burst reported here is erg cm-2, while the double-peaked bursts have fluences in the range erg cm-2 (see Figure 4 in Watts & Maurer, 2007). (ii) Except for the double-peaked burst in Bhattacharyya & Strohmayer (2006b), which is more or less a factor two brighter than the rest, all double- and triple-peaked bursts have similar peak-flux values. (iii) Neither the double- or triple-peaked burst are radius expansion bursts. (iv) Both triple-peaked bursts (the one reported here and the previous one reported in van Paradijs et al., 1986), and all double-peaked bursts (Galloway et al., 2008; Maurer & Watts, 2008; Watts & Maurer, 2007, Zhang et al., in prep.) occur when the source is more or less in the same region in the colour-colour diagram, accreting at relatively high inferred mass accretion rate. All these similarities suggest that the underlying mechanism for double- and triple-peaked bursts should be the same. Currently available models are inadequate to explain the multiple-peaked bursts. It is clear that any model trying to explain the burst profiles must also be able to explain the fact that only about a dozen out of bursts in the RXTE data of 4U 1636–53 show multiple peaks, with only one out of in the RXTE data, and in fact only two out of bursts observed since the beginning of X-ray astronomy (van Paradijs et al., 1986; in’t Zand et al., 2004; Galloway et al., 2008), showing a triple-peaked profile.
Acknowledgments
It is a pleasure to thank Randall L. Cooper and the referee for helpful comments. This research has made use of data obtained from the High Energy Astrophysics Science Archive Research Center (HEASARC), provided by NASA’s Goddard Space Flight Center. TMB acknowledges support from the Italian Space Agency through grants I/008/07/0 and I/088/06/0. JH is grateful for support from NASA, through grants NNG05G053G and NNX06AE22G
References
- Altamirano et al. (2008) Altamirano D., van der Klis M., Méndez M., Jonker P. G., Klein-Wolt M., Lewin W. H. G. 2008, ApJ, 685, 436
- Anders & Grevesse (1989) Anders, E., & Grevesse, N. 1989, Geochim. Cosmochim. Acta, 53, 197
- Balucinska-Church & McCammon (1992) Balucinska-Church, M., & McCammon, D. 1992, ApJ, 400, 699
- Bhattacharyya & Strohmayer (2006a) Bhattacharyya S., Strohmayer T. E. 2006a, ApJ, 636, L121
- Bhattacharyya & Strohmayer (2006b) Bhattacharyya S., Strohmayer T. E. 2006b, ApJ, 641, L53
- Boirin et al. (2007) Boirin, L., Keek, L., Méndez, M. Cumming, A., in’t Zand, J. J. M., Cottam J. Paerels, F., & Lewin, W. H. G. 2007, A&A, 465, 559
- Belloni et al. (2007) Belloni T., Homan J., Motta S., Ratti E., Méndez M. 2007, MNRAS, 379, 247
- Cackett et al. (2009) Cackett E. M., et al., 2009, ApJ, 690, 1847
- Cooper & Narayan (2007) Cooper R. L., Narayan R. 2007, ApJ, 657, 29
- Damen et al. (1989) Damen, E., Jansen, F., Penninx, W., Oosterbroek, T., van Paradijs, J., & Lewin, H. G. 1989, MNRAS, 237, 523
- Fiocchi et al. (2006) Fiocchi, M., Bazzano, A., Ubertini, P., & Jean, P. 2006, ApJ, 651, 416
- Fisker et al. (2004) Fisker, J. L., Thielemann, F., & Wiescher, M. 2004, ApJ, 608, L61
- Fujimoto et al. (1988) Fujimoto, M. Y., Sztajno, M., Lewin, W. H. G., & van Paradijs, J. 1988, A&A, 199, L9
- Galloway et al. (2008) Galloway D. K., Muno M. P., Hartman J. M., Savov P., Psaltis D., Chakrabarty D. 2008, ApJS, 179, 360
- Gruber et al. (1996) Gruber, D. E., et al. 1996, A&AS, 120, 641
- Hasinger & van der Klis (1989) Hasinger, G., & van der Klis, M. 1989, A&A, 225, 79
- in’t Zand et al. (2004) in’t Zand J., et al., 2004, NuPhS, 132, 486
- Jahoda et al. (1996) Jahoda, K., Swank, J. H., Giles, A. B., Stark, M. J., Strohmayer, T., Zhang, W., & Morgan, E. H. 1996, Proc. SPIE, 2808, 59
- Jonker et al. (2004) Jonker, P. G., Galloway, D. K., McClintock, J. E., Buxton, M., Garcia, M., & Murray, S. 2004, MNRAS, 354, 666
- Kuulkers et al. (2002) Kuulkers, E., Homan, J., van der Klis, M., Lewin, W. H. G., & Méndez, M. 2002, A&A, 382, 947
- Kuulkers et al. (2004) Kuulkers, E., in ’t Zand, J., Homan, J., van Straaten, S., Altamirano, D., & van der Klis, M. 2004, in X-ray Timing 2003: Rossi and Beyond, ed. P. Kaaret, F. K. Lamb, & J. H. Swank, Vol. 714 (Melville, NY: AIP), 257–260
- Lewin et al. (1987) Lewin, W. H. G., Penninx, W., van Paradijs, J., et al. 1987, ApJ, 319, 893
- Lewin et al. (1993) Lewin, W. H. G., van Paradijs, J., & Taam, R. E. 1993, Space Sci. Rev., 62, 223
- Linares et al. (2009) Linares, M. et al. 2009, ATel #1979
- London et al. (1986) London, R. A., Taam, R. E., & Howard, W. M. 1986, ApJ, 306, 170
- Madej et al. (2004) Madej, J., Joss, P. C., & Różańska, A. 2004, ApJ, 602, 904
- Maurer & Watts (2008) Maurer, I., & Watts, A. L. 2008, MNRAS, 383, 387
- Melia & Zylstra (1992) Melia, F., & Zylstra, G. J. 1992, ApJ, 398, L53
- Muno et al. (2004) Muno, M. P., Galloway, D. K., & Chakrabarty, D. 2004, ApJ, 608, 930
- Pandel et al. (2008) Pandel, D., Kaaret, P., & Corbel, S. 2008, ApJ, 688, 1288
- Penninx et al. (1989) Penninx, W., Damen, E., van Paradijs, J., Tan, J., & Lewin, W. H. G. 1989, A&A, 208, 146
- Regev & Livio (1984) Regev, O., & Livio, M. 1984, A&A, 134, 123
- Spitkovsky et al. (2002) Spitkovsky, A., Levin, Y., & Ushomirsky, G. 2002, ApJ, 566, 1018
- Strohmayer et al. (1998a) Strohmayer, T. E., Zhang, W., Swank, J. H., & Lapidus, I. 1998a, ApJ, 503, L147
- Strohmayer et al. (1998b) Strohmayer, T. E., Zhang, W., Swank, J. H., White, N. E., & Lapidus, I. 1998b, ApJ, 498, L135
- Strohmayer & Bildsten (2003) Strohmayer, T. E., & Bildsten, L. 2003, in Compact Stellar X-Ray Sources, ed. W. H. G. Lewin & M. van der Klis (Cambridge: Cambridge Univ. Press).
- Sztajno et al. (1985) Sztajno, M., et al. 1985, ApJ, 299, 487
- van Paradijs et al. (1986) van Paradijs J., Sztajno M., Lewin W. H. G., Trumper J., Vacca W. D., van der Klis M. 1986, MNRAS, 221, 617
- Vaughan et al. (1994) Vaughan, B. A., et al. 1994, ApJ, 435, 362
- Swank et al. (1976) Swank, J. H., Becker, R. H., Pravdo, S. H., Saba, J. R., & Serlemitsos, P. J. 1976a, IAU Circ., 3000
- Titarchuk (1994) Titarchuk, L. 1994, ApJ, 429, 340
- van der Klis et al. (1990) van der Klis M., Hasinger G., Damen E., PenninxW., van Paradijs J., Lewin W. H. G. 1990, ApJ, 360, L19
- van Paradijs & Lewin (1986) van Paradijs J., Lewin W. H. G. 1986, A&A, 157, L10
- van Paradijs et al. (1990) van Paradijs, J., et al. 1990, A&A, 234, 181
- Watts & Maurer (2007) Watts A. L., Maurer I. 2007, A&A, 467, L33
- Wijnands (2001) Wijnands, R. 2001, ApJ, 554, L59
- Zhang et al. (1997) Zhang, W., Lapidus, I., Swank, J. H., White, N. E., & Titarchuk, L. 1997, IAU Circ. 6541