A far-infrared survey at the North Galactic Pole I: Nearby star-forming galaxies and effect of confused sources on source counts
Abstract
We present follow-up observations of the far-infrared (FIR) sources at 90, 150 and 180 m detected as part of the ISOPHOT EBL project, which has recently measured the absolute surface brightness of the cosmic infrared background radiation (CIRB) for the first time independently from COBE data. We have observed the fields at the North Galactic Pole region in the optical and near-IR, and complement these data with SDSS photometry, and spectroscopy where available, and present identifications of the 25 FIR sources which reach down to mJy in all three ISOPHOT bands. Identifications are done by means of full spectral energy density fitting to all sources in the FIR error circle areas. Approximately 80 per cent are identified as star-forming or star-bursting galaxies at . We also find that more than half of the counterparts have disturbed morphologies, with signs of past or present interactions. However, only 20 per cent of all the sources are uniquely matched with a single galaxy – 40 per cent are blends of two or more of these nearby star-forming galaxies, while another 20 per cent are likely blends of nearby and fainter galaxies. The final 20 per cent are likely to be more luminous IR galaxies at higher redshifts. The blended sources have an effect on the FIR source counts. In particular, taking into account realistic confusion or blending of sources, the differential FIR counts move down by a factor of and steepen in the 100 to 400 mJy range.
keywords:
Galaxies: evolution – Infrared: galaxies – galaxies: starburst1 Introduction
The initial detection of the cosmic infrared background (CIRB) in the far-infrared (FIR) using COBE between 100 and 240 m by Hauser et al. (1998), Fixsen et al. (1998), and preliminarily by Puget et al. (1996), showed that a large part of all the radiation produced in the universe since the recombination epoch is contained in the CIRB. In the context of understanding galaxy formation and evolution, and indeed the history of all luminous matter in the universe, it is thus important to understand what and where the CIRB contributors are. This has been a subject of intense work ever since the COBE results (for reviews see Hauser & Dwek, 2001; Lagache, Puget & Dole, 2005).
The ISOPHOT EBL project aimed to determine the level of CIRB independently from the COBE data by making use of the better resolution of ISO which allows looking into the very deepest regions on the FIR sky in-between Galactic cirrus clouds. The FIR source counts from this project were reported in Juvela, Mattila & Lemke (2000). The CIRB surface brightness in three wavelengths 90, 150 and 180 m was recently presented in Juvela et al. (2009) – this constituted the first independent verification of the absolute CIRB level since the various COBE results. In between 150 and 180 m the CIRB was measured to be MJy sr-1 and at 90 m a 2 upper limit of 2.3 MJy sr-1 was measured, all values consistent with the COBE measurements obtained with the DIRBE and FIRAS instruments.
However, only the bright tail of FIR sources contributing to the CIRB can be resolved with data from past missions, reaching to typical levels of somewhat fainter than mJy at 180 m. The FIR source counts at 90 to 180 m in our project contribute per cent of the CIRB surface brightness (Juvela, Mattila & Lemke, 2000). This result is similar to other FIR studies (e.g. Dole et al., 2001; Frayer et al., 2006b; Matsuura et al., 2007) when looking at the FIR sources directly using ISO, Spitzer, and AKARI. Statistically one can probe fainter FIR populations by using e.g. stacking methods, as shown by Dole et al. (2006) and Papovich et al. (2007). Due to significantly less severe confusion, the resolved fraction of individual sources in the mid-IR 15 and 24 m mid-IR wavelengths is much higher, around 60 to 75 per cent (e.g. Elbaz et al., 2002; Papovich et al., 2004; Rodighiero et al., 2006). Frayer et al. (2006a) report resolving 60 per cent of the CIRB also at 70 m using fluctuation studies and extrapolated source counts. At wavelengths longer than this, up until m, the fraction of directly resolved CIRB sources has essentially not changed since the various ISOPHOT studies. The recent BLAST experiment reports resolving the FIR background at 500 m by stacking a Spitzer 24 m catalog against their FIR map (Devlin et al., 2009).
During the decade of FIR follow-up studies it has also become evident how difficult it is to identify the optical and near-IR counterparts of these FIR sources (e.g. Patris et al., 2003; Taylor et al., 2005; Oyabu et al., 2005; Dennefeld et al., 2005; Sajina et al., 2006; Frayer et al., 2006b). Typically only a third, or a half, of the FIR sources have unambiguous counterparts at shorter wavelengths. The problem is this: because of the large beam sizes there are many possible counterparts in optical images within the positional error circles of FIR sources. Hence, to aid identification other waveband data, especially MIR or radio data, and often quite elaborate decision trees are typically used to merge catalogs with unique counterparts (e.g. Taylor et al., 2005; Oyabu et al., 2005). Another difficulty arising from the large beam sizes is the high level of confusion among the FIR detections resulting in blended objects, which in turn make the optical identifications even more complicated. These difficulties indirectly affect mid-IR studies as well, since many interesting cosmological or galaxy evolution results from the MIR surveys require information of the spectral energy distributions (SEDs) of the FIR part of the spectra of the targets. These are just not available to similar depths, unless the MIR data itself is used to identify sources and construct FIR SEDs, leading into possibly unhealthy dependencies.
Nevertheless, a basic expectation and consensus has been built where the FIR sources are either local IR-bright sources dominated by cold cirrus emission or higher redshift sources whose strong IR-luminosity raises them into the class of luminous or ultra-luminous IR-galaxies (LIRGs or ULIRGs, or , respectively). The relative amounts of sources in these classes depend on the depth of the survey (see e.g. Rowan-Robinson, 2009). To interpret the cosmological evolution of IR-bright galaxies, it remains crucial to understand the exact nature of galaxies emitting at 100 to 200 m where the CIRB peaks. The imminent Herschel data will probe these galaxies to further distances (Pilbratt, 2008) and it is important to determine the characteristics of the more nearby bright FIR galaxy population for reference.
In this paper we revisit the source detections of the ISOPHOT EBL project by presenting optical and NIR follow-up observations of the ISOPHOT NGP fields. Rather than trying to force individual optical and NIR counterparts for each FIR source, we assess carefully the possibility of confused, or blended, sources. In addition, we do not use mid-IR or radio data to identify sources. We present the properties of all the unambiguous matches and discuss the level of likely confusion in the FIR source list. If it were to be shown that a significant fraction of ISOPHOT sources are actually confused sums of several objects, or even whole galaxy groups or clusters, FIR source counts and their evolutionary interpretation might have to be revised.
In a second paper of the series (Väisänen et al., in preparation) we will concentrate on the correlations of the FIR source positions with significant peaks in the galaxy surface density, any signs of clustering and any bona fide galaxy clusters.
We use a spatially flat cosmology with km s-1 Mpc-1, , and throughout.
2 Data
2.1 Observations and data reductions
The ISOPHOT observations are fully described in Juvela, Mattila & Lemke (2000). The North Galactic Pole (NGP) field with an area of 1.07 sq.deg covers 2/3 of the whole ISOPHOT EBL project area and contains 22 individual sources in the 170 and 150 m bands, and 25 sources at 90 m. Sources were detected down to mJy in all three bands, while simulations indicated a typical 70 per cent or more completeness at mJy. The three ’extra’ detections in the 90 m are in fact sources very close to another 90 m source, and the two of them share the same single longer wavelength ISOPHOT detection; we therefore have followup of 22 different fields-of-view. All these fields were targeted with ground based observations presented in this paper. Observations were performed using the 2.56-m Nordic Optical Telescope (NOT) on La Palma. Optical data were taken on 8-10 April 2003 using the ALFOSC instrument, and the near-IR observations were carried out on 13-15 April 2003 using the NOTCam instrument.
ALFOSC is a 2x2k CCD camera, giving a field of view of 6.4’x6.4’. We obtained 900 sec and -band (filters 76 and 12) images of the target fields, split into three separate offset integrations. The data were reduced and combined in the standard manner using IRAF.
NOTCam is a 1x1k “Hawaii” near infrared camera. The low resolution mode of the instrument was used, giving a 4’x4’ field of view. We obtained -band images of all the fields. Target fields were observed in 1-minute dithers for a total of 25-minute integration time per field. The flatfielding (twilight flats were used), sky frame construction, sky subtraction, and registering and co-adding of the frames into final NIR images was performed using the XDIMSUM package along with dedicated IDL routines.
Seeing remained in the range arcsec in -band and in the optical bands throughout our observing runs. The astrometry for both optical and infrared images was obtained through matching GSC2 stars – we estimate the accuracy to be better than 0.4″ throughout the frames.
We note that while the NGP area has not been observed by other targeted
FIR surveys in the past, it will shortly be covered by the Herschel Thousand
Degree Survey (PI:Eales.111http://herschel.esac.esa.int/Docs/KPOT/KPOT_accepted.html
#KPOT_seales01_2)
2.2 Photometry
All photometry was derived using the SExtractor (v2.3.2) software (Bertin & Arnouts, 1996). Both aperture and ’auto’ magnitudes were used as detailed below. We maximised the detection efficiency by performing systematic and comprehensive testing of the SExtractor settings with our data. Numbers of real and potentially spurious objects were determined by using both deeper data, i.e. checking the deeper optical images when performing NIR photometry, and negatives of the final images in case of optical frames.
We calculated numerous aperture magnitudes, as well as the AUTO and BEST magnitudes, which dynamically adjust the size of the aperture depending on the shape and size of the object. By using curves-of-growth with bright non-saturated stars, we determined aperture corrections for slightly different seeing conditions and fixed size apertures. When giving colours we typically refer to magnitudes calculated inside 2.6″ diameter apertures, approximately 2.5 times typical seeing, corrected to the -band seeing value. However, total magnitudes, adopting the BEST magnitude which we find to be most robust in our uncrowded fields with both extended galaxies brighter than =23 mag and compact objects throughout our magnitude range, are used when a single-band brightness is given for an object. We checked these to be totally consistent with the total magnitudes derived from curves of growth used for standard stars. An exception is made with bright galaxies clearly larger than ″ for which these total magnitudes are used throughout, also in the SEDs. In summary, we estimate our photometry to be accurate to approximately 0.03 mags in the optical and 0.05 in the NIR data. Finally, we checked that our photometry was consistent within few percent with 2MASS galaxies found in our areas.
Zero-point calibrations were obtained through observations of standard stars throughout the nights, which were photometric. The absolute calibration to Vega-based system is estimated to be accurate to 0.02 and 0.05 mag in the optical and NIR, respectively. The extinction coefficents were fixed to average values of the nights, to , , and in , , and -bands, respectively. In addition, a colour-term of was used to derive the final optical magnitudes.
Since detection of optical objects was done with co-added frames, the and band source lists have the same number of objects. These were cross-correlated with the -band source list to produce source lists of 3-band detections, optical detections only (since data is deeper than NIR), and NIR-only (including very red objects).
2.3 SDSS data
We also extracted ugriz photometry from the SDSS DR7 (Abazajian et al., 2009) archives for all our fields to complement our own dataset. SDSS data are shallower than our own optical data, but they extend the wavelength range of the brighter galaxies and thus make SED fitting significantly more reliable. After testing with different magnitudes we found that we acquire the best results, the smoothest combined SEDs, when adopting total magnitudes, as described above, for our own photometry, and Petrosian magnitudes for the SDSS galaxies brighter than mag, and SDSS model magnitudes for those fainter than this limit222see http://www.sdss.org/DR7/algorithms/photometry.html.
3 ISOPHOT sources in NGP fields
3.1 Matching of FIR and optical/NIR sources
As discussed in Section 1, identification of FIR sources is difficult because of confusion and the large beam sizes. Typical approaches include using supplementary MIR or radio surveys in helping to decide which of the many galaxies within the beam is the correct counterpart, and then running likelihood ratio methods taking into account the distance of counterpart candidates from the FIR source as well as the surface densities of all relevant populations. Often the one MIR and/or radio galaxy giving the largest likelihood is chosen as the counterpart, unless no candidates are found above a given probability threshold (see e.g. Mann et al., 2002; Oyabu et al., 2005; Taylor et al., 2005). Further analysis, SED fitting etc., is based on this identification. While the advantage obviously is to have a well-defined and quantitative method, the downsides include possible biases depending on the “indicator source” and especially the difficulty of assessing the possibility of multiple galaxies contributing to the FIR source. In this paper we attempt a much more straight-forward philosophy, though admittedly one less robustly defined.
We first searched for all sources with , , and -band detections within 60″ of the centre of the ISOPHOT detection. Making use of the SExtractor star vs. galaxy neural network classifier, we excluded clear stellar objects by selecting only those with a mean CLASS parameter less than in all the three bands. Typically there remain 20 to 50 extended objects per ISOPHOT error circle. The optical/NIR sources were then matched also with the SDSS catalogs by searching for common objects within 1″ radius.
3.1.1 SED fitting and other analysis of candidates
Next we fitted template SEDs using the HYPERZ software (Bolzonella et al., 2000) to all sources found in the ISOPHOT error circles. The whole range of wavelengths from UV to FIR was fitted, our optical and NIR datapoints along with the five SDSS bands and three ISOPHOT points. The fainter targets not having SDSS photometry were fitted with +ISO only. The model templates were taken from, or calculated using, the GRASIL library/code (Silva et al., 1998) – in particular we used a range of Sc-type SEDs of different age, different age ellipticals, fully evolved Sa and Sb galaxies, as well as model fits to the SEDs of NGC 6946, NGC 6090, M82, Arp 220, and HR10, which respectively represent star-forming dwarfs, interacting/starbursting galaxies, warmer starbursts, (ultra) luminous IR galaxies, and extremely obscured objects.
When fitting the templates within HYPERZ, we turned off reddening since the GRASIL SED models already have dust and gas properties with consistent extinction and re-emission mechanisms and effects built in throughout the wide spectral range. We assumed a mag uncertainty in the relative matching of FIR and ground-based parts of the SED due to uncertain aperture effects.
The source catalogs in the target fields, now associated with photometric redshifts, best-fit SED templates, and especially the related chi-square values and probabilities attached to the HYPERZ fits, form the basis of the selection of counterparts. Note especially that we do not use any information of the distance to the FIR detection centre in the analysis, but treat all sources in the error circle equally. Rodighiero et al. (2005) cite a typical blended FIR source distance of 55″ in their 90 m data, and such cases would be severely misinterpreted by e.g. just picking the closest candidate to the FIR detection centre (see also Sajina et al., 2006). On the other hand, we note that by fitting known templates to objects we cannot get away from the bias against totally unknown classes of sources, which plagues all FIR identification studies.
We also searched the SDSS spectroscopic archive for any available spectra for the bright galaxies in the target fields. Within the ISOPHOT error circles 12 redshifts were found, and for these objects the redshift was fixed in the HYPERZ fit.
To have a quantitative measure of the morphology of the brighter galaxies in the field, we used the GALFIT program (Peng et al., 2002) to model the surface brightness distributions of the combined images.
3.1.2 Breakdown of the candidates
Based on the types of optical-NIR objects within the 1 arcmin search radius characterized by their magnitudes, SEDs, model fits and redshifts (photometric or spectroscopic), as well as morphologies, we separated the 22 FIR objects in the present sample into two groups: In the first instance, we find 5 fields which have a single bright mag galaxy in the ISOPHOT detection circle. All these galaxies are more than two magnitudes brighter than any other object in the area and they are all well fit with a template SED all the way from UV and optical to FIR. They also have SDSS spectroscopy available which is consistent with their nature as FIR sources. They are all brighter than =14.8 mag and we note that using average bright -band galaxy counts (e.g. Väisänen et al., 2000), there is less than 10 per cent probability to find a mag galaxy inside a 60″ radius circle. We refer to these five unambiguous ISOPHOT counterparts as the “bright sample”.
The second group of ISOPHOT targets, 17 of them, is called the “faint sample”, referring to the brightness of the counterpart galaxies, not that of the FIR flux. There are essential differences amongst these sources, however. More than half of the fields do actually have fairly bright mag galaxies in them, but there are usually two to four of them, suggesting possible blending. The rest of the fields, on the other hand, look initially empty of any obvious counterpart candidates. When investigating the faint sample individually below, we categorize them according to how and why the cases are ambiguous.
3.1.3 Further modelling of SEDs
To have an independent characterization of the brighter counterparts with redshifts, or secure estimates thereof, we modelled them with the radiative transfer models of Efstathiou et al. (2000) and Efstathiou & Rowan-Robinson (2003) (hereafter ERR03). The models incorporate the stellar population synthesis model of Bruzual & Charlot (1993) and the dust model of Siebenmorgen & Krügel (1992) which treats small transiently heated grains and PAH molecules as well as large classical grains. The models have been shown to be in good agreement with the spectral energy distributions of starburst and cirrus-dominated galaxies (Efstathiou et al., 2000; Efstathiou & Rowan-Robinson, 2003; Farrah et al., 2003; Taylor et al., 2005).
3.2 Unambiguous bright galaxies
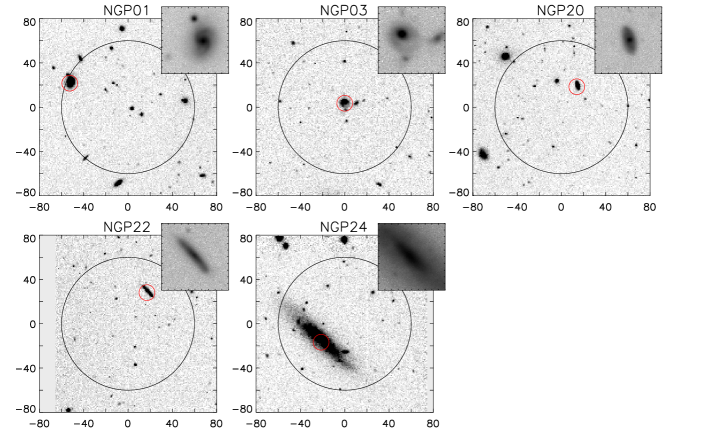
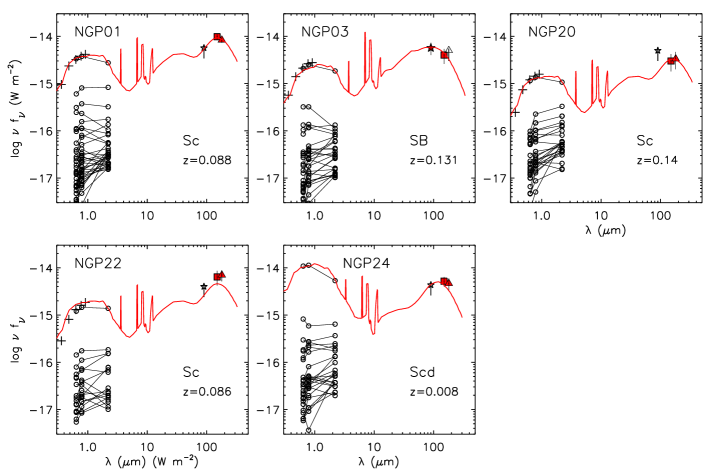
All the FIR sources of the bright sample defined above have FIR source quality flag values of (see Juvela, Mattila & Lemke, 2000) in at least one detected band. The sources are listed in Table 1 along with some characteristics based on GRASIL model fits, whereas Table 2 lists the ERR03 model fits. Based on our optical imaging, all these sources are disk galaxies. Images from the combined ALFOSC imaging are shown in Fig. 1. SEDs of all sources within 60″ radius from the ISOPHOT source are shown in Fig. 2 and the best-fitting SED to the bright candidate is also overplotted. The detailed description of each of the five fields, with discussion leading to the identification of the source, its SED and morphological fit, is presented in the Appendix.
As can be seen from the Tables 1 and 2 the likely counterparts are generally nearby (strongly) star-forming late type spiral galaxies. The general characteristics of the population is discussed below in Section 4.1.
|
-
a
nominally 15 Gyr Sc-model
-
b
NGC 6090 model
-
c
uncatalogued - see text
-
d
NGC 6946 model
|
-
a
The temperature of the dominant 0.24m graphite grain species in the best-fitting model in the FIR is listed.
-
b
Dust mass is estimated as in Taylor et al. (2005) but the method has been generalised to take into account the distribution of dust temperature predicted by the model.
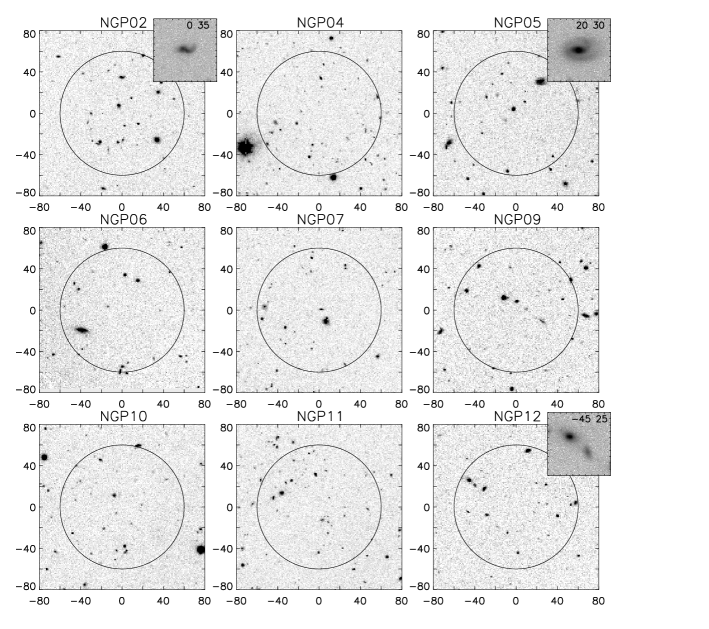
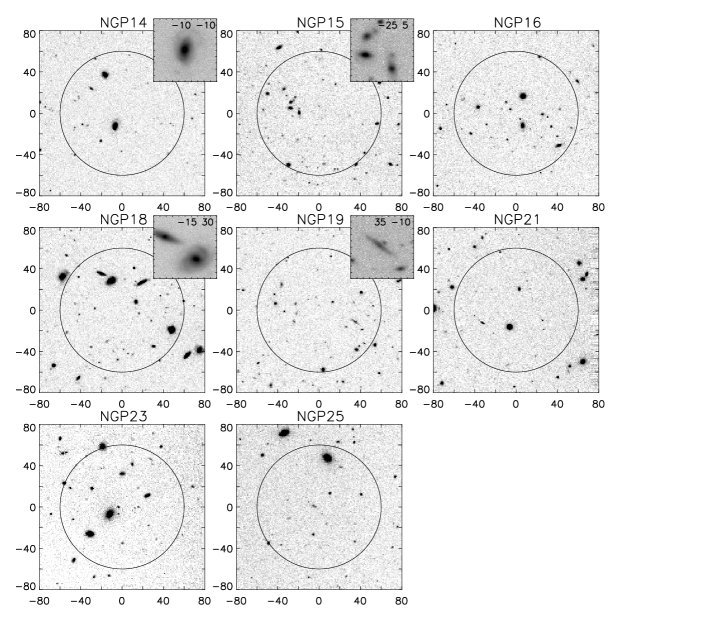
3.3 Confused fields
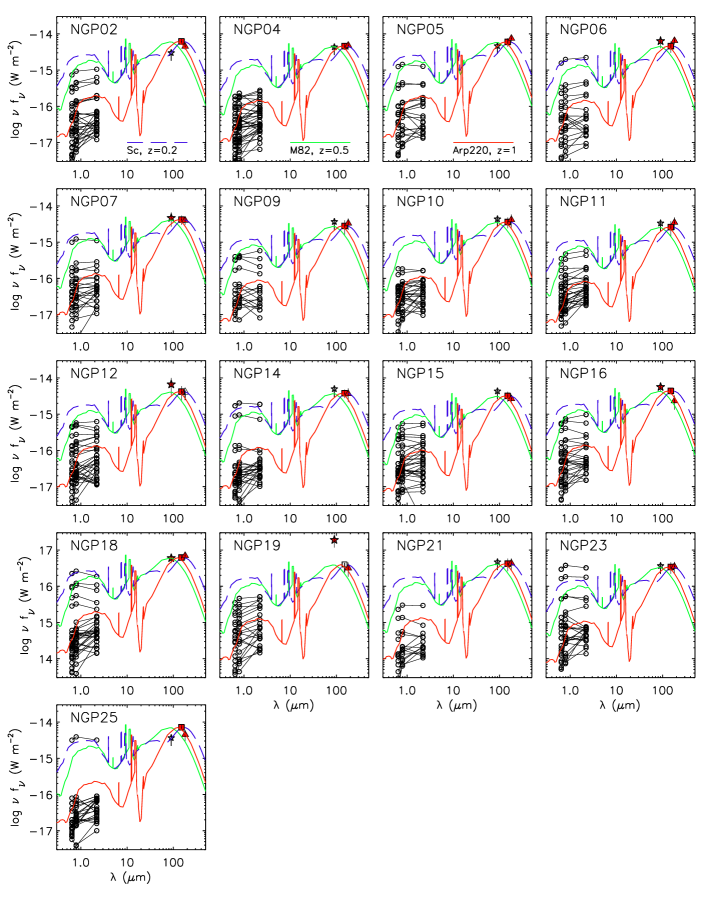
There are 17 cases in the present FIR sample where we cannot find a single unambigious counterpart, though in many cases there are fairly bright, mag galaxies in the vicinity. In fact, in more than half of the fields there are two to five mag galaxies within the ISOPHOT detection error circle, while statistically only 0.4 galaxies are expected. It is likely that the majority of these cases are indeed confused FIR sources where the IR flux originates from several individual sources. Images of fields based on ALFOSC data are shown in Fig. 3. We discuss the cases individually in the Appendix, while a summary is presented in Table 3, and the general physical characteristics are discussed in Section 4.2. Figure 5 shows the +FIR SEDs of the target fields; note that the overplotted SED templates are indicative of typical templates and typical redshifts, and not the best fits for the individual cases.
|
4 Discussion
4.1 The nature of unambiguous counterparts
We found in Section 3.2 that five of our 22 FIR sources, i.e. 23 per cent, are unambiguously identified with low-redshift star-forming spiral galaxies. Apart from NGP24 all are just about at or above the LIRG luminosity criterion of . Apart from NGP20 all have evidence of disturbed morphology and NGP03 is the clearest case of an interacting system. Assuming typical -band mass-to-light ratios of star-forming spiral galaxies (Bell & De Jong, 2001; Gil de Paz et al., 2000) the estimated stellar masses range from 4 to , i.e. close to a mature galaxy (Cole et al., 2001). The exception in this class is NGP24, a very nearby, 34 Mpc, star-forming dwarf galaxy with an absolute brightness of a mere .
Should this set of galaxies, ignoring NGP24 from now on, be characterized as normal quiescent spirals or starbursts? The SFRs derived by both GRASIL and ERR03 fits are in the range of , i.e. higher than ordinary local spirals by factors of few, but still lower than typical strong nuclear starbursts. The ERR03 models, Table 2, show them to be cirrus dominated, but with significant contributions from warmer dust in star-bursts. Determination of the specific star-formation rate (SSFR) also place our galaxies somewhere in between quiescent galaxies and starbursts: SSFRs are , similar to local selected star-forming galaxies (see e.g. Gil de Paz et al., 2000; Sajina et al., 2006). The ISOPHOT sample SSFR values are clearly higher than those of local galaxies in general, even the ‘blue’ ones: most of the stellar mass in the local Universe peaks at while the blue cloud is at around (e.g. Kauffmann, 2004). Note some ambiguity in the term “starburst”: some studies find “starbursts” while others find galaxies with “slightly elevated star-formation” compared to normal local spirals, while actually meaning similar kind of galaxies.
The peaks of the rest-frame SEDs are in the range 100 to 150 m. According to the ERR03 modelling the galaxies have cold dust temperatures in the range 15 to 20 K – these values refer to the dominant dust population, the fits are not fitted with a single dust species and temperature. Dust masses are quite uniformly . IRAS and Spitzer colours of the unambiguous sources, as calculated from the best-fit models are in the range -0.3 to -0.5, and -0.3 to -0.7, respectively. These values are typical to the infrared properties of the more quiescent FIR-selected galaxies, rather than active ones, in the nearby Universe (e.g. Dale et al., 2001; Sanders et al., 2003; Dale et al., 2005). Hence, the bright ISOPHOT galaxies in this field appear to be gas rich galaxies with clearly elevated star-formation at about the LIRG-class limit, but without evidence in our data for strong (nuclear) star-bursts. From optical data alone, e.g. with their quite uniform , our sample is indistinguishable from other local relatively high mass “blue-cloud” galaxies. As they are close to the red-sequence, it could be speculated that they are moving towards it, the effects of which can be seen in their IR and morphological properties.
The bright FIR selected sources in this survey and others tend to be (nearby) cold galaxies, whereas the local ULIRGs typically have warmer SEDs. However, at higher redshifts where LIRGs and ULIRGs start to dominate the energy budget of the Universe, Spitzer FIR selected galaxies in fact appear to have colder SEDs (Zheng et al., 2007; Symeonidis et al., 2009, e.g.), more similar to the majority of local FIR-bright galaxies rather than local ULIRGs. This makes detailed studies of the physical conditions in local FIR selected samples of IR-bright non-ULIRGs very motivating.
4.2 The nature of confused counterparts
Among the rest of our FIR targets, the faint sample, there are several cases where there either are optional counterparts, or strong reasons to suspect a blend of two or more bright galaxies. The (likely) properties of this set can be summarized as follows:
A blend of two or more spiral galaxies at redshifts is responsible for the ISOPHOT detection in 9 cases (NPG02, NGP05, NPG07, NGP11, NGP12, NGP14, NGP18, NGP23, NGP25). The photometric redshifts and GRASIL SED types of the individual counterparts are essentially identical to the unambiguous cases in Sections 3.2 and 4.1, though the optical colours show a slightly larger range than the unambiguous bright sample. Since we are not able to distribute the FIR flux to blended counterparts with spectroscopic redshifts, we will not attempt to model their physical characteristics in detail. However, we did run the ERR03 models on several cases where there e.g. were two spiral galaxies with reasonably secure photometric redshifts: the cirrus and starburst luminosities and dust characteristics and star-formation rates again come out to be very similar to the bright unambiguous set of FIR sources. They are often at slightly higher redshifts, but due to dividing the FIR fluxes to two or more sources, the and SFR values end up very similar. Thus, in total 14/22 or 64 per cent of the FIR sources in the ISOPHOT EBL project NGP fields are low-redshift moderately star-forming galaxies. The discussion presented in Section 4.1 above applies directly to all these sources, the majority detected in our survey.
Four other blended FIR sources (NGP06, NGP15, NGP16, NPG19) also include a contribution, possibly a major contribution, from a bright spiral or starburst. In these fields, however, we have also identified fainter red galaxies which might well be higher redshift (U)LIRGs also contributing the FIR flux.
4.3 Higher redshift counterparts
There are four fields (NGP04, NGP09, NGP10, NPG21), where the only likely counterpart appears to be a higher redshift, , (U)LIRG, or a sum of them. Higher redshift counterparts thus account for a minimum of 18 per cent of the FIR sources. Including ones where a higher- source is possibly blended with a lower- counterpart, up to a maximum of 36 per cent of our NGP targets include an IR-galaxy at .
4.4 Comparing to previous surveys and models
Overall we found 23 per cent of the NGP fields to have a uniquely identified target, while another 41 per cent are identified as blends of bright galaxies. In the various FIRBACK and Lockman Hole surveys, typically per cent of sources are identified (Dennefeld et al., 2005; Taylor et al., 2005; Oyabu et al., 2005; Rodighiero et al., 2005), and the rest remain unidentified. The fractions are similar to ours even though the methods of identification have been quite different: most of the above works considered only a bright sub-set, typically half, of their total source catalogs, and they all employed mid-IR and radio data in the identification which we have not done.
If the general fractions of identified and unidentified sources are similar to other works, what about the characteristics of the counterparts? We identified at least 64 per cent of all targets as fairly normal cool or cold IR luminous spiral galaxies at , regardless of confusion issues. If the cases of likely bright and faint galaxy blends are included, the fraction rises to 82 per cent. Similarly, the fraction of contributions from higher redshift (U)LIRG type galaxies is in between 18 and 36 per cent. It is important to note that these cases are not different in their FIR properties from the rest of the NGP ISOPHOT sources. Again, the results are very consistent with other surveys. In general, previous ISOPHOT FIR follow-up surveys have found a bi-modal distribution of a large, approximately three-quarters majority of low-redshift quiescent galaxies and a minority higher redshift ULIRGs at (e.g. Sajina et al., 2003; Patris et al., 2003; Taylor et al., 2005; Rodighiero et al., 2005; Dennefeld et al., 2005; Sajina et al., 2006). In the studies probing somewhat fainter flux levels of 100 mJy (e.g. Oyabu et al., 2005) than ours and FIRBACK’s 150 mJy, the fraction of sources at redshift higher than 0.3 starts to rise slightly. The dust temperatures we find are similar to Sajina et al. (e.g. 2006) and Patris et al. (2003) while Taylor et al. (2005) derive slightly higher temperatures in the range 20–40 K. Early results from the FIR surveys with AKARI also suggest large contributions from local galaxies (Matsuura et al., 2007; Malek et al., 2009).
Spitzer MIPS results also result in a broadly equivalent picture: the deeper MIPS sources at 70 m (down to 4 mJy) appear to be starbursts at =0.1–1.2 with a mean and median at (e.g. Symeonidis et al., 2008), while the 160 m sources (to 100 mJy) are mostly “starburst galaxies” at though generally not of the active, warm SED type of M82 and ARP 220, but with cooler SEDs (e.g. Frayer et al., 2006b; Wen et al., 2007).
We do identify a difference to previous follow-up surveys, however. Four out of five of our bright unambiguous counterparts, as well as more than half of the identifiable blended counterpart options are clearly disturbed or interacting galaxies. In contrast, Sajina et al. (e.g. 2006) found that their counterparts to ELAIS N1 survey do not show evidence of interactions, and also Oyabu et al. (2005) cite a small minority as interacting sources in the Lockman Hole survey. We are not sure what the reason for this difference is, unless it is just that our optical data is somewhat deeper than theirs making morphological classification easier.
The majority of the galaxy counterparts in “deep” FIR surveys discussed in this paper are in fact very similar to the large sample of much brighter galaxies at Jy detected as part of the ISOPHOT 170 m Serendipity Survey (Stickel, Klaas & Lemke, 2007).
4.5 Models
Previous FIR surveys have been described to a reasonable accuracy by models of e.g. Lagache et al. (2004) and recently by Rowan-Robinson (2009). The models have been specifically constructed to fit the source counts at various wavelengths, and also the level and spectral shape of CIRB. They are broadly consistent with the bimodal distribution of FIR sources described above. For example the 160 m Spitzer counts are dominated by “cirrus” galaxies brighter than 80 mJy, and by M82-type starbursts fainter than this limit according to the Rowan-Robinson (2009) models, and at 150 mJy, more or less at our survey limit, quiescent galaxies should outnumber starbursts by a factor of three, consistently with the nature of sources found in the NGP fields. However, a recent FIR/sub-mm follow-up of at the longer wavelengths of 250 and 500 m (Dye et al., 2009) find that these same bimodal models are a poor fit to the their data, as are also early AKARI counts of Matsuura et al. (2007), highlighting the fact that the exact nature of galaxies emitting their peak at 100 to 200 m, where the CIRB also peaks, remains of great importance.
4.6 Confusion at FIR wavelenghts
In our NGP-field follow-up most of the FIR sources, 17/22 or approximately 70 per cent, cannot be identified unambiguously with a single optical counterpart, though there clearly are different classes of ambiguity. Of these 17 ISOPHOT detections 9 are cases where the most likely counterpart of the FIR detection is a sum of two or more fairly bright ( mag) and nearby () star-forming galaxies, and in another four cases one such bright nearby spiral appears to be a component in the confused FIR source. Further four fields do not have any nearby galaxies in them, leaving the explanation for the FIR flux to either be a single higher redshift ULIRG type source, or a sum of several of these – there is no way to differentiate between these cases with the present data.
Thus, based on the present data, about 60 per cent of whole sample are definitely blended objects, with another 20 per cent possibly so. Similarly to our survey, Dennefeld et al. (2005) find 50 per cent of their identified sources multiple, and Sajina et al. (2006) note that up to 50 per cent of the FIRBACK sources are not ideally matched with a single counterpart.
4.6.1 Effect on source counts
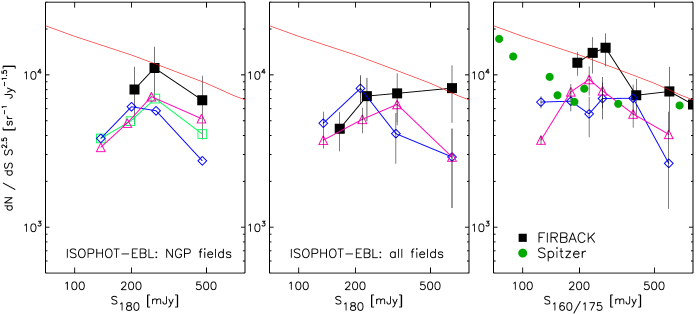
How does the blending and confusion affect interpretations of FIR populations? In addition to making identifications and SED fits of individual galaxies difficult and sometimes suspect, it also affects the FIR source counts themselves. As an example, Fig. 6 shows the raw 180 m source counts from our ISOPHOT EBL project (Juvela, Mattila & Lemke, 2000) as well as raw FIRBACK/ELAIS counts from Dole et al. (2001). The solid symbols are original points, whereas the open symbols show the effect of blending. In the left panel we plot the NGP counts, with the following modifications: green open squares are a case where the 9 objects definitely consisting of bright blends are divided into two discrete equal-flux sources; blue diamonds show a case where each detection in the faint sample is divided into two discrete sources of equal flux; and magenta triangles depict a case where each detection in the faint sample is divided into two sources where one has 2/3 and the other 1/3 of the flux.
To see the effect with somewhat larger number statistics, the second panel shows the counts from the whole ISOPHOT EBL survey. In this case we do not have the information on possible blending of each individual source, so we make a statistical estimate. The blue open diamonds, equivalently to the left panel, show the average of 10000 realizations of the original counts, where randomly selected 60 per cent of the FIR sources are replaced with two sources of half of the original flux each. The error bars reflect the standard deviation of the simulated counts. The triangles show the case where the random 60 per cent are divided into a 2/3 and a 1/3 flux source, as above. We remind the reader that there is no difference in the flux distribution of the blended and unique sources, justifying the selection of split sources from the whole population. Since FIRBACK/ELAIS surveys saw very similar fractions of non-unique counterparts (e.g. Dennefeld et al., 2005; Sajina et al., 2006), we ran the same test on the FIRBACK 175 m catalog, and the result is shown in the right panel of Fig. 6, where the symbols and colours are equivalent to the first two panels. In addition, we overplot the raw MIPS 160 m counts of Frayer et al. (2006b, 2009) with green circles. Only those points in the FIRBACK and MIPS counts which have completeness of 85 per cent and above are plotted.
Though the faintest plotted raw count bins are affected by incompleteness, it still is clear from Fig. 6 that the reshuffling of flux typically takes some 30 to 60 per cent of the abundant 100 to 400 mJy sources and shifts them into flux bins in between 50 and 200 mJy. The resulting differential counts move down broadly by a factor of , and steepen the faint end in the presented examples where 60 per cent of sources are affected . We ran the statistical blending correction with a variety of affected percentage of sources, and a range in the fractions and number of underlying sources corresponding to a FIR detection: e.g. when 30 per cent of sources are affected in a way that 1/5 of a source flux is given to a new faint source, the necessary downward correction of counts is still approximately a factor of . Where splitting is more even the correction is larger, and rises to factors of few if three or more underlying sources are concerned. Only if the affected source population is below 20 per cent, are the required corrections negligible compared to the errors of the observed counts.
Interestingly, the MIPS counts fall closer to the blending-corrected ISOPHOT counts and are not compatible with the uncorrected ones. The explanation is in the confusion levels. There are two kinds of “confusion”: one due to fluctuations of all the unresolved sources below the detection limit and the other due to the effective beam size not resolving properly sources too close to each other. One can talk about confusion “noise” in the first case, and e.g. “blending” in the second case, and of the respective confusion limits as a “photometric confusion limit” and a “source density criterion” often given in terms of beams per source in the latter case. Both effects are non-trivial as they obviously depend on the shape of the source count slope both above and below the confusion limits and other factors (see e.g. Väisänen et al., 2001; Dole et al., 2003; Takeuchi & Ishii, 2004, and references therein). For the cases here, the MIPS 160 m beam of ″ is smaller than the respective C200 ISOPHOT beam of ″ size, and assuming a Euclidean slope this means that the confusion “noise” is expected to be 3 times higher for ISOPHOT, and even more for steeper counts. Indeed, for a set of source counts Dole et al. (2003) and Jeong et al. (2006) estimate the confusion “noise” limits to be in the region of 50 and 160 mJy for MIPS 160 m and ISOPHOT 180 m, respectively. These values correspond roughly to or more beams per source, which is a limit one should use with steep counts (Väisänen et al., 2001). Hence, the ISOPHOT counts we are considering clearly reach right to the level of expected confusion, whereas only the two deepest Frayer et al. (2009) points at mJy in the Fig. 6 approach the MIPS confusion limit.
An added complication in confusion estimates is clustering of sources which increases the confusion limits with an increasing severity as the source counts get steeper – Takeuchi & Ishii (2004) show how the effect can be factors of a few or more for super-Euclidean slopes. An attempt to estimate the effect quantitatively is beyond the scope of this paper, but as we have clearly seen, we often detect close pairs or groups of likely counterparts within the FIR beam size, so the confusion limits cited above are likely lower limits. It thus should come as no surprise that the ISOPHOT FIR galaxy counts, both ours and others in the literature, have been significantly affected by confusion, as probably are the very deepest MIPS FIR counts. One should also be aware that any upward bumps in source count slopes when approaching the confusion regime, are likely due to confusion noise effects (Väisänen et al., 2001, e.g.) and not real sources, especially in the case of super-Euclidean counts such as these.
In summary, the effects of confusion and blending on source counts, their likely too high normalization and differences in slopes, must be properly taken into account when modelling the count slopes with galaxy populations. Luminosity functions based on FIR counts will be affected as well.
5 Summary
We have presented follow-up observations in the NGP fields of the ISOPHOT EBL Project. This FIR survey complemented the other major FIR projects of ELAIS, FIRBACK and Lockman Hole, by detecting sources in three bands, and also by being able to determine the absolute level of the CIRB (Juvela et al., 2009).
The NGP fields consist of 1.64 sq.deg area and 25 unique FIR sources in the 90 m band and 22 in the 150 and 180 m. We imaged these fields with the NOT in the optical and NIR, and employed SED fitting techniques as well as morphological analysis to determine the counterparts of the FIR sources in the 1′ radius ISOPHOT error circles.
Only five sources were securely identified with a single bright nearby galaxy. One of these is a local dwarf galaxy, but all the others are IR-luminous , fairly massive 0.3-1.0 star-forming spirals at redshifts of . Their star-formation rates range from 7 to 26 , dust temperatures are K and dust masses . Such cold and fairly local galaxies have been found before in and FIR surveys selected in the 100-200 m range. We note in addition that in our data most of these appear to have disturbed morphologies showing signs of present or past interactions .
Nine more FIR targets were securely identified with multiple galaxies. It turns out, however, that these cases have essentially identical physical characteristics with the first single-galaxy counterpart group, with the slight difference that their redshift range extends to . Thus 2/3 of our FIR galaxies are definitely relatively normal IR-luminous cold star-forming galaxies at .
Half of the remaining cases, nearly 20 per cent of the total, also have a bright star-forming galaxy in the field, but to be explained the FIR flux needs additional contribution from an optically fainter galaxy. Finally, the second half of the remaining cases have only fainter galaxies in the area. In all these cases we were able to find two or three good candidates for LIRGs or ULIRGS in the range , which could explain the FIR flux. Without further spectroscopy the exact identification remains ambiguous however.
Given the large number of blends, we tested the often ignored aspect of how the confused sources affect the FIR source counts themselves. By using both our results and those from previous surveys, we showed that significant reshuffling of FIR fluxes is very likely to happen: a large fraction of apparent FIR sources at the 200-500 mJy range are in fact bound to be double or triple sources each with fluxes in the range 50-300 mJy. This has the effect of both decreasing the normalization of the FIR counts by a factor of and also steepening the count slope somewhat, especially at the faint end. This has to be taken into account when modelling FIR source counts.
Finally, many of the NGP ISOPHOT FIR sources appear to be part of significant galaxy concentrations, pairs, groups or perhaps even clusters. What this tells about the FIR sources and the reasons why they are IR-luminous, will be investigated in more detail in another paper.
Acknowledgments
We thank the referee for valuable comments which improved the paper. JKK acknowledges financial support from the Academy of Finland (project 8121122) and MJ acknowledges the support of the Academy of Finland grants no. 105623, 124620, and 115056. This work is based on observations made with the Nordic Optical Telescope, operated on the island of La Palma jointly by Denmark, Finland, Iceland, Norway, and Sweden, in the Spanish Observatorio del Roque de los Muchachos of the Instituto de Astrofisica de Canarias and on observations with the Infrared Space Observatory ISO. ISO is an ESA project with instruments funded by ESA member states (especially the PI countries France, Germany, The Netherlands, and the UK) and with participation of ISAS and NASA. This work has made use of the SDSS, 2MASS and NED archives. Funding for the SDSS and SDSS-II has been provided by the Alfred P. Sloan Foundation and other Participating Institutions. The Two Micron All Sky Survey, is a joint project of the University of Massachusetts and the Infrared Processing and Analysis Center/California Institute of Technology, funded by the National Aeronautics and Space Administration and the National Science Foundation. The NASA/IPAC Extragalactic Database (NED) is operated by the Jet Propulsion Laboratory, California Institute of Technology, under contract with the National Aeronautics and Space Administration.
References
- Abazajian et al. (2009) Abazajian K. et al., 2009, ApJS, 182, 543
- Bell & De Jong (2001) Bell E.F., De Jong R.S., 2001, ApJ, 550, 212
- Bertin & Arnouts (1996) Bertin E., Arnouts S., 1996, A&AS, 117, 393
- Bolzonella et al. (2000) Bolzonella M., Miralles J.-M., Pelló R., 2000, A&A 363, 476
- Bruzual & Charlot (1993) Bruzual G., Charlot S., 1993, ApJ, 405, 538
- Cole et al. (2001) Cole S., et al., 2001, MNRAS, 326, 255
- Dale et al. (2001) Dale D.A., Helou G., Contursi A., Silbermann N.A., Kolhatkar S., 2001, ApJ, 549, 215
- Dale et al. (2005) Dale D., et al., 2005, ApJ, 633, 857
- Dennefeld et al. (2005) Dennefeld M., et al., 2005, A&A, 440, 5
- Devlin et al. (2009) Devlin M., et al., 2009, Nature, 458, 737
- Dole et al. (2001) Dole H., et al., 2001, A&A 372, 364
- Dole et al. (2003) Dole H., Lagache, G., Puget J.-L., 2003, ApJ 585, 617
- Dole et al. (2006) Dole H., et al., 2006, A&A 451, 417
- Dye et al. (2009) Dye S., et a., 2009, ApJ, 703, 285
- Efstathiou & Rowan-Robinson (2003) Efstathiou A., Rowan-Robinson M., 2003, MNRAS, 343, 322 (ERR03)
- Efstathiou et al. (2000) Efstathiou A., Rowan-Robinson M., Siebenmorgen R., 2000, MNRAS, 313, 734
- Elbaz et al. (2002) Elbaz D. et al., 2002, A&A 384, 848
- Farrah et al. (2003) Farrah D., Afonso J., Efstathiou A., Rowan-Robinson M., Fox M., Clements D., 2003, MNRAS, 343, 585
- Fernandez-Conde et al. (2008) Fernandez-Conde, N., Lagache, G., Puget, J.-L., Dole, H., A&A, 481, 885
- Fixsen et al. (1998) Fixsen D.J., Dwek E., Mather J.C., Bennett C.L., Shafer R.A., 1998, ApJ, 508, 123
- Frayer et al. (2006a) Frayer D.T. et al. 2006a, ApJ, 647, L9
- Frayer et al. (2006b) Frayer D.T. et al. 2006b, AJ, 131, 250
- Frayer et al. (2009) Frayer D.T. et al. 2009, AJ, 138, 1261
- Gil de Paz et al. (2000) Gil de Paz A., Aragón-Salamanca A., Gallego J., Alonso-Herrero A., Zamorano J., Kauffmann G., 2000, MNRAS, 316, 357
- Hauser et al. (1998) Hauser M.G. et al., 1998, ApJ 508, 25
- Hauser & Dwek (2001) Hauser M.G., Dwek E., 2001, ARAA 39, 249
- Jeong et al. (2006) Jeong W.-S., Pearson, C.P., Lee H.M., Pak S., Nakagawa T., 2006, MNRAS, 369, 281
- Juvela, Mattila & Lemke (2000) Juvela M., Mattila K., Lemke D., 2000, A&A 360, 813
- Juvela et al. (2009) Juvela M., Mattila K., Lemke D., Klaas U., Leinert C., Kiss Cs., 2009, A&A, 500, 763
- Kauffmann (2004) Kauffmann, G., et al., 2004, MNRAS, 353, 713
- Kennicutt (1998) Kennicutt R.C., 1998, ARA&A, 36, 189
- Lagache et al. (2004) Lagache G., et al., 2004, ApJS 154, 112
- Lagache, Puget & Dole (2005) Lagache G., Puget J.-L., Dole H., 2005, ARA&A 43, 727
- Malek et al. (2009) Malek K., et al., 2009, in proceedings “AKARI, a light to illuminate the misty Universe”, February 16-19 2009, Tokyo”, arXiv:0903.3987
- Mann et al. (2002) Mann R.G., et al., 2002, MNRAS, 332, 549
- Matsuura et al. (2007) Matsuura S., et al., 2007, PASJ, 59, S503
- Oyabu et al. (2005) Oyabu S., et al., 2005, AJ, 130, 2019
- Papovich et al. (2004) Papovich C., et al., 2004, ApJS, 154, 70
- Papovich et al. (2007) Papovich C., et al., 2007, ApJ, 668, 45
- Patris et al. (2003) Patris J., Dennefeld M., Lagache G., Dole H., 2003, A&A 412, 349
- Peng et al. (2002) Peng, C.Y., Ho L.C., Impey C.D., Rix H.-W., 2002, AJ, 124, 266
- Pilbratt (2008) Pilbratt G.L. 2008, SPIE, 7010, 1
- Puget et al. (1996) Puget J.-L. et al., 1996, A&A 308, L5
- Rodighiero et al. (2005) Rodighiero G., Fadda D., Franceschini A., Lari C., 2005, MNRAS, 357, 449
- Rodighiero et al. (2006) Rodighiero G., et al., 2006, MNRAS, 371, 1891
- Rowan-Robinson (2009) Rowan-Robinson M., 2009, MNRAS, 394, 117
- Silva et al. (1998) Silva L., et al., 1998, ApJ, 509, 103
- Sajina et al. (2003) Sajina A., et al., 2003, MNRAS, 343, 1365
- Sajina et al. (2006) Sajina A., Scott D., Dennefeld M., Dole H., Lacy M., Lagache G., 2006, MNRAS, 396, 939
- Sanders et al. (2003) Sanders D.B., Mazzarella J.M., Kim D.-C., Surace J.A., Soifer B.T., 2003, AJ, 126, 1607
- Siebenmorgen & Krügel (1992) Siebenmorgen R., Krügel E., 1992, A&A, 259, 614
- Soifer, Helou & Werner (2008) Soifer B.T., Helou G., Werner M., 2008, ARA&A 46, 201
- Stickel, Klaas & Lemke (2007) Stickel M., Klaas U., Lemke D., 2007, A&A, 466, 831
- Symeonidis et al. (2008) Symeonidis M., Willner S.P., Rigopoulou D., Huang J.-S., Fazio G.G., Jarvis M.J., 2008, MNRAS, 385, 1015
- Symeonidis et al. (2009) Symeonidis M., 2009, MNRAS, 397, 1728
- Takeuchi & Ishii (2004) Takeuchi T.T., Ishii T.T., 2004, ApJ, 604, 40
- Taylor et al. (2005) Taylor E.L., et al. 2005, MNRAS, 361, 1352
- Väisänen et al. (2000) Väisänen P., Tollestrup E.V., Willner S.P., Cohen M., 2000, ApJ, 540, 593
- Väisänen et al. (2001) Väisänen P., Tollestrup E.V., Fazio G.G., 2001, MNRAS, 325, 1241
- Wen et al. (2007) Wen X.-Q, Wu H., Cao C., Xia X.-Y., 2007, ChJAA, 7, 187
- Zheng et al. (2007) Zheng X.Z., et al., 2007, ApJ, 670, 301
Appendix A Discussion of individual ISOPHOT fields
A.1 Bright unambiguous galaxies
NGP01 The bright (=16.59, =13.77) counterpart is identified as 2MASSXJ13412738+4042166 with a redshift of . The optical data show a disk dominated galaxy with wide arms, typical to late spirals, bar structure identified with GALFIT and a somewhat disturbed morphology at the southern edge, typical to e.g. merger remnants. HYPERZ fits perfectly a fully evolved (nominally 15 Gyr old) GRASIL Sc template, the ERR03 models fit a cirrus-dominated SED, while the SDSS spectrum shows strong H emission. The FIR points alone – detections at 150 and 170 m, but only an upper limit at 90 m – suggest a strong cool cirrus component. We also note that there is another bright star-forming galaxy at exactly the same redshift just outside the FIR detection circle, 2.5 arcmin (or 250 kpc projected distance) away from the adopted counterpart.
NGP03 The bright (=17.12, =14.20) counterpart is identified as 2MASSXJ13422216+4022017 at . It has two or three fainter galaxies clearly in close interaction. GALFIT modelling shows a large bulge-dominated disk of 6.9 kpc scale length with wide spiral arms and the subtraction of bulge and disk components reveals a ring-like structure extending towards two of the companions, and possibly bar-like structure at the nucleus. Again, the SDSS spectrum shows strong star formation. The FIR SED is now warmer (detected at 90 m but not at 180 m) and our best fitting SED template is, indeed, that of a prototype interacting starburst galaxy NGC 6090, further corroborating its starburst nature. Note that this template has more power in the cooler FIR range than an M82 SED would have. The ERR03 model is similar to NGP01.
NGP20 The bright (=17.75, =14.80) galaxy in the detection circle has no SDSS spectra, but it does have a strong HYPERZ fit ( at ) with a fully evolved Sc template, consistent with the ERR03 fit as well. It has an undisturbed disk and a small but bright bulge in the optical. There is another bright galaxy of early type just outside the field 1.1 arcmin away (2MASX J13494050+3907555) which has a known redshift of making the photometric redshift of the first galaxy, the adopted counterpart, very plausible.
NGP22 The only bright galaxy (=17.70, =14.52) in the vicinity is the edge-on disk galaxy SDSSJ135054.71+385847.2 at a redshift of . The disk is somewhat warped, though there are no obvious major partners nearby. The SDSS spectrum shows , though not much else, and the overall SED fits reasonably the evolved Sc template at that redshift, though the optical/NIR SED would be better fit with an M82 template. This galaxy is 2-3 times less massive than the previous four objects, and the SFR predicted by both GRASIL and ERR03 is also smaller, but still a little higher than ordinary quiescent galaxies. ERR03 again fits a cirrus dominated galaxy.
NGP24 The counterpart galaxy of this FIR source is the most nearby galaxy in our sample, UGC 08793 at a redshift of and it extends over 1.5′ on the sky. Its IR luminosity is more than 2 orders of magnitude less than the other bright sample galaxies above. The SDSS spectrum of the center shows a typical late type spiral spectrum, NED classifies it as Sd, and our overall SED shape is well fit with a template of local Scd dwarf galaxy NGC 6946. This is the only case where ERR03 suggests a pure cirrus spectrum. It has numerous bright HII regions, several small satellite galaxies, or giant HII regions, and the disk appears slightly warped.
A.2 Confused fields
NGP02: There is a significant concentration of mag galaxies within and just outside the ISOPHOT area – there are four galaxies with mag and a further four with mag. None have spectroscopy available and none of the galaxies within the detection circle produce satisfactory SED fits when ISOPHOT data is included. However, the four brightest galaxies all have optical/NIR photometric redshifts of , along with further three fainter ones. They include a tidally disrupted interacting pair, two Sb-type SEDs, as well as two bright early type galaxies. A combination of two or three of the disk galaxies at this redshift is well able to produce the required FIR flux. An exact identification of NGP02 is thus ambiguous, though a mixed origin is very likely.
NGP04: There are no bright (, ) galaxies in this field. The FIR detection is 130″ away from an X-ray detected galaxy cluster RX J1342.8+4028 at . The HYPERZ fits to SDSS and RIK data find a large concentration of galaxies in the ISOPHOT area, which most likely belong to the cluster. Specifically, there are three red galaxies within the detection circle which fit quite well an Arp 220 SED at those redshifts – and the fits are even better if the FIR is a sum of two of them. Two of these sources, including the brightest object in the field, are clearly disturbed objects. A sum of faint galaxies is thus the likeliest counterpart for the ISOPHOT detection.
NGP05: The brightest galaxy is a morphologically disturbed barred late type spiral; there are no spectra available. The galaxy fits reasonably an evolved Sc template at , though it would need times more FIR flux to fit well the FIR points. Other galaxies may thus contribute to the FIR flux; and indeed there are 2 other galaxies ( mag) with photometric redshifts at , best-fit SEDs (when fit is done excluding the ISOPHOT points) of early and late type spirals and disk morphologies. A confused counterpart is thus likely.
NGP06: The brightest galaxy is 2MASSX J13430669+4014314 with an SDSS redshift of . Both the optical spectrum and optical/NIR SED indicate an Sb-type, but the SED including all three FIR points does not fit well any of our templates at that redshift – the NGP 6090 template gives a reasonable fit at the error levels of the FIR fluxes, but the optical spectrum is not that of a starburst. It is possible that the FIR detection come from some combination of a warm (contributing to the 90 m band) and a cold object (the 180 m flux). There are also two fainter interacting pairs in the detection circle which both would reasonably fit an Arp 220 template at , contributing to the 90 and 150 m fluxes in that case. The identification thus remains ambiguous.
NGP07: Juvela, Mattila & Lemke (2000) list this object with two positions in the 90 m catalogue (NGP 07 and 08, separated by 20 arcsec) and a single detection in 150 and 180 m, suggesting a complex origin for the FIR flux. There are 4 fairly bright galaxies in the area, though only one mag. By far the brightest appears to be an early-type spiral or lenticular while the three others are also all early type disks. None of these alone fit the SED templates over all the wavelength range. A confused FIR source, in between based on photometric redshifts, is highly probable.
NGP09: The two brightest galaxies in the region, only one is mag, are disk galaxies, but we cannot fit well either of them and the FIR flux is too strong to be associated even with their sum. There are, however, several very red galaxies giving acceptable fits to ULIRG templates in a wide redshift range of . We also note that this is one of three sources in the sample of 22 NGP FIR targets which do not have quality flag values of in any FIR band.
NGP10: There are no galaxies brighter than mag in the field and no object provides an acceptable HYPERZ fit. There are, however, half a dozen galaxies redder than in the area including two EROs, which could contribute in combinations at where their optical/NIR photometric redshifts place them.
NGP11: No single galaxy fits well the template SEDs, though there are two disk galaxies in the field, the sum of which can explain the FIR points if both are Sc-types at their photometric redshift of . They belong to an apparent concentration of galaxies partially inside the ISOPHOT area. We find, however, another fainter red disturbed galaxy which could contribute as a higher redshift ULIRG.
NGP12: Four galaxies, all mag or brighter, produce excellent exponential profiles with GALFIT and good optical/NIR SED fits to spiral or starburst templates in the range . One, or even two, of them appear to be interacting with another galaxy. However, none of them fit our full SED templates alone, though a sum of them could explain the required FIR flux. To complicate matters, there are four fainter red galaxies in the field, any of which fit reasonably well a full ULIRG template in the range . The very ambiguous aspect of this source is highlighted by the fact that Juvela, Mattila & Lemke (2000) list this target as two objects (NGP 12 and 13) separated by 23″ in the 90 m catalogue, while there is only one detection in the 150 m list.
NGP14 There are two bright nearby spirals in the area. The brighter one (=17.32, =14.19) is 2MASSX J13473443+3931515, with an SDSS redshift of . The optical spectrum looks to be of a typical star-forming galaxy, and the GRASIL interacting starburst NGC 6090 template gives a perfect match to the overall SED. The optical image reveals a disk galaxy with a large asymmetric arm. This case would fall into the bright unambiguous class were it not for the second spiral (=15.22) which also fits very well our templates, an evolved Sc-galaxy at a photometric . Both galaxies must contribute to the FIR flux.
NGP15: This is one of the most ambiguous cases. There is a tight group of 5–7 galaxies (all fainter than mag), including two interacting pairs, 25″ from the FIR location. Two or three of these galaxies together would fit reasonably the FIR points with starburst templates at . Additionally, however, there are three very red sources elsewhere inside the FIR area. If their elliptical-like optical/NIR colours are combined with the FIR flux, they fit well ULIRG templates at . And, in fact, these sources belong to a distribution of the largest concentration of EROs found in this follow-up survey, mostly lying just outside the ISO detection circle. NGP15 is one of the three sources with lower quality flag values of .
NGP16: There are two separate 90 m detections just 22″ from each other (NGP16 and NGP17), that are connected with a single detection at longer wavelengths. A significant concentration of galaxies is seen in the area. There are two disk galaxies in the center of the area, with early type spirals as best-fit SEDs at photometric redshifts of , but even a sum of these would not yet explain the FIR fluxes. Intriguingly, there are also three individual fainter and red () galaxies in the detection area which each give a good fit to starburst or Arp 220 SEDs at redshifts ranging . One of these is a clear interacting galaxy. and another a FIRST radio source whose radio flux is consistent with the fitted Arp 220 SED. Any one of these could be the true counterpart, unless it is not the confused sum of the brighter galaxies, or a combination of all. This is a highly ambiguous case.
NGP18: This field is within a galaxy cluster ZwCl 1346.9+3931. Three bright disturbed spirals are found in the ISOPHOT area, and several more just outside, all with spectroscopic SDSS redshifts of . The brightest (=17.02, =14.19) of the spirals, 2MASX J13490845+3917219, is a star forming galaxy with Seyfert-like emission lines, and the overall SED actually fits well an evolved Sc template. On the other hand, since the other spirals in the area must also contribute to the FIR flux (optical/NIR SEDs are fit with normal spiral and even starburst SEDs), we chose to include NGP18 in the confused sample, rather than the bright unambiguous sample. It is clear though that the FIR counterpart(s) lies at the redshift of .
NGP19: The ISOPHOT circle does not have very bright galaxies, though there are many at both sides of mag. The 90 m flux is the strongest of the whole sample, making this our only source with a clearly declining SED longwards of 100 m. Morphologically, according to GALFIT, two of the brighter ones are face-on disks with stellar-PSF and/or strong bulge components. Both fit well an Arp 220 template at , though without spectra it is impossible to speculate more about starbursts or obscured AGN, or to decide between them. Contributions from other galaxies cannot be ruled out either: the second brightest galaxy in the field is a warped interacting disk galaxy, it does not fit any template by itself, and there are three fainter very red galaxies in the area giving reasonable fits to ULIRG or ERO templates in redshift ranges of .
NGP21: There are no galaxies brighter than (the bright object seen in Fig. 3 is a star), and none of the sources give good SED fits. The brightest source is a disk galaxy, but no template fits the FIR points. There are also three very faint EROs in the field which could conceivably contribute if they have ULIRG type SEDs, though none of them alone. This FIR source is the third ISO target with a lower quality flag value of .
NGP23: This field again holds a significant concentration of bright galaxies. The brightest (=16.73, =13.60) galaxy has the GALFIT profile of an elliptical or strongly bulge dominated disk galaxy and it fits reasonably an overall Sb-type SED. The two next brightest galaxies have SDSS spectra () showing star formation, and they are disks, as are two other bright galaxies, all with optical/NIR spectral shapes consistent with spirals. Most of these galaxies must contribute toward the total FIR flux, and the identification thus remains ambiguous.
NGP25: This case is somewhat ambiguous though there is a single bright galaxy (=16.65, =13.61) in the ISOPHOT area: it appears to be an early type galaxy (Sa template fits the optical/NIR SED), with some evidence of structure beneath a GALFIT de Vaucoulers profile. It does not have a spectrum, but there is a galaxy of the same size and brightness 47″away to the NE just outside the detection circle. Its SDSS redshift is and it has a clear disk-like GALFIT profile, and the best fit SED is an Sb-type. Contributions from (at least) both of these galaxies would be needed, however, to explain the FIR flux. An Sc-type SED could fit the overall SED alone but the morphology of neither galaxy favours this option.
| RA | DEC | m | m | m | redshift | |||||||||
|---|---|---|---|---|---|---|---|---|---|---|---|---|---|---|
| NGP01 | 13h41m27.4s | 18.800.07 | 17.460.02 | 16.800.03 | 16.590.01 | 16.410.02 | 16.030.01 | 16.240.10 | 13.740.01 | 0.088 | ||||
| NGP03 | 13h42m22.2s | 19.440.09 | 18.110.01 | 17.340.01 | 17.100.01 | 16.930.01 | 16.470.01 | 16.690.03 | 14.170.01 | 17050 | 0.131 | |||
| NGP20 | 13h49m34.9s | 20.090.14 | 18.700.02 | 17.930.01 | 17.750.01 | 17.530.02 | 17.130.01 | 17.280.02 | 14.770.01 | 0.14 | ||||
| NGP22 | 13h50m54.7s | 19.840.18 | 18.600.04 | 17.840.02 | 17.700.01 | 17.450.02 | 17.060.01 | 17.250.08 | 14.490.01 | 0.086 | ||||
| NGP24 | 13h52m35.0s | – | – | – | 18.110.01 | – | 18.040.02 | – | 15.320.05 | 0.008 |
| N | RA | DEC | e | e | e | e | e | e | e | e | e | e | e | e | IP | ||||||||||||
|---|---|---|---|---|---|---|---|---|---|---|---|---|---|---|---|---|---|---|---|---|---|---|---|---|---|---|---|
| 1 | 347 | 205.340103 | 40.733978 | 0.77 | 22.84 | 22.85 | 23.09 | 22.93 | 0.06 | 0.06 | 0.13 | 0.11 | 0.00 | 0.00 | 0.00 | 0.00 | 23.98 | 24.20 | 22.62 | 22.26 | 21.39 | 0.93 | 0.40 | 0.17 | 0.20 | 0.48 | 0 |
| 1 | 348 | 205.340302 | 40.722130 | 0.37 | 24.95 | 24.87 | 25.69 | 24.67 | 0.22 | 0.36 | 0.74 | 0.53 | 0.00 | 0.00 | 0.00 | 0.00 | 0.00 | 0.00 | 0.00 | 0.00 | 0.00 | 0.00 | 0.00 | 0.00 | 0.00 | 0.00 | 0 |
| 1 | 349 | 205.340500 | 40.694592 | 0.41 | 23.33 | 23.35 | 22.26 | 22.30 | 0.10 | 0.09 | 0.07 | 0.06 | 0.00 | 0.00 | 0.00 | 0.00 | 0.00 | 0.00 | 0.00 | 0.00 | 0.00 | 0.00 | 0.00 | 0.00 | 0.00 | 0.00 | 1 |
| 1 | 350 | 205.340698 | 40.700760 | 0.75 | 23.50 | 23.50 | 22.15 | 22.11 | 0.10 | 0.10 | 0.05 | 0.05 | 18.80 | 18.91 | 0.13 | 0.19 | 0.00 | 0.00 | 0.00 | 0.00 | 0.00 | 0.00 | 0.00 | 0.00 | 0.00 | 0.00 | 1 |
| 1 | 351 | 205.340805 | 40.696388 | 0.03 | 19.47 | 19.96 | 19.09 | 19.55 | 0.01 | 0.01 | 0.01 | 0.01 | 17.32 | 17.64 | 0.09 | 0.06 | 20.49 | 20.01 | 19.55 | 19.66 | 19.66 | 0.15 | 0.03 | 0.03 | 0.07 | 0.33 | 1 |
| 1 | 352 | 205.340805 | 40.739101 | 0.01 | 20.31 | 21.51 | 19.87 | 21.08 | 0.03 | 0.02 | 0.03 | 0.02 | 0.00 | 0.00 | 0.00 | 0.00 | 24.04 | 21.36 | 20.78 | 20.61 | 20.87 | 1.67 | 0.07 | 0.06 | 0.09 | 0.59 | 0 |
| 1 | 353 | 205.341095 | 40.697529 | 0.16 | 22.15 | 22.76 | 21.47 | 21.92 | 0.07 | 0.05 | 0.06 | 0.04 | 19.18 | 19.33 | 0.26 | 0.28 | 24.13 | 23.66 | 23.37 | 22.14 | 22.53 | 0.98 | 0.28 | 0.31 | 0.19 | 0.94 | 1 |
| 1 | 354 | 205.341797 | 40.660759 | 0.65 | 22.48 | 23.20 | 22.56 | 23.18 | 0.07 | 0.07 | 0.13 | 0.11 | 0.00 | 0.00 | 0.00 | 0.00 | 0.00 | 0.00 | 0.00 | 0.00 | 0.00 | 0.00 | 0.00 | 0.00 | 0.00 | 0.00 | 0 |
| 1 | 355 | 205.341995 | 40.667881 | 0.03 | 19.70 | 20.12 | 18.96 | 19.32 | 0.01 | 0.01 | 0.01 | 0.00 | 16.01 | 16.25 | 0.03 | 0.02 | 21.70 | 21.18 | 19.97 | 19.40 | 19.23 | 0.44 | 0.11 | 0.06 | 0.05 | 0.17 | 0 |
| 1 | 356 | 205.341995 | 40.683739 | 0.01 | 22.11 | 22.43 | 21.25 | 21.51 | 0.05 | 0.04 | 0.04 | 0.03 | 18.64 | 18.98 | 0.22 | 0.20 | 24.14 | 22.91 | 21.87 | 21.69 | 20.83 | 1.72 | 0.26 | 0.16 | 0.23 | 0.56 | 1 |
| 1 | 357 | 205.342407 | 40.657299 | 0.44 | 23.54 | 23.68 | 23.40 | 23.71 | 0.13 | 0.13 | 0.20 | 0.23 | 0.00 | 0.00 | 0.00 | 0.00 | 0.00 | 0.00 | 0.00 | 0.00 | 0.00 | 0.00 | 0.00 | 0.00 | 0.00 | 0.00 | 0 |
| 1 | 358 | 205.342499 | 40.680012 | 0.51 | 24.56 | 24.47 | 23.58 | 23.67 | 0.21 | 0.25 | 0.15 | 0.21 | 0.00 | 0.00 | 0.00 | 0.00 | 0.00 | 0.00 | 0.00 | 0.00 | 0.00 | 0.00 | 0.00 | 0.00 | 0.00 | 0.00 | 0 |
| 1 | 359 | 205.342896 | 40.730228 | 0.04 | 19.24 | 19.66 | 18.55 | 18.91 | 0.01 | 0.00 | 0.00 | 0.00 | 15.69 | 15.99 | 0.02 | 0.01 | 26.06 | 20.85 | 19.41 | 18.93 | 18.43 | 1.61 | 0.07 | 0.03 | 0.03 | 0.11 | 0 |
| 1 | 360 | 205.342896 | 40.728432 | 0.38 | 24.33 | 24.19 | 23.70 | 23.53 | 0.23 | 0.20 | 0.22 | 0.19 | 0.00 | 0.00 | 0.00 | 0.00 | 0.00 | 0.00 | 0.00 | 0.00 | 0.00 | 0.00 | 0.00 | 0.00 | 0.00 | 0.00 | 0 |
| 1 | 361 | 205.343002 | 40.744381 | 0.55 | 21.68 | 23.20 | 21.30 | 22.50 | 0.06 | 0.09 | 0.08 | 0.08 | 0.00 | 0.00 | 0.00 | 0.00 | 22.35 | 20.94 | 20.60 | 20.87 | 21.06 | 1.58 | 0.15 | 0.17 | 0.38 | 2.29 | 0 |
| 1 | 362 | 205.343307 | 40.661411 | 0.03 | 18.21 | 18.77 | 17.55 | 18.06 | 0.00 | 0.00 | 0.00 | 0.00 | 0.00 | 0.00 | 0.00 | 0.00 | 20.78 | 19.37 | 18.37 | 17.90 | 17.71 | 0.22 | 0.02 | 0.02 | 0.02 | 0.05 | 0 |
| 1 | 363 | 205.343399 | 40.666248 | 0.36 | 23.06 | 23.12 | 22.42 | 22.48 | 0.08 | 0.07 | 0.08 | 0.07 | 0.00 | 0.00 | 0.00 | 0.00 | 0.00 | 0.00 | 0.00 | 0.00 | 0.00 | 0.00 | 0.00 | 0.00 | 0.00 | 0.00 | 0 |
| 1 | 364 | 205.343399 | 40.688320 | 0.42 | 24.91 | 24.69 | 24.61 | 24.39 | 0.28 | 0.30 | 0.37 | 0.40 | 0.00 | 0.00 | 0.00 | 0.00 | 0.00 | 0.00 | 0.00 | 0.00 | 0.00 | 0.00 | 0.00 | 0.00 | 0.00 | 0.00 | 1 |
| 1 | 365 | 205.343597 | 40.724831 | 0.04 | 22.02 | 22.20 | 21.06 | 21.23 | 0.04 | 0.03 | 0.03 | 0.02 | 17.90 | 17.86 | 0.07 | 0.07 | 22.69 | 22.98 | 22.34 | 21.42 | 21.30 | 0.40 | 0.17 | 0.15 | 0.11 | 0.50 | 0 |
| 1 | 366 | 205.343800 | 40.712950 | 0.00 | 0.00 | 0.00 | 0.00 | 0.00 | 0.00 | 0.00 | 0.00 | 0.00 | 19.48 | 19.68 | 0.34 | 0.37 | 0.00 | 0.00 | 0.00 | 0.00 | 0.00 | 0.00 | 0.00 | 0.00 | 0.00 | 0.00 | 1 |
| 1 | 367 | 205.343903 | 40.697868 | 0.03 | 19.24 | 19.67 | 18.61 | 18.98 | 0.01 | 0.00 | 0.00 | 0.00 | 16.10 | 16.28 | 0.02 | 0.02 | 21.16 | 20.28 | 19.38 | 19.01 | 18.71 | 0.27 | 0.04 | 0.03 | 0.03 | 0.13 | 1 |
| 1 | 368 | 205.343994 | 40.654282 | 0.38 | 24.00 | 24.07 | 23.81 | 23.79 | 0.22 | 0.19 | 0.31 | 0.25 | 0.00 | 0.00 | 0.00 | 0.00 | 0.00 | 0.00 | 0.00 | 0.00 | 0.00 | 0.00 | 0.00 | 0.00 | 0.00 | 0.00 | 0 |
| 1 | 369 | 205.343994 | 40.729069 | 0.44 | 23.64 | 23.91 | 23.41 | 23.62 | 0.15 | 0.15 | 0.21 | 0.20 | 0.00 | 0.00 | 0.00 | 0.00 | 0.00 | 0.00 | 0.00 | 0.00 | 0.00 | 0.00 | 0.00 | 0.00 | 0.00 | 0.00 | 0 |
| 1 | 370 | 205.344498 | 40.696041 | 0.94 | 22.70 | 22.65 | 22.16 | 22.11 | 0.05 | 0.05 | 0.05 | 0.05 | 0.00 | 0.00 | 0.00 | 0.00 | 24.27 | 23.33 | 22.29 | 22.05 | 22.25 | 0.87 | 0.19 | 0.11 | 0.14 | 0.72 | 1 |
| 1 | 371 | 205.344604 | 40.659061 | 0.27 | 22.01 | 22.21 | 21.59 | 21.67 | 0.05 | 0.03 | 0.06 | 0.03 | 0.00 | 0.00 | 0.00 | 0.00 | 25.38 | 23.29 | 22.23 | 21.95 | 21.39 | 0.99 | 0.28 | 0.15 | 0.18 | 0.40 | 0 |
| 1 | 372 | 205.344894 | 40.692242 | 0.44 | 24.71 | 24.65 | 23.91 | 24.06 | 0.23 | 0.29 | 0.19 | 0.30 | 0.00 | 0.00 | 0.00 | 0.00 | 0.00 | 0.00 | 0.00 | 0.00 | 0.00 | 0.00 | 0.00 | 0.00 | 0.00 | 0.00 | 1 |
| 1 | 373 | 205.345093 | 40.683819 | 0.64 | 23.72 | 23.78 | 22.23 | 22.22 | 0.13 | 0.13 | 0.06 | 0.05 | 18.70 | 18.83 | 0.20 | 0.17 | 0.00 | 0.00 | 0.00 | 0.00 | 0.00 | 0.00 | 0.00 | 0.00 | 0.00 | 0.00 | 1 |
| 1 | 374 | 205.345200 | 40.673759 | 0.47 | 23.43 | 23.67 | 23.13 | 23.19 | 0.14 | 0.12 | 0.19 | 0.13 | 0.00 | 0.00 | 0.00 | 0.00 | 0.00 | 0.00 | 0.00 | 0.00 | 0.00 | 0.00 | 0.00 | 0.00 | 0.00 | 0.00 | 0 |
| 1 | 375 | 205.345200 | 40.721111 | 0.16 | 21.87 | 22.12 | 21.54 | 21.70 | 0.04 | 0.03 | 0.05 | 0.04 | 0.00 | 0.00 | 0.00 | 0.00 | 24.17 | 22.64 | 22.09 | 22.11 | 22.05 | 0.93 | 0.11 | 0.10 | 0.17 | 0.72 | 0 |
| 1 | 376 | 205.345500 | 40.702600 | 0.00 | 0.00 | 0.00 | 0.00 | 0.00 | 0.00 | 0.00 | 0.00 | 0.00 | 19.47 | 19.69 | 0.20 | 0.39 | 0.00 | 0.00 | 0.00 | 0.00 | 0.00 | 0.00 | 0.00 | 0.00 | 0.00 | 0.00 | 1 |
| 1 | 377 | 205.345596 | 40.648869 | 0.31 | 22.76 | 23.12 | 22.11 | 22.31 | 0.11 | 0.08 | 0.10 | 0.06 | 0.00 | 0.00 | 0.00 | 0.00 | 0.00 | 0.00 | 0.00 | 0.00 | 0.00 | 0.00 | 0.00 | 0.00 | 0.00 | 0.00 | 0 |
| 1 | 378 | 205.345596 | 40.651150 | 0.37 | 24.71 | 24.63 | 24.64 | 24.66 | 0.23 | 0.31 | 0.38 | 0.56 | 0.00 | 0.00 | 0.00 | 0.00 | 0.00 | 0.00 | 0.00 | 0.00 | 0.00 | 0.00 | 0.00 | 0.00 | 0.00 | 0.00 | 0 |
| 1 | 379 | 205.346405 | 40.705742 | 0.66 | 23.41 | 23.47 | 23.29 | 23.09 | 0.12 | 0.10 | 0.18 | 0.12 | 0.00 | 0.00 | 0.00 | 0.00 | 0.00 | 0.00 | 0.00 | 0.00 | 0.00 | 0.00 | 0.00 | 0.00 | 0.00 | 0.00 | 1 |
| 1 | 380 | 205.346893 | 40.705860 | 0.62 | 23.55 | 23.66 | 22.56 | 22.59 | 0.16 | 0.12 | 0.11 | 0.08 | 0.00 | 0.00 | 0.00 | 0.00 | 0.00 | 0.00 | 0.00 | 0.00 | 0.00 | 0.00 | 0.00 | 0.00 | 0.00 | 0.00 | 1 |
| 1 | 381 | 205.346893 | 40.708519 | 0.75 | 22.72 | 22.75 | 22.35 | 22.19 | 0.07 | 0.05 | 0.09 | 0.05 | 19.09 | 19.06 | 0.21 | 0.21 | 24.02 | 23.88 | 22.61 | 21.97 | 21.97 | 0.92 | 0.32 | 0.16 | 0.15 | 0.71 | 1 |
| 1 | 382 | 205.347107 | 40.726608 | 0.03 | 19.41 | 20.39 | 18.82 | 19.65 | 0.01 | 0.01 | 0.01 | 0.01 | 16.34 | 16.80 | 0.04 | 0.03 | 21.44 | 20.57 | 19.55 | 19.22 | 19.26 | 0.61 | 0.09 | 0.05 | 0.08 | 0.40 | 0 |
| 1 | 383 | 205.347198 | 40.717892 | 0.98 | 17.64 | 17.75 | 16.05 | 16.13 | 0.00 | 0.00 | 0.00 | 0.00 | 13.60 | 13.63 | 0.00 | 0.00 | 21.55 | 19.40 | 17.99 | 16.59 | 15.81 | 0.20 | 0.01 | 0.01 | 0.00 | 0.01 | 0 |
| 1 | 384 | 205.347600 | 40.716520 | 0.00 | 0.00 | 0.00 | 0.00 | 0.00 | 0.00 | 0.00 | 0.00 | 0.00 | 18.90 | 18.96 | 0.20 | 0.19 | 0.00 | 0.00 | 0.00 | 0.00 | 0.00 | 0.00 | 0.00 | 0.00 | 0.00 | 0.00 | 0 |
| 1 | 385 | 205.347900 | 40.708080 | 0.39 | 24.24 | 24.25 | 23.57 | 23.70 | 0.21 | 0.21 | 0.19 | 0.22 | 0.00 | 0.00 | 0.00 | 0.00 | 0.00 | 0.00 | 0.00 | 0.00 | 0.00 | 0.00 | 0.00 | 0.00 | 0.00 | 0.00 | 1 |
| 1 | 386 | 205.348100 | 40.721030 | 0.00 | 0.00 | 0.00 | 0.00 | 0.00 | 0.00 | 0.00 | 0.00 | 0.00 | 19.67 | 19.47 | 0.19 | 0.30 | 0.00 | 0.00 | 0.00 | 0.00 | 0.00 | 0.00 | 0.00 | 0.00 | 0.00 | 0.00 | 0 |
| 1 | 387 | 205.348206 | 40.703239 | 0.47 | 22.35 | 22.84 | 21.55 | 21.99 | 0.08 | 0.06 | 0.06 | 0.05 | 0.00 | 0.00 | 0.00 | 0.00 | 0.00 | 0.00 | 0.00 | 0.00 | 0.00 | 0.00 | 0.00 | 0.00 | 0.00 | 0.00 | 1 |
| 1 | 388 | 205.348297 | 40.675339 | 0.46 | 24.26 | 24.30 | 23.55 | 23.50 | 0.23 | 0.21 | 0.21 | 0.18 | 0.00 | 0.00 | 0.00 | 0.00 | 0.00 | 0.00 | 0.00 | 0.00 | 0.00 | 0.00 | 0.00 | 0.00 | 0.00 | 0.00 | 0 |
| 1 | 389 | 205.348404 | 40.679119 | 0.03 | 17.57 | 18.73 | 17.12 | 18.18 | 0.00 | 0.00 | 0.00 | 0.00 | 15.15 | 16.04 | 0.02 | 0.01 | 19.43 | 18.25 | 17.73 | 17.42 | 17.26 | 0.10 | 0.01 | 0.01 | 0.01 | 0.06 | 0 |
| 1 | 390 | 205.348404 | 40.710121 | 0.16 | 22.30 | 22.49 | 21.39 | 21.61 | 0.07 | 0.04 | 0.05 | 0.03 | 19.31 | 19.20 | 0.14 | 0.24 | 24.28 | 23.87 | 22.75 | 22.13 | 21.17 | 0.92 | 0.29 | 0.16 | 0.16 | 0.36 | 1 |