Modeling Connectivity in Terms of Network Activity
Abstract
A new complex network model is proposed which is founded on growth with new connections being established proportionally to the current dynamical activity of each node, which can be understood as a generalization of the Barabási-Albert static model. By using several topological measurements, as well as optimal multivariate methods (canonical analysis and maximum likelihood decision), we show that this new model provides, among several other theoretical types of networks including Watts-Strogatz small-world networks, the greatest compatibility with three real-world cortical networks.
Several models have been developed in order to better understand the structure and evolution of complex networks, including Erdős and Rényi random graph model (ER) Erdős and Rényi (1959) and Watts and Strogatz small-world model (WS) Watts and Strogatz (1998). Another widely known approach is the Barabási-Albert (BA) model, developed as a means to reproduce the scale-free feature observed in many real-world networks, such as in the World Wide Web (WWW), the power grid and the actor collaboration network Barabási and Albert (1999). Scale-free networks present a power-law distribution of degrees in the form , where is the degree and the exponent is system dependent. Such networks are characterized by the existence of hubs, i.e. nodes with particularly high degrees. The BA model is based on growth and preferential attachment: starting with a small network of nodes, new nodes are sequentially added and connected to other nodes with probability ( is the degree of node ), i.e. nodes with higher degree have a proportionally higher probability of receiving new connections Barabási and Albert (1999).
Other models of network formation have been proposed as modifications or generalizations of the BA model, e.g. non-linear preferential attachment rules Krapivsky et al. (2000). Nevertheless, these models tend to be solely based on the structural features of the growing network, such as the degree. In the work reported here, we have developed a preferential attachment model based on a dynamical feature of network nodes: namely, nodes with higher activity have higher probability of establishing new connections. We use the term “activity” to refer to the stationary distribution of frequency of visits to nodes of a random walk, quantified as , where is the number of times the random walker visited node after walking steps. Therefore, the attachment rule of our model is based on a dynamical process taking place on the entire network rather than on static, topological feature of nodes.
It is worth pointing out that the Activity-based Preferential Attachment model (APA for short) introduced here takes into account the more general case of directed networks, as opposed to the undirected ones considered in the BA model, so that in- and out-going edges are assigned for each newly created node. It turns out that if undirected edges are created in the APA model, the BA model is reproduced, as a consequence of the fact that the activity is perfectly correlated with the degree in undirected networks da F. Costa et al. (2007a). Therefore, the APA model can be understood as a generalization of the BA model. However, as in directed networks the activity is not in general correlated with the degree, the type of topologies produced by the APA model depends strongly on the specific distributions of frequencies of visits. As a matter of fact, the correlations between in-degree and activity and between out-degree and activity vary greatly from network to network, and no exact and general relationship between these quantities has been discovered yet, except that full correlation between the frequency of visits and the degree is obtained provided the in-degree is identical to the out-degree for every node in the network da F. Costa et al. (2007a) (observe that the undirected networks are only a particular case of this more general condition).
Some models based on dynamical features have also been reported in the literature. Examples include models driven by Prisoner’s Dilemma dynamics Poncela et al. (2008) and degree of synchronizability Donetti et al. (2008). Another approach to the development of connectivity is Hebbian theory Hebb (1949), where two neurons are connected if a neuron repeatedly or persistently takes part in firing the other neuron. Such a model has been considered in the study of complex networks Bar-Yam and Epstein (2004), but we are not aware of related growing models. Indeed, no model based on preferential attachment taking into account individual node activity seems to have been proposed yet. Our main motivation to develop such model is that in many networks the dynamics is more closely related to the relevance of each node than the degree or other traditional structural node measurement. For instance, the frequency of visits to each web page in the WWW is a particularly efficient indicator of page relevance (viz. Google’s PageRank Page et al. (1998)). Therefore, a measurement of the dynamics taking place in a network constitute a more direct and reliable indicator of node relevance than just in- or out-degrees, especially for directed networks, where the activity tends to be uncorrelated with the degree. We have chosen the traditional random walk, i.e. the probability of following a link is inversely proportional to the out-degree of the current node, because it is one of the most important models of dynamics in physics and in many other fields Lovász (1996).
In the present work, we show that several directed networks intrinsically underlying dynamical processes, such as the cortical networks of the cat and the macaque Scannell et al. (1999); Honey et al. (2007), are best reproduced by the APA model than by other classical complex network models (e.g. WS and BA). Our methodology is based on the characterization of each network in terms of a set of network measurements and on the subsequent application of canonical variable analysis and Bayesian decision theory da F. Costa et al. (2007b); Duda et al. (2001).
A directed network of nodes can be completely represented by the adjacency matrix of order , whose position is equal to 1 if and only there exists a directed edge pointing from node to node (otherwise, ). The in-degree of node , i.e. the number of connections it receives, is equal to , and its out-degree, which is equal to the total number of edges leaving it, is given as da F. Costa et al. (2007b). The dynamics of a random walk is entirely determined by the stochastic (or transition) matrix with elements , i.e. the probability of the walker visiting node at step after being at node at step is equal to . Notice that implies . In other words, the next step of the walker depends only on its current state (Markov Chain). The stationary, or steady-state, distribution of probabilities of being at each node, i.e. , can be obtained by solving . In particular, is the eigenvector associated with the eigenvalue 1 of Lovász (1996). We define for proper statistical normalization. For this distribution to be unique, needs to be irreducible, i.e. the network must be strongly connected, which happens when every node can reach every other node in the network through a finite path. For undirected networks (when is a symmetric matrix), the stationary distribution of a random walk can be directly obtained from the degree distribution as follows , whereas for directed networks this perfect correlation only happens when, for every node , .
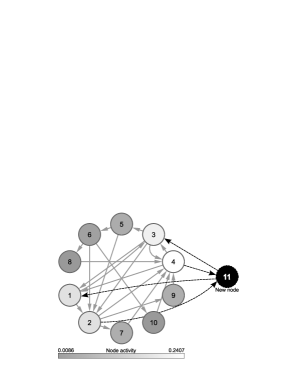
The growth of the APA model starts at with a random directed network of nodes and initial walker distribution . At each subsequent time step () a new node is added to the network and directed edges are independently created from older nodes () to the current node (in-edges) and from node to other nodes (out-edges). The general idea behind this model is that a new node would want to establish in-edges with highly active nodes in order to receive a considerable share of activity from the outset of its lifetime. Therefore, in-edges are created between node and other nodes following the preferential attachment probability . Because there is no out-edge attachment rule that could intuitively increase the activity of a new node, we have proposed two approaches: a uniform rule , and the preferential rule already used for in-edges. Therefore, these two approaches have divided APA into two model variations: the original APA, that considers the preferential attachment for both edge directions, and APA’, that takes into account only the in-edges in the preferential attachment rule.
Figure 1 illustrates a small network being constructed by the APA approach with , where a new node tends to be connected with highly active nodes regarding both edge directions. The stationary frequencies of visits of each node are shown by gray-levels. Notice that for both APA and APA’ networks, the average in- and out-degrees are . The BA model is exactly reproduced by considering the APA model with undirected edges, since for every undirected and connected network. Consequently, the APA model can be understood as a generalization of the BA model.
Computer simulations were performed in order to characterize APA and APA’ models, where 150 realizations of each model with and were generated, and the respective average results are shown in Figure 2 and Table 1. The in- and out-degree distributions are included in Figure 2, as well as the activity distribution. The APA model yields power-law degree distributions for both edge directions, although these distributions have a small deviation from a power-law when considering high degrees. Nevertheless, the obtained distributions clearly show the existence of hubs of in- and out-degree in the APA model. When considering APA’ networks, these distributions greatly deviate from a power-law, with steep decays for high degrees that prevent the occurrence of nodes as highly connected as in the APA networks. The activity distributions reveal that APA networks are also scale-free with this respect, whereas APA’ again deviates from a power-law, not showing hubs of activity like in the APA model. Networks with different sizes and average degrees were also analyzed, yielding similar results.
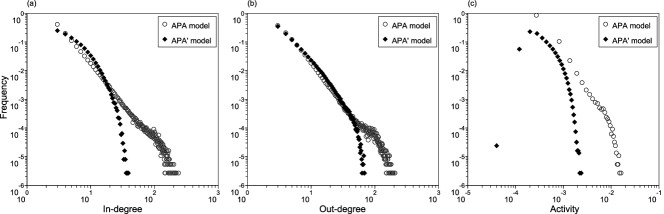
Table 1 shows the values obtained for a set of measurements calculated for APA and APA’ (each model with 150 realizations, and ). The employed measurements are da F. Costa et al. (2007b); Garlaschelli and Loffredo (2004) (i) clustering coefficient , (ii) length of shortest paths , (iii) assortativity between in- and out-degrees ( and , respectively) and (iv) reciprocity , where averages were taken for each network model. The first three measurements are well-known da F. Costa et al. (2007b), while the reciprocity quantifies to what an extent a directed network contains symmetric links, i.e. edges that connect pairs of nodes at both directions Garlaschelli and Loffredo (2004). We also computed the minimum reciprocity , which depends on the specific edge density of a network.
| APA model | APA’ model | |
|---|---|---|
The results included in Table 1 show that both APA and APA’ networks have particularly low clustering coefficients (specially in APA’) coexisting with short path lengths (around 4), therefore resembling the BA model. The assortativity values show no correlation between degrees in the APA model (like in the BA model), whereas slightly positive correlations appear in APA’. Reciprocity results indicate that APA and APA’ networks are areciprocal (), which means that edges in these networks do not tend to be symmetric (reciprocity results are also particularly close to the respective minimums). Similar characteristics were observed in networks of different sizes and densities (results not shown).
In order to accurately compare the models APA and APA’ with other models, and also to classify real-world networks with reference to a set of putative models, it is necessary to consider a larger number of network measurements da F. Costa et al. (2007b). In the current letter, we adopted a set of nine measurements to quantify the topological properties of complex networks: (i) average node degree, (ii) average clustering coefficient, (iii) average shortest path length, (iv) in- and (v) out-assortativity coefficients, (vi) central point dominance, (vii) average betweenness centrality, (viii) hierarchical clustering coefficient and (ix) hierarchical convergence ratio. All these measurements are discussed in da F. Costa et al. (2007b).
The classification of real-world networks involves the consideration of different network models, each one generating specific types of topologies. In this way, we took into account the following models (as well as APA and APA’ models): (i) Erdős-Rényi random graph (ER) Erdős and Rényi (1959), which generates networks with random placement of connections, (ii) small-world model of Watts and Strogatz (WS), which produces networks whose structures lie between a regular and a random network Watts and Strogatz (1998), (iii) Barabási-Albert scale-free model (BA), which constructs networks having a power-law degree distribution Barabási and Albert (1999), and (iv) a geographical model (GG), where nodes next to each other in a given metric space are more likely to be connected by an edge da F. Costa et al. (2007b).
Since the network classification requires a large set of model realizations in order to minimize statistical fluctuations, we applied canonical variable analysis to reduce the dimensionality of the -dimensional measurement space while maximizing the separation between the network models. This multivariate statistical technique is an extension of principal component analysis and allows optimal projections of a set of measurements so as to obtain the reduction of the dimensionality of the original space while maximizing the separation between the known categories (i.e. network models) Campbell and Atchley (1981). The computation of the canonical variable analysis is based on the so-called inter- and intra-class matrices, as well as on the diagonalization of the product between the inverse of the intra-class matrix and the inter-class matrix. The selection of the eigenvectors corresponding to the highest absolute eigenvalues of this matrix product allows the projection of the measurements into a -dimensional space (). In the current work, we considered .
The projection is then performed by calculating the inner products between the original feature (network measurement) vectors and the two eigenvectors corresponding to the highest eigenvalues. After the projection, we estimated the probability density of the projected points into the two dimensional space for each class, by considering the non-parametric method called Parzen windows Duda et al. (2001). This method starts by representing each point in the projection as a Dirac’s delta function. These deltas are then convolved with a normalized Gaussian function, yielding the estimated distributions, which are then considered for the classification of a given real-world network. Notice that every model realization has the same number of vertices and approximately the same average degree of the respective real-world network. Maximum likelihood decision theory was then applied in order to classify each real-world network by associating it to the model that results in the largest overall probability Duda et al. (2001); da F. Costa et al. (2007b). Observe that equiprobability of the mass probabilities is guaranteed by using the same number of realizations for each category.
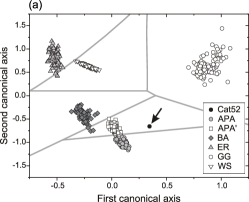
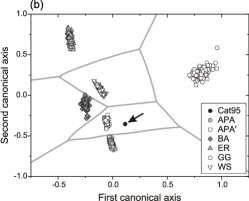
The classification methodology was applied to three cortical networks, namely (i) cat cortex containing cortical areas Scannell et al. (1999), (ii) cat cortex including all cortical and thalamic areas () Scannell et al. (1999) and (iii) macaque large scale cortical network, including visual and sensorimotor areas () Honey et al. (2007); to two food webs, (i) Canton (a pasture grassland in New Zealand, ) Jaarsma et al. (1998) and (ii) Kyeburn (a tussock grassland in New Zealand, ) Jaarsma et al. (1998); and to the Roget thesaurus network () Holanda et al. (2004). For short, the first two networks are called here “cat52” and “cat95”, respectively. Figure 3 presents the classification of all three cortical networks and the Roget thesaurus, taking into account 100 realizations of each network model. All cortical networks fall inside the APA’ region in the canonical projections, which means that the APA’ model is the most likely in those cases. On the other hand, in the case of the Roget thesaurus network and the food webs, the respective networks have been classified as small-world, as could be expected Holanda et al. (2004); Montoya and Sole (2002).
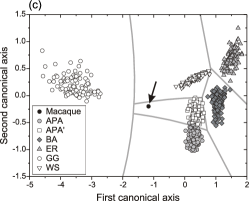
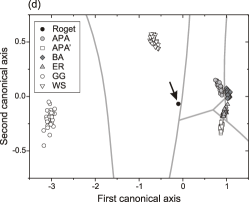
Therefore, the proposed activity-based preferential attachment model (APA’) revealed to be compatible with cortical networks. Nevertheless, it has been claimed that brain networks can be well modeled by WS networks (e.g. Sporns and Zwi (2004); Hilgetag and Kaiser (2004); Bassett and Bullmore (2006)), which is not supported by the results of the current work. Furthermore, the “cat95” network was previously analyzed using the stationary random walk distribution to simulate cortical activation da F. Costa and Sporns (2006), and the out-degrees were found to be highly correlated with random walk activity.
The obtained results suggest that the brain is organized in order to favor the connections with a small number of highly active regions. In fact, since this mechanism is a generalization of the well-established preferential attachment model, we observed that the connections in the brain would not be guided by structural aspects (i.e. the connectivity), but rather by dynamics (i.e. frequency of visits by random walks). This process can be related to the Hebbian theory Hebb (1949), since nodes that receive walks more frequently tend to receive repeated and persistent stimulation and therefore establish a large number of connections.
All in all, the current work described a new model of complex network which is founded on a growth mechanism favoring attachments proportional to the current activity of each node. This approach can also be understood as a generalization of the BA model. As such, the proposed approach is intrinsically suited for modeling complex systems whose connectivity is determined by the respective dynamics. An effective combination of estimation of several topological measurements, as well as the optimal methods of canonical analysis and maximum likelihood decision theory, paved the way to a sound comparison between real-world networks and several putative theoretical models, namely APA, APA’, ER, WS, BA and GG. The proposed model turned out to exhibit a remarkable compatibility with three real-world cortical networks. Future developments include the application to modeling neuronal networks where each node represents a neuron. It would also be interesting to consider attachment rules founded on transient, rather than stationary dynamics.
Acknowledgements.
L. da F. Costa is grateful to FAPESP (05/00587-5) and CNPq (301303/06-1) for financial support. F. A. Rodrigues thanks FAPESP grant 07/50633-9 and L. Antiqueira FAPESP grant 06/61743-7.References
- Erdős and Rényi (1959) P. Erdős and A. Rényi, Publicationes Mathematicae (Debrecen) 6, 290 (1959).
- Watts and Strogatz (1998) D. J. Watts and S. H. Strogatz, Nature 393, 440 (1998).
- Barabási and Albert (1999) A. L. Barabási and R. Albert, Science 286, 509 (1999).
- Krapivsky et al. (2000) P. L. Krapivsky, S. Redner, and F. Leyvraz, Physical Review Letters 85, 4629 (2000).
- da F. Costa et al. (2007a) L. da F. Costa, O. Sporns, L. Antiqueira, M. G. V. Nunes, and O. N. Oliveira Jr., Applied Physics Letters 91, 054107 (2007a).
- Poncela et al. (2008) J. Poncela, J. Gómez-Gardeñes, L. M. Floría, A. Sánchez, and Y. Moreno, PLoS ONE 3, e2449 (2008).
- Donetti et al. (2008) L. Donetti, P. I. Hurtado, and M. A. Muñoz, Journal of Physics A 41, 224008 (2008).
- Hebb (1949) D. Hebb, New York: Wiley, 1949. (1949).
- Bar-Yam and Epstein (2004) Y. Bar-Yam and I. Epstein, Proceedings of the National Academy of Sciences 101, 4341 (2004).
- Page et al. (1998) L. Page, S. Brin, R. Motwani, and T. Winograd, Tech. Rep., Stanford Digital Library Technologies Project (1998), 17 p.
- Lovász (1996) L. Lovász, in Combinatorics, Paul Erdős is Eighty, edited by D. Miklós, V. T. Sós, and T. Szőnyi (János Bolyai Mathematical Society, Budapest, 1996), vol. 2, pp. 353–398.
- Scannell et al. (1999) J. W. Scannell, G. Burns, C. C. Hilgetag, M. A. O’Neil, and M. P. Young, Cerebral Cortex 9, 277 (1999).
- Honey et al. (2007) C. Honey, R. Kötter, M. Breakspear, and O. Sporns, Proceedings of the National Academy of Sciences 104, 10240 (2007).
- da F. Costa et al. (2007b) L. da F. Costa, F. A. Rodrigues, G. Travieso, and P. R. Villas Boas, Advances in Physics 56, 167 (2007b).
- Duda et al. (2001) R. O. Duda, P. E. Hart, and D. G. Stork, Pattern Classification (John Wiley & Sons, New York, 2001).
- Garlaschelli and Loffredo (2004) D. Garlaschelli and M. I. Loffredo, Physical Review Letters 93, 268701 (2004).
- Campbell and Atchley (1981) N. A. Campbell and W. R. Atchley, Systematic Zoology 30, 268 (1981).
- Jaarsma et al. (1998) N. G. Jaarsma, S. M. De Boer, C. R. Townsend, R. M. Thompson, and E. D. Edwards, New Zealand Journal of Marine and Freshwater Research 32, 271 (1998).
- Holanda et al. (2004) A. J. Holanda, I. T. Pisa, O. Kinouchi, A. S. Martinez, and E. E. S. Ruiz, Physica A: Statistical Mechanics and its Applications 344, 530 (2004).
- Montoya and Sole (2002) J. M. Montoya and R. V. Sole, Journal of theoretical biology 214, 405 (2002).
- Sporns and Zwi (2004) O. Sporns and J. Zwi, Neuroinformatics 2, 145 (2004).
- Hilgetag and Kaiser (2004) C. Hilgetag and M. Kaiser, Neuroinformatics 2, 353 (2004).
- Bassett and Bullmore (2006) D. S. Bassett and E. Bullmore, The Neuroscientist 12, 512 (2006).
- da F. Costa and Sporns (2006) L. da F. Costa and O. Sporns, Applied Physics Letters 89, 013903 (2006).