Imaging molecular characterization by high-order above threshold ionization in intense laser field
Abstract
Using the frequency-domain theory, the high-order above threshold ionization (HATI) of a molecule is treated as a two-step transition: an above threshold ionization (ATI) followed by a laser-assisted collision (LAC). It is found that the HATI spectrum carries three pieces of information: the fingerprint of the molecular wave function lying in the ATI transition, the geometry structure of the molecule lying in the potential scattering between two plane waves, and the interaction between the ionized electron and the laser field lying in a phase factor in the LAC transition, where the phase factor can be regarded as due to the action difference of the classical trajectory before and after the collision within one laser cycle. Based on this picture, it is demonstrated that the skeleton structure of a molecule can be imaged more clearly using a relatively higher frequency laser field due to the simplification of interference originated from the phase factor. This work can shed light on imaging the structure of a complex molecule by a HATI process.
pacs:
42.65.-k, 42.50.Hz, 32.80.Rm∗ Author to whom correspondence should be addressed.
Laser-driven rescattering process of electrons opens a new way to image the structure of a molecule. Both high-order harmonic generation (HHG) 1 ; 2 ; 3 ; 4 ; 5 ; 6 and high-order above threshold ionization (HATI) 7 ; 8 ; 9 processes have been utilized to realize this task. Odzak and Milosevic 6 have shown clear minima on HHG spectra that depend on molecular orientation. Becker et al. 8 have demonstrated that the interference structure of a HATI spectrum strongly depends on the symmetry of the ground state molecular orbital. A general formula that describes the destructive interference of a multiple-center recollsion has been found in both HHG 6 and HATI 8 spectra. Now people are trying to extract more information about a molecule from the HATI spectrum. Therefore, it is necessary to understand in more detail how a complex interference pattern forms in the process, and what characteristic of the whole system the pattern represents.
The frequency-domain theory based on a nonperturbative quantum electrodynamics was developed by Guo et al. 10 in 1989 dealing with the above threshold ionization (ATI). Then, Gao et al. 11 extended this method to a study of HHG process. Fu et al. 12 ; 13 further explained the origin of the plateau structure on HHG spectrum and demonstrated the relationship between the time-domain and frequency-domain theories in strong laser physics. More recently, Wang et al. 14 applied this theory to investigate HATI process. It should be noticed that the characteristic of the frequency-domain theory is that the time-evolution dynamic process of a quantum system in a strong laser field is mapped into a frequency space; hence all the rescattering processes can be treated as a two-step transition. Especially, the HATI of a molecule in a strong laser field can be treated as an ATI followed by a laser-assisted collision (LAC). Consequently, we find in this paper that the characteristic of a molecule-laser system can be identified from the HATI spectrum: the fingerprint of the molecular wave function lies in the ATI transition, the geometry structure of the molecule lies in the potential scattering term between two plane waves, and the interaction between the ionized electron and the laser field lies in a phase factor in the laser-assisted transition. Furthermore, since these three parts are relatively independent with each other, we demonstrate that the molecular skeleton structure can be imaged more clearly with a higher frequency laser field because of the simplification of interference due to the interaction between the ionized electron and the laser field. Recently, we are aware of the work by Reiss on the ATI of an atom in a low frequency laser field using the strong-field approximation reiss .
The frequency-domain theory of the HATI process has been described in 14 . Here we summarize the basic elements of this theory and the modifications for a molecular case. Atomic units are used throughout unless otherwise stated. We consider a quantized single-mode laser field of frequency . The Hamiltonian for a molecule-laser system is
| (1) |
where is the energy operator for a free electron-photon system, is the photon number operator with () being the annihilation (creation) operator of the laser photon mode, is the molecular binding potential that characterizes the geometry structure of the molecule, and is the electron-photon interaction in which is the vector potential, and with being the normalization volume of the field, and the polarization vector of the laser field.
The time-independent feature of the field-quantized Hamiltonian enables us to treat HATI as a genuine scattering process in an isolated system that consists of the photons and the molecule. Since the energy is conserved throughout the interaction, the formal scattering theory 15 can thus be applied. Therefore, the transition matrix element can be written as 10
| (2) |
where the initial state is the eigenstate of the Hamiltonian with the associated energy . Moreover, is the ground-state wave function of the molecular electron with the binding energy and is the Fock state of the laser mode with the photon number . Finally, the final state of energy is the Volkov state of the quantized-field 10 ; 14 .
The first and second terms in Eq.(2) respectively correspond to the processes of direct and rescattering ATI. Thus, can be expressed as . On the one hand, as for the direct ATI transition, we have 10 ; 16
| (3) | |||||
where with the ponderomotive energy of an electron in the laser field, , is the Fourier transform of the initial wave function , and is the generalized Bessel function with , the momentum of the electron in the finial state, and . In general, a molecular ground-state wave function can be constructed using the linear combination of atomic orbital (LCAO) approximation as in 8 ; 17 ; 18 . Since Eq. (3) contains a molecular wave function, the direct ATI spectrum can thus image the characteristic of a molecular wave function. As an example, we calculate the angle-resolved direct ATI spectra for O2 and N2 molecule with the molecule axis along the laser polarization and the laser frequency and . The angle is between the final momentum of the ionized electron and the molecular axis. We find that for N2 the ATI rate decreases with . For O2, the ATI rate is zero at . It then increases rapidly with , gets its maximum at about 20 degrees, and then decreases with . The dependence of the ATI rate on the angle agrees well with the results by Chen et al. 18 .
On the other hand, the rescattering ATI transition can be written as
| (4) | |||||
To obtain Eq. (4), we used the completeness relation of the Volkov states and assumed that the effect of the binding potential can be neglected when the electron is in the continuum. The physics underlying Eq. (4) is clear. Specifically, represents the direct ATI amplitude, where the ground state electron absorbs photons from the laser field and ionizes; whereas represents the amplitude of LAC in which the ionized electron absorbs photons from the field during its collision with the nucleus, resulting in the change of the canonical momentum of the electron from to . Therefore, from the frequency-domain viewpoint, the rescattering ATI can be described simply as an ATI followed by a LAC with all ATI channels summed up coherently. Furthermore, Eq. (4) indicates that provides a weight amplitude for transition in each ATI channel. Because the initial molecular wave function only appears in the term, it can only influence the amplitude of LAC transition, resulting in that the wave function can affects the HATI amplitude of each channel, rather than the structure of the HATI spectrum. This finding can be confirmed by the HATI spectra shown in 8 .
The ATI transition in Eq. (4) has the same form as Eq. (3) with and being replaced by and , respectively. Furthermore, the transition matrix element of LAC can be written as
| (5) | |||||
where is the Bessel function with and . To obtain the last equation, we use the integral representation of the Bessel function . The transition term is . Equation (5) indicates that the LAC can be understood as the potential scattering between two plane waves, as shown by , with a phase factor reflecting the phase difference within one optical cycle between the two states before and after the collision. The existence of the phase factor is due to the fact that the recolliding electron oscillates by the laser field during the recollision process. Thus, the interference pattern of the molecular HATI spectrum can be attributed to the combination of the potential scattering and the phase factor . In particular, the skeleton structure of the molecule lies in the potential scattering term, while the interaction between the ionized electron and the laser field is represented by the phase factor term in Eq. (5). Since the phase factor is independent of the potential scattering term and is only determined by the laser condition, the phase factor just provides a “background” of interference fringes. Based on this perspective, one may expect that the structure of a molecule can be imaged more clearly by the HATI spectrum if the “background” interference pattern from the phase factor can be simplified. Fortunately, this idea can be realized when the laser frequency increases, as shown in Fig.1.
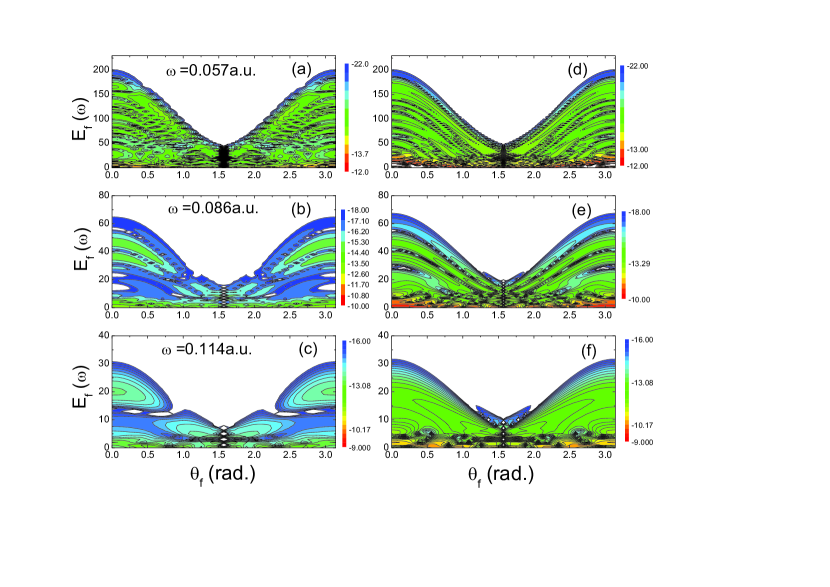
We now focus on the imaging of the geometry structure of a molecule, rather than its wave function, by HATI spectrum. We consider a HATI process of H in an intense laser field. We employ a zero-range potential model for similar to that in 19 , where the zero-range potential is with . The two-center binding potential of a diatomic molecule can thus be written as where and are the positions of the two nuclei. The molecular orientation is along the polarization of the laser field and the ionization potential is 29.8 eV that corresponds to the ionization potential of the ground state of H with the internuclear separation being 2 a.u. The wave function of H is , where is the atomic wave function corresponding to the potential and is the atomic orbital overlap integral. The laser intensity is W/cm2 and the frequency is chosen to be three different values. Figure 1 presents the angle-resolved HATI spectra with ((a) and (d)), ((b) and (e)), and ((c) and (f)) for the H molecule ((a)-(c)) and the atomic xenon ((d)-(f)). The ponderomotive energy is 16.0, 4.7, and 2.0 for the case of , , and , respectively. In Fig.1, is the angle between the final momentum of the ionized electron and the molecular axis. It shows that the cutoff of the kinetic energy spectrum at is about 10 for all the three frequency cases. Comparing the molecular case with the atomic case, one can find that (1) there are common interference fringes, which we define as “background” interference due to in both the molecular and atomic cases, and these fringes reduce as the laser frequency increases. (2) There exist two destructive curves for the molecular case in Fig. 1 (a-c), which predict the minimum positions caused by the destructive interference of the two-center collision, as mentioned in 8 ; 9 . (3) The two destructive curves in the molecular case do not change with frequency, leading to a much clearer destructive pattern on the HATI spectrum for the case of higher frequency, as shown in Fig. 1 (c).
We first investigate the source of the “background” interference stripes and the reason why it decreases with frequency. Let us analyze the LAC transition for separated ATI channels. By using the saddle point approximation, Eq. (5) can be expressed as follows:
| (6) | |||||
where is the saddle point time satisfying , and is the number of photons absorbed during the collision. We can find that the interference comes mainly from the cosine function
| (7) |
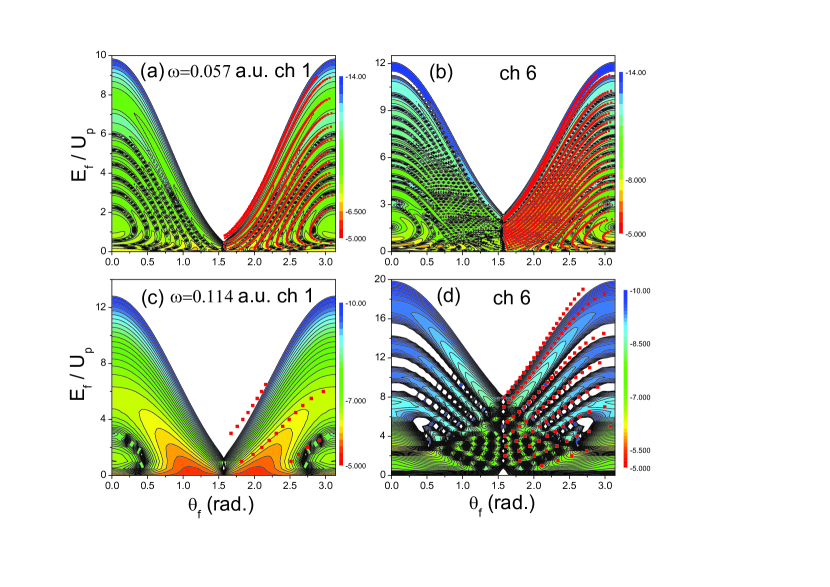
The destructive interference lines should occur when . Figure 2 presents the angle-resolved HATI spectra of the Xe atom when ((a) and (b)) and ((c) and (d)) for channel 1 ((a) and (c)) and channel 6 ((b) and (d)) respectively. One can find that the interference fringes increase with channel order and decrease with frequency. The dashed lines in each panel of Fig. 2 is obtained by the formula . For comparison, we only present the curves with ) in Fig. 2. It indicates that the dashed curves by Eq. (7) agree well with the quantum calculations for all the cases shown in Fig. 2, except that the curves for the small part in Fig. 2 (b) are a little lower than the quantum results. This difference may be due to the error from the saddle-point approximation.
As mentioned in 14 , the phase factor in Eq. (5) can be regarded as due to the classical action difference of the classical trajectory before and after the collision, i.e., with , where the classical action is with the potential of the corresponding classical laser field being . Using the saddle-point approximation, we may find that there are two moments and that the rescattering occurs within one optical cycle, which corresponds to two classical trajectories; hence the interference fringes shown in Fig. 2 is due to the interference of these two classical trajectories, where the minima are determined as . Although Eq. (7) is so complex that there is no direct way to show the relationship between the number of the interference fringes and the system condition, the results in Fig. 2 indicate that some information can be derived from the interference fringes. Figure 2 shows that the smaller the and the smaller the incoming kinetic energy of the rescattering electron, the fewer the interference fringes.
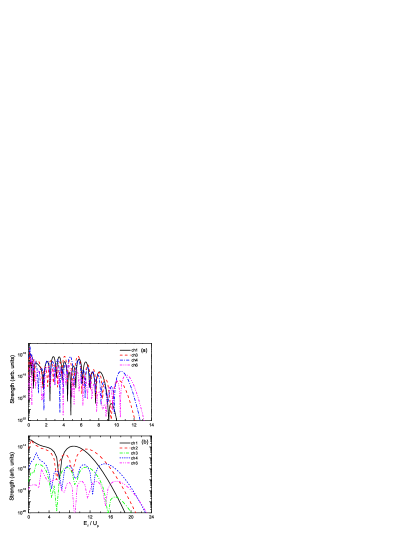
Comparing the total HATI spectra in Fig. 1 with the channel HATI spectra in Fig. 2, one can see that, for the case of low frequency, the total HATI spectrum is more complex than that of channel 1; while for the case of high frequency, the total spectrum agrees with that of channel 1. Since the total spectrum is the coherent summation of the contributions from all ATI channels, the above results indicate that the number of ATI channels that contribute effectively to HATI decreases as increases. To confirm this finding, we present in Fig. 3 the HATI spectra with for different ATI channels for the case of (a) and 0.114 (b) respectively. Figure 3 shows that the strength of HATI spectrum decreases more rapidly with channel order for the case of higher frequency, leading to a further simplification of the total HATI spectrum.
We now investigate the interference pattern of the HATI spectrum for different geometry structures of the H molecular ion. Using the two-center potential of the molecule, the potential scattering of the plane wave can be expressed as 8 ; 9
| (8) |
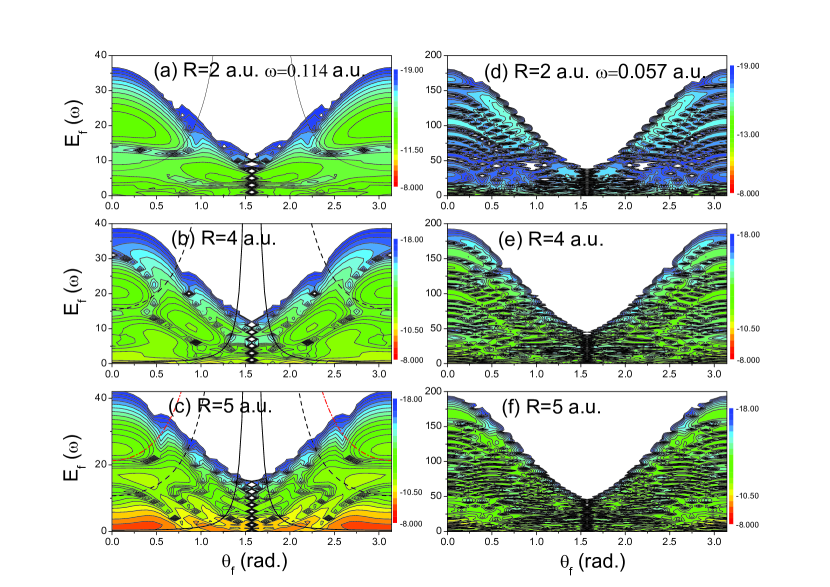
where is the angle between the molecular axis and the final momentum and is the angle between the molecular axis and the momentum . Therefore, the condition corresponds to the destructive position in the HATI spectrum, which contains the characteristic of the geometry structure of the molecule. As an example, Fig. 4 presents the HATI spectra of H with (a), 4 (b), and 5 (c) respectively and . For comparison, the corresponding spectra with are also presented (Fig. 4 (d-f)). One can find that the HATI spectrum for the low frequency is hard to clearly image the structure of the molecule because the background interference is too complex. These results agree with the work by Becker et al. 9 , where the angle-resolved HATI spectra shown in Figs. 6 and 7 of that paper are so complex that the destructive curves are hard to be identified although these curves are predicted (solid lines) by Eq. (8). In contrast, the molecular structure can be clearly imaged by the HATI spectrum as the frequency increases, as shown in Fig. 4 (a-c). Furthermore, the pattern of the HATI spectrum changes dramatically with , and the destructive position can be well predicted by the formula ( for solid black curve and for dashed black curve) and ( for dot red curve).
In summary, we investigate the HATI of a molecule in a strong laser field by the frequency-domain theory. The HATI can be treated as a two-step transition: an ATI followed by a LAC. Based on this viewpoint, It is found that the characteristic of a molecule-laser system can be identified from the HATI spectrum: the fingerprint of the molecular wave function lies in the ATI transition, the geometry structure of the molecule lies in the LAC transition with a phase factor which represents the interaction between the ionized electron and the laser field. Furthermore, we demonstrate that the HATI spectrum of high frequency laser can clearly image the molecular structure of large internuclear distance whereas it is hard to be identified for the low frequency laser because of its complex nature of the interference pattern.
This research was supported by the National Natural Science Foundation of China under Grant No. 60478031 and the 973 Research Project under Grant No. 2006CB806003. ZCY was supported by NSERC of Canada. BW thanks Biao Wu and Jing Chen for their helpful suggestions.
References
- (1) J. Itatani et al., Nature 432, 867 (2004).
- (2) S. Baker et al., Science 312, 424 (2006).
- (3) X. B. Zhou , R. Lock, W. Li, N. Wagner, M. M. Murnane, H.C. Kapteyn, Phys. Rev. Lett. 100, 073902 (2008)
- (4) B. K. McFarland, J. P. Farrell, P. H. Bucksbaum, M. Guhr, Science 322, 1232 (2008).
- (5) W. Li et al., Science 322, 1207 (2008).
- (6) S. Odzak and D. B. Milosevic, J. Phys. B 42, 071001 (2009).
- (7) M. Meckel et al., Science 320, 1478 (2008).
- (8) M. Busuladzic, A. Gazibegovic-Busuladzic, D. B. Milosevic, and W. Becker, Phys. Rev. Lett. 100, 203003 (2008); Phys. Rev. A 78, 033412 (2008).
- (9) H. Hetzheim, C. Figueira de Morisson Faria, and W. Becker, Phys. Rev. A 76, 023418 (2007).
- (10) D.-S. Guo and T. Aerg, J. Phys. A 21, 4577 (1988); D.-S. Guo and G. W. F. Drake, ibid. 25, 3383 (1992); D.-S. Guo, T. Åberg, and B. Crasemann, Phys. Rev. A 40, 4997 (1989).
- (11) L. Gao, X. Li, P. Fu, R.R. Freeman and D.-S. Guo, Phys. Rev. A 61, 063407 (2000).
- (12) P. Fu, B. Wang, X. Li, and L. Gao, Phys. Rev. A 64, 063401 (2001).
- (13) T. Cheng, X. Li, S. Ao, L. A. Wu and P. Fu, Phys. Rev. A 68, 033411 (2003).
- (14) B. Wang, L. Gao, X. Li, D. S. Guo and P. Fu, Phys. Rev. A 75, 063419 (2007).
- (15) H. R. Reiss, Phys. Rev. Lett. 102, 143003 (2009).
- (16) M. Gell-Mann and M. L. Goldberger, Phys. Rev. 91, 398 (1953); M. L. Goldberger and K. M. Watson, Collision Theory (Wiley, New York, 1964).
- (17) H. R. Reiss, Phys. Rev. A 22, 1786 (1980).
- (18) V. I. Usachenko and S.-I. Chu, Phys. Rev. A 71, 063410 (2005).
- (19) X. Y. Jia, W. D. Li, J. Fan, J. Liu, and J. Chen, Phys. Rev. A 77, 063407 (2008).
- (20) H. Hetzheim, C. F. M. Faria, and W. Becker, Phys. Rev. A 76, 023418 (2008).
- (21) A. Jaron, J. Z. Kaminski, and F. Ehlotzky, Phys. Rev. A 63, 055401 (2001).