Strong PAH Emission from ULIRGs11affiliation: Based on observations made with the Spitzer Space Telescope, operated by the Jet Propulsion Laboratory under NASA contract 1407.
Abstract
Using the Infrared Spectrograph on board the Spitzer Space Telescope, we present low-resolution (), mid-infrared (20–38 ) spectra of 23 high-redshift ULIRGs detected in the Boötes field of the NOAO Deep Wide-Field Survey. All of the sources were selected to have ; 2) Vega mag; and 3) a prominent rest-frame 1.6 stellar photospheric feature redshifted into Spitzer’s 3–8 IRAC bands. Of these, 20 show emission from polycyclic aromatic hydrocarbons (PAHs), usually interpreted as signatures of star formation. The PAH features indicate redshifts in the range , with a mean of and a dispersion of 0.30. Based on local templates, these sources have extremely large infrared luminosities, comparable to that of submillimeter galaxies. Our results confirm previous indications that the rest-frame 1.6 stellar bump can be efficiently used to select highly obscured starforming galaxies at , and that the fraction of starburst-dominated ULIRGs increases to faint 24 flux densities. Using local templates, we find that the observed narrow redshift distribution is due to the fact that the 24 detectability of PAH-rich sources peaks sharply at . We can analogously explain the broader redshift distribution of Spitzer-detected AGN-dominated ULIRGs based on the shapes of their SEDs. Finally, we conclude that sources with a detectable 1.6 stellar opacity feature lack sufficient AGN emission to veil the 7.7 PAH band.
Subject headings:
galaxies: active — galaxies: evolution — galaxies: formation — galaxies: starburst — infrared: galaxies1. Introduction
The launch of the Spitzer Space Telescope (Werner et al. 2004a) has allowed the identification and study of significant populations of distant, infrared-bright galaxies. The most extreme of these are exceptionally faint in the optical but readily detected in 24 surveys carried out with Spitzer/MIPS (Rieke et al. 2004). For example, Dey et al. (2008) selected a population of Dust-Obscured Galaxies (DOGs) from the Boötes field of the NOAO Deep Wide-Field Survey (NDWFS; Jannuzi & Dey 1999) via the criteria Vega mag and mJy (see also Houck et al. 2005; Fiore et al. 2008). Drawing on Spitzer/IRS (Houck et al. 2004) redshifts (this work and Houck et al. 2005), near-infrared groundbased spectra (Brand et al. 2007a), and optical spectra (Desai et al. 2008), Dey et al. (2008) find that DOGs have a broad redshift distribution centered at . These redshifts imply enormous luminosities, similar to and even exceeding those of local ULIRGs and distant submillimeter galaxies. While DOGs are rare (2600 are found over the 9 square degrees of the Boötes field), Dey et al. (2008) estimate that they contribute a quarter of the infrared luminosity density at . In addition, their space densities (Dey et al. 2008) and clustering properties (Brodwin et al. 2008) have led to the suggestion that DOGs may be evolutionarily related to both coeval SMGs and the most massive local galaxies.
However, the properties of DOGs must be studied more thoroughly before any possible relationships to other populations can be firmly established. One of the most basic unresolved issues is whether the enormous luminosities of DOGs are powered predominantly by star formation or AGN activity. The optical through mid-infrared SEDs (Dey et al. 2008) of the DOGs that are brightest at 24 tend to resemble power-laws, as expected for AGN-dominated sources. In contrast, the fainter DOGs include a larger fraction of sources featuring a bump at rest-frame 1.6 . This bump is characteristic of old stellar populations. Its detectability indicates limited AGN activity because an AGN would result in extra flux at rest-frame 2.5 , thereby masking the bump.
Follow-up data for the bright ( mJy) power-law DOGs support the interpretation that they are AGN-dominated. IRS spectroscopy reveals absorbed power-laws in the mid-infrared, as expected for AGN (Houck et al. 2005; Weedman et al. 2006). Near-infrared spectroscopy of a small sample of bright power-law DOGs indicates that they host powerful AGN (Brand et al. 2006). Similarly, the far-infrared SEDs of bright DOGs are similar to the AGN-dominated local ULIRG Mrk 231 (Tyler et al. 2009). The morphologies of bright power-law DOGs have also been examined (Melbourne et al. 2009, 2008; Bussmann et al. 2009; Dasyra et al. 2008), and they tend to be more compact than their fainter counterparts, as expected for AGN versus starforming regions.
Because they are relatively more difficult to observe, there has been less follow-up of the faint ( mJy) bump DOG population. A stacking analysis shows that their far-infrared properties are consistent with star-formation, and similar to SMGs (Pope et al. 2008). However, X-ray stacking analyses have provided mixed results (Fiore et al. 2008; Pope et al. 2008). Not many IRS spectra of faint bump DOGs exist. Pope et al. (2008) found that 12 out of 70 DOGs in the GOODs field have serendipitous IRS spectra. The sources lie in the range . Of these, half show PAH features with equivalent widths suggesting that they are dominated by star formation in the mid-infrared. The PAH-rich sources tend to be the fainter ones ( mJy) and have IRAC SEDs that deviate from a power law. In addition, IRS spectra exist for infrared bright galaxies with a range of 24 flux densities that display the 1.6 stellar bump but do not necessarily meet the DOG criterion because they are too bright in the optical (Huang et al. 2009; Farrah et al. 2008; Yan et al. 2007). These spectra indicate that the presence of the bump is correlated to the presence of PAH features in the IRS spectrum, suggesting that bump sources have mid-infrared emission dominated by star formation.
Given the potential importance of the DOG population in general, and the fact that the DOG population grows with decreasing 24 flux density, detailed study of the faint bump DOGs is necessary. The first step in this process is building a statistically significant sample of bump DOGs with redshifts for follow-up study (for example, with Herschel). Here we present IRS spectra for an additional 23 faint bump DOGs. The 20 of these for which we were able to determine redshifts make up 23% of the 86 sources used in the redshift distribution of Dey et al. (2008).
This paper is organized as follows. In §2, we describe our observational data and selection critera. In §3 we present our results, namely the redshifts of our targets, the composite IRS spectrum, and their bolometric luminosities. We discuss these results in §4 and summarize in §5. In the following, we use km s-1 Mpc-1, , and .
2. Observational Data and Target Selection
We targeted galaxies for mid-infrared IRS spectroscopy based on multiwavelength imaging of the 9.3 deg2 Boötes field of the NDWFS. In the following subsections, we describe the survey data, our strategy for selecting high-redshift starforming ULIRGs, the IRS spectroscopy of these ULIRGs, and follow-up observations at 70 and 160 .
2.1. Multiwavelength Imaging of the Boötes Field of the NOAO Deep Wide-Field Survey
The 9.3 deg2 Boötes field of the NDWFS111See http://www.noao.edu/noao/noaodeep/ for more information regarding the depth and coverage of the NDWFS. has been imaged in the , , , and bands down to 5 point-source depths of 27.1, 26.1, 25.4, and 19.0 Vega mags, respectively. Additional imaging at the and bands was obtained for 4.7 deg2 of the Boötes field through the FLAMEX survey (Elston et al. 2006). Approximately 8.5 deg2 of the Boötes field has also been mapped (PID 30) with the Infrared Array Camera (IRAC; Fazio et al. 2004) on board the Spitzer Space Telescope (Werner et al. 2004a). The 5 point-source depths of the IRAC Shallow Survey are 6.4, 8.8, 51, and 50 Jy at 3.6, 4.5, 5.6, and 8 , respectively (Eisenhardt et al. 2004). Approximately 8.74 deg2 of the Boötes field has been imaged with the Multiband Imaging Photometer for Spitzer (MIPS; Rieke et al. 2004). The 1 point-source depths of the MIPS survey are 0.051, 5, and 18 mJy at 24, 70, and 160 , respectively. Approximately 7 deg2 have been observed at 1.4 GHz with the Westerbork Synthesis Radio Telescope (WRST). The data are characterized by a 13″ 27 beam and a 1- limiting sensitivity of 28 Jy (de Vries et al. 2002). Although both a reduced mosaic and a catalog have been made publically available222http://wwww.astron.nl./wow/testcode.php?survey=5, we performed our own photometry on the reduced mosaic to ensure proper deblending for each IRS target.
2.2. Selection of high-redshift starforming ULIRGs
Our goal was to select starforming ULIRGs at for follow-up mid-infrared spectroscopy with the IRS. Based on previous mid-infrared, near-infrared, and optical spectroscopy, we have established that a selection criterion of Vega mag results in sources at (Dey et al. 2008; Desai et al. 2008; Brand et al. 2007b; Houck et al. 2005). Given both the sensitivity limits of the IRS and our desire to select high-luminosity sources, we only considered objects satisfying mJy. Finally, we chose sources that display a rest-frame 1.6 stellar photospheric feature in their IRAC SEDs. A prominent 1.6 bump suggests a limited contribution from AGN-heated hot dust, implying that the luminosity of the source is primarily generated by star formation. In order to choose the best candidates, we eliminated sources that were undetected in any of the IRAC channels.
We adopted Arp 220 as a template for identifying sources with a prominent 1.6 stellar bump. We varied only the template normalization and redshift in order to fit our Arp 220 template to the four IRAC flux densities of our sample sources. We also fit a power-law to these flux densities. If the best power-law model provided a better fit than the best Arp 220 model, we rejected the candidate. If the best-fitting Arp 220 model corresponded to a photometric redshift less than 1.5, we also rejected the source.
For the remaining sources, we tested the dependence of the best-fit photometric redshift on photometry errors by performing Monte Carlo simulations. For each of 500 trials, we randomly perturbed the four observed IRAC flux densities. The sizes of the perturbations were based on Gaussian distributions centered on the observed flux densities and with dispersions equal to the reported 1 photometric errors. In this way, we generated an approximate photometric redshift probability distribution for each source.
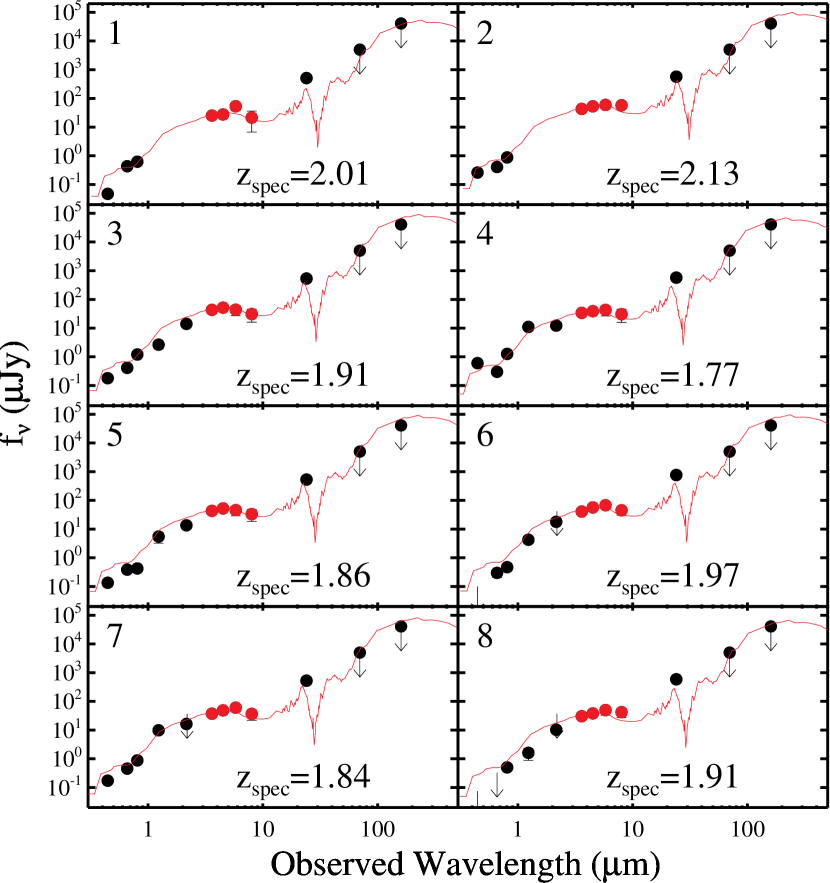
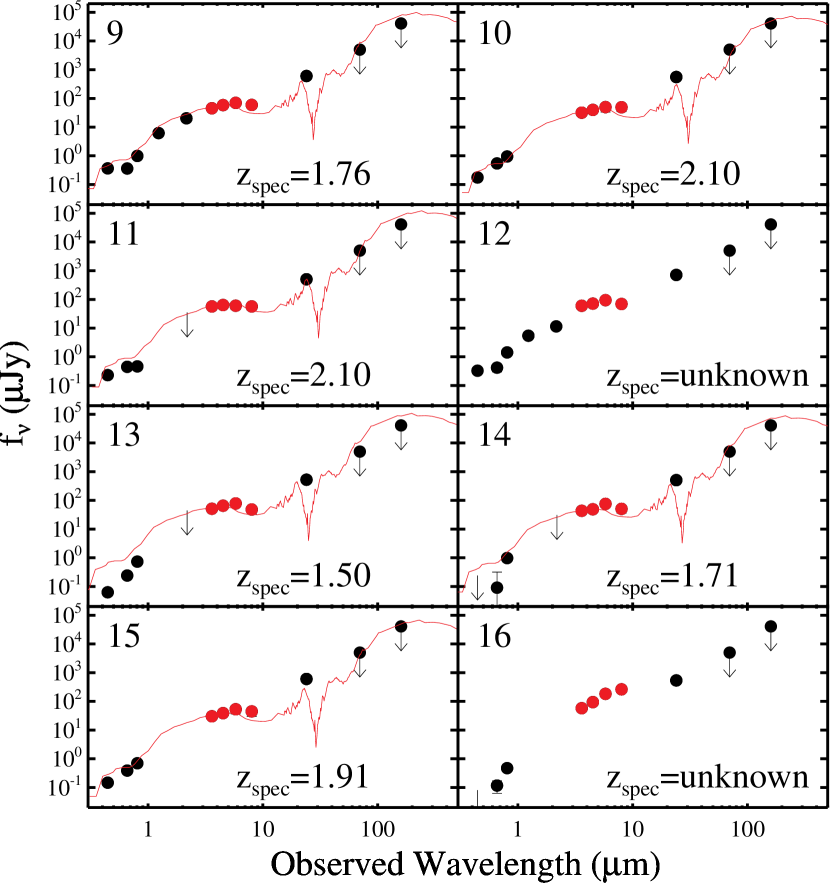
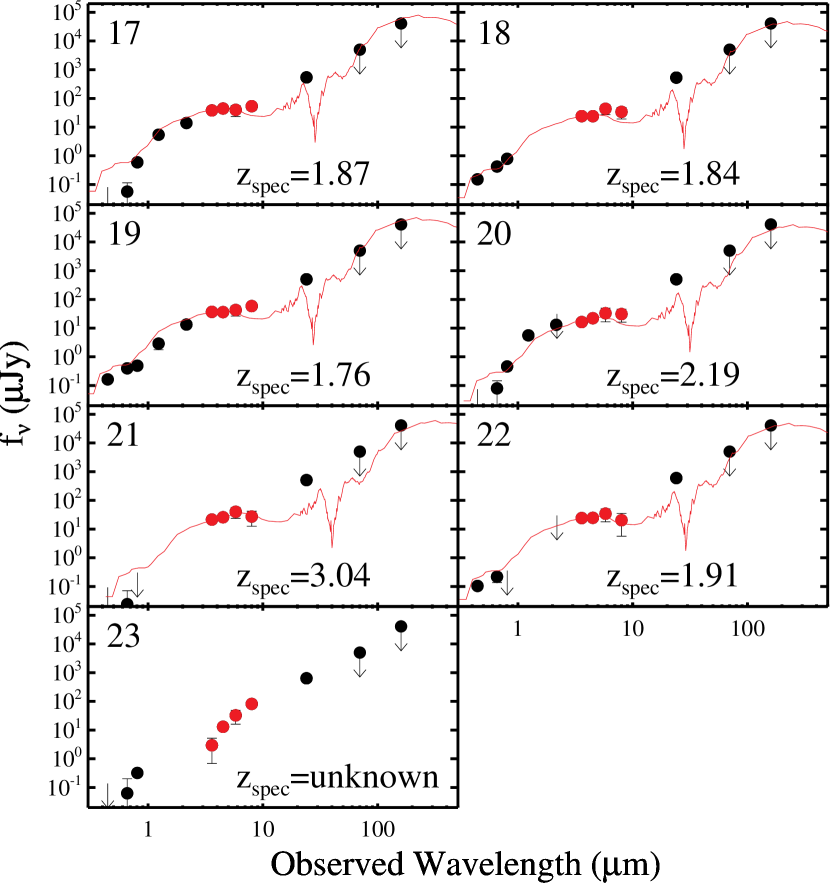
The full SEDs and photometric redshift probability distributions for each source were visually inspected. Based on these, a total of 23 sources were selected for follow-up IRS spectroscopy. Their positions are listed in Table Strong PAH Emission from ULIRGs11affiliation: Based on observations made with the Spitzer Space Telescope, operated by the Jet Propulsion Laboratory under NASA contract 1407., their photometric properties are summarized in Table Strong PAH Emission from ULIRGs11affiliation: Based on observations made with the Spitzer Space Telescope, operated by the Jet Propulsion Laboratory under NASA contract 1407., and their SEDs are shown in Figure 1. The first fifteen sources were chosen based upon the tightness of their redshift probability distributions (favoring sources with the highest signal-to-noise photometry). The last eight sources had broad photometric redshift probability distributions, but were chosen because they had a significant probability of lying at .
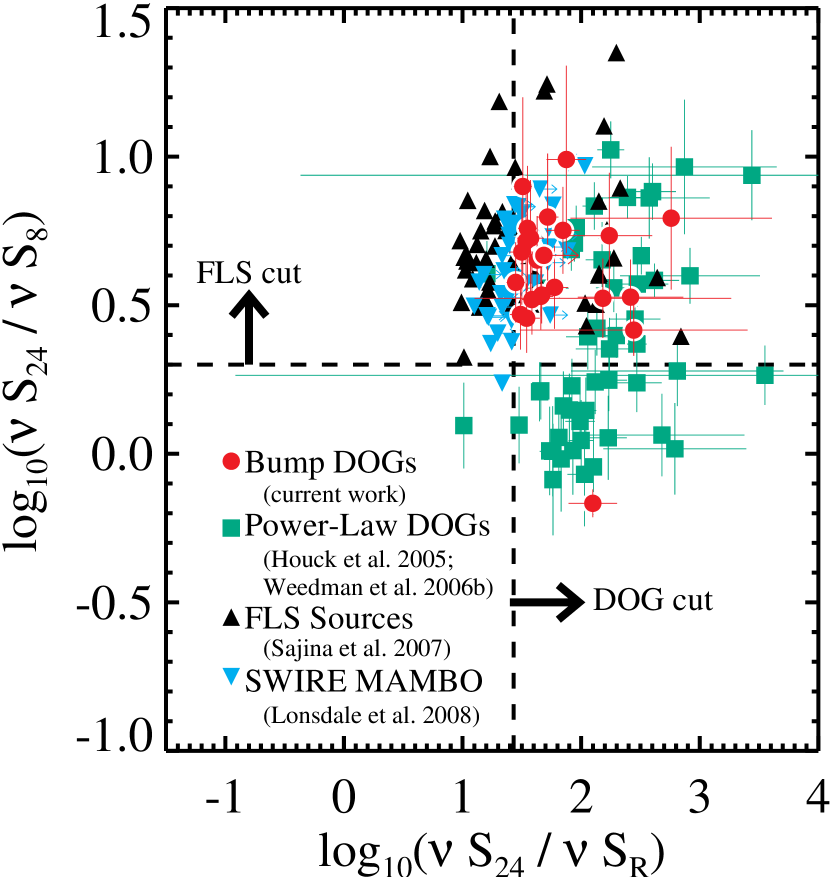
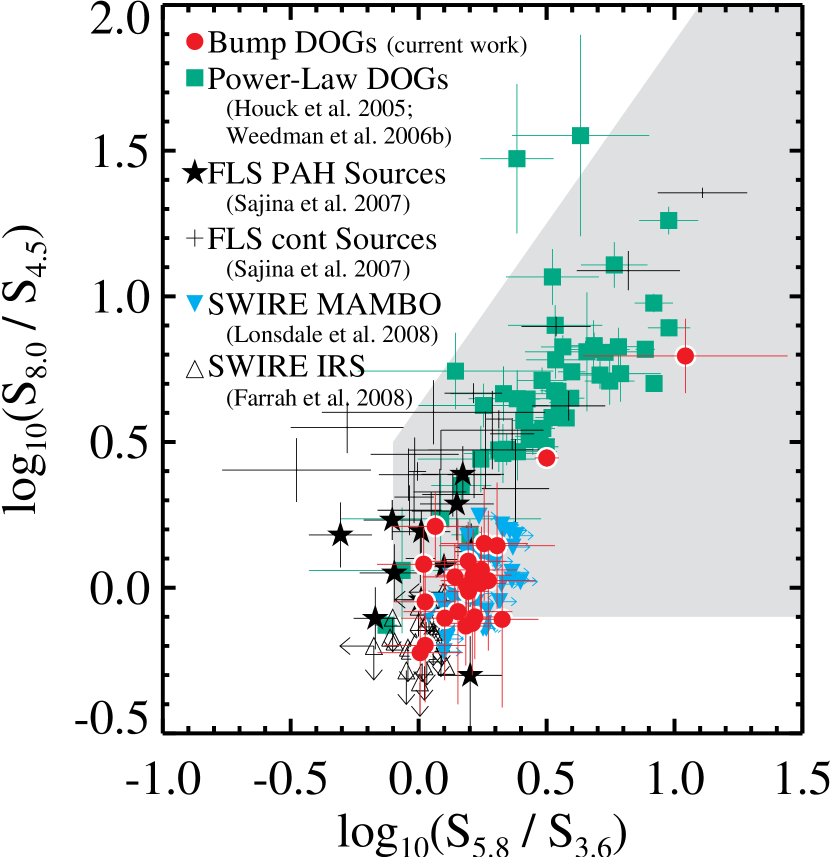
Dey et al. (2008) find that the DOG selection picks out about 50% of the ULIRGs at . We now explore how our present sample of bump DOGs compares to other galaxies that have been selected for follow-up with the IRS. These include sources detected in Boötes (Houck et al. 2005; Weedman et al. 2006), the First Look Survey (FLS; Yan et al. 2005; Sajina et al. 2007) and SWIRE (Farrah et al. 2008; Lonsdale et al. 2008). The Boötes IRS targets cited above satisfy the same color cut, but are brighter ( mJy) than the current sample. Although they were selected without regard to IRAC SED shape, the bright 24 flux density cut resulted in the vast majority having power-law SEDs through the IRAC bands. The FLS sample consists of bright ( mJy) 24 sources with less extreme infrared-to-optical flux density ratios than we imposed. Also, the FLS sample satisfied a cut of to try to select for starforming, rather than AGN-like, sources. The SWIRE sample was selected to have mJy and strong 1.6 stellar bumps peaking in IRAC channel 2 (“bump-2” sources). Figure 2 shows versus for these different samples. Our sample has similar values of compared to the FLS and SWIRE samples. This is not surprising since all three programs were designed to select starforming ULIRGs (see also Brand et al. (2006)). However, the brighter Boötes samples of Houck et al. (2005) and Weedman et al. (2006) extend to lower values of . This is consistent with their IRS spectra being primarily AGN-like.
IRAC color-color diagrams have been used by various groups (e.g. Lacy et al. 2004; Stern et al. 2005; Sajina et al. 2005) to determine the origin of the mid-infrared luminosity of galaxies. In particular, these groups have defined a wedge-shaped region of this diagram that is populated predominantly by AGN. Figure 3 shows one version of the IRAC color-color diagram and the AGN wedge, along with data from the current sample and for several comparison samples. Most of the previously-published Boötes sources have AGN-like IRAC colors, consistent with their AGN-like IRS spectra. The FLS sample includes some sources in the AGN wedge, but has a higher fraction of sources that are blue in . The former tend to have AGN-like IRS spectra, and the latter tend to have PAH-rich IRS spectra. Our sample also has very blue colors. It occupies a similar color-color space as the “bump-2” SWIRE sources, which have PAH-rich IRS spectra. This plot indicates that the ULIRGs with the lowest values of are the most likely to have mid-infrared luminosities dominated by star formation. The sources with low values of are those in which the 8 flux turns over, indicating the presence of a 1.6 stellar bump and a lack of AGN-heated hot dust. Conversely, sources with larger values of have an AGN-heated hot dust component which elevates the observed 8 flux density. These sources are more likely to have mid-infrared luminosities dominated by AGN activity. Although we did not explicity include a selection criterion, there are no bump DOGs with mJy in our 24 catalog that have colors bluer than those in our sample. This is likely due to our bump selection criterion, where the bump is detected in the 4.5 or 5.8 band.
2.3. Spectroscopic Observations and Data Reduction
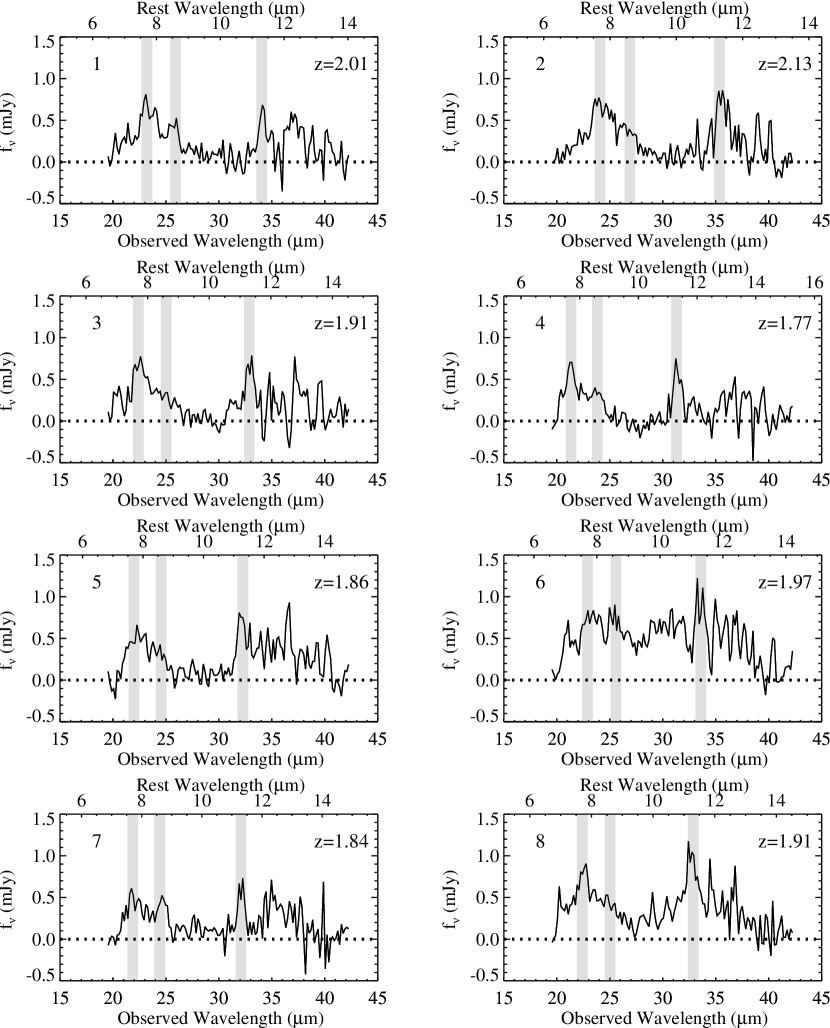
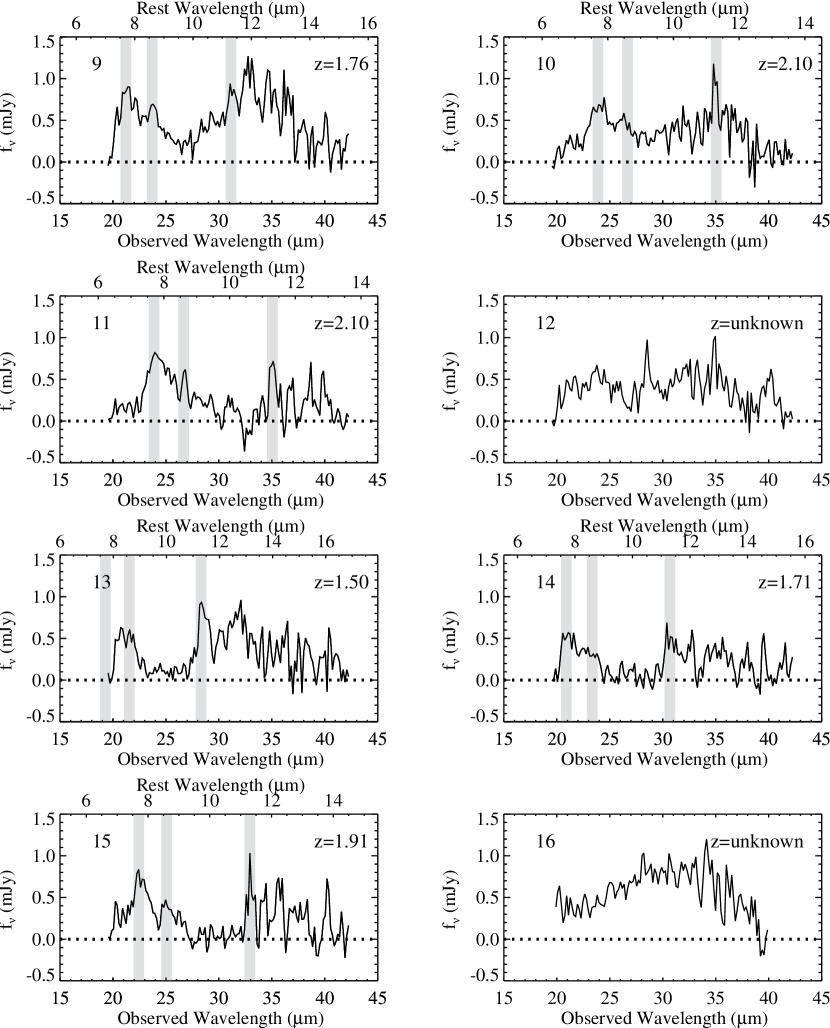
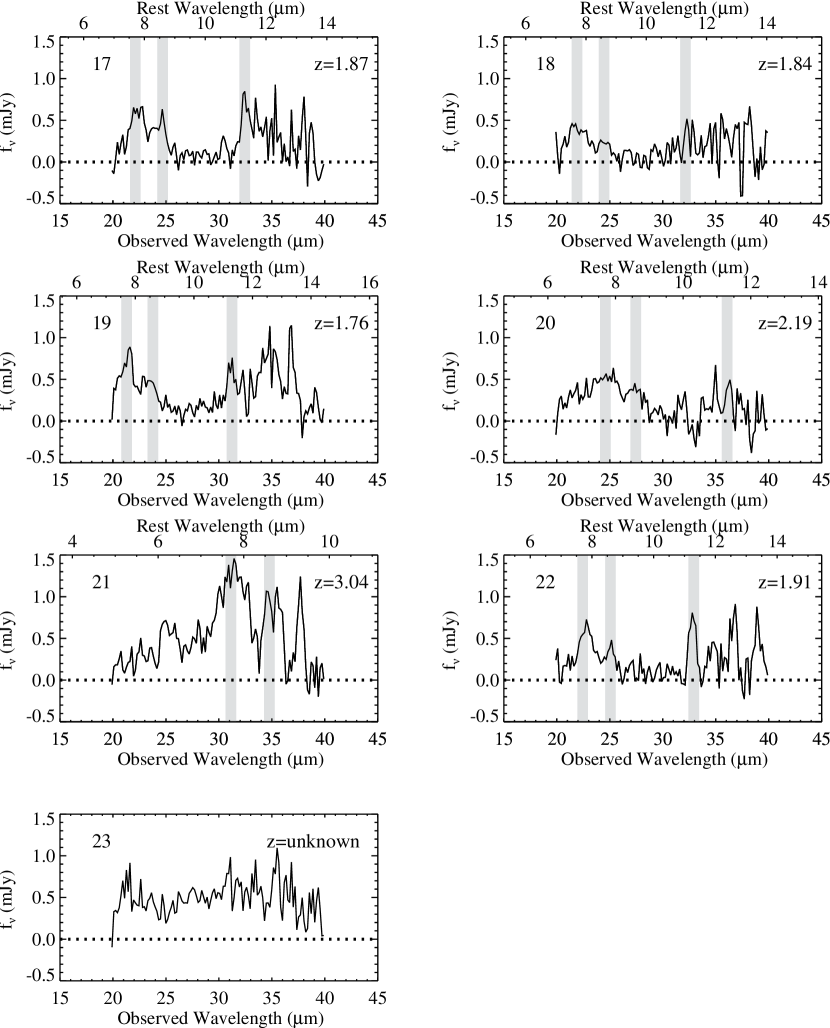
Mid-infrared spectra of the 23 candidates described in §2.2 were obtained with the IRS on board Spitzer. The candidates (the first 15 in Table Strong PAH Emission from ULIRGs11affiliation: Based on observations made with the Spitzer Space Telescope, operated by the Jet Propulsion Laboratory under NASA contract 1407.) were observed in program 30334 and the higher redshift candidates (the last eight in Table Strong PAH Emission from ULIRGs11affiliation: Based on observations made with the Spitzer Space Telescope, operated by the Jet Propulsion Laboratory under NASA contract 1407.) were observed in program 40441. We observed each of our targets with the Long-Low 1 (LL1) module, which provides wavelength coverage between . At the photometric redshifts of our targets, this allows us to detect at least the 7.7 PAH emission complex, which is the strongest of the various PAH complexes.
The IRS has two observing modes: staring and mapping. For faint point sources like ours, mapping mode is recommended (see the January 2006 Spitzer memo entitled Report on ultradeep IRS spectroscopy of faint sources). We therefore used mapping mode to take spectra of each of our targets in 4 different positions along the slit. We first acquired a nearby, bright 2MASS star, and then offset to the science target. We chose the longest available ramp time (120 seconds) to minimize overhead. We used a parallel step size of 33 arcseconds for 4 roughly equally-spaced steps along the slit. The number of cycles per position ranged from 7 to 18, depending on the 24 flux density and the expected redshift of the source. The effective exposure times ranged from 853 to 2194 seconds.
The raw data were processed by the S13 pipeline at the Spitzer Science Center. The pipeline performed ramp fitting, dark sky subtraction, droop correction, linearity correction, flat fielding, and wavelength calibration. See the IRS Data Handbook333http://ssc.spitzer.caltech.edu/irs/dh/ for more details on these steps. The resulting data products are known as the Basic Calibrated Data (BCD). In the following we describe additional processing of the two-dimensional spectra (residual charge removal, rogue pixel interpolation, and sky subtraction) and spectral extraction.
Although the detector is reset prior to each integration, a small fraction (1–2%) of the charge persists between frames. If no bright sources are observed, then the zodiacal background will be the major contributor to the residual charge. Over long AORs, the residual charge can build to a significant level, and must be removed. We subtracted the background in each BCD by subtracting off the median of the counts in pixels 25 through 58 (inclusive) of each row. These pixels were chosen because they are unaffected by source flux.
We interpolated over unstable (“rogue”) pixels in the background-subtracted frames. A mask of known rogue pixels is provided by the SSC, and we identified further bad pixels from the data themselves. We used the IRSCLEAN program provided by the SSC to find rogue pixels in the 2D data, using the default settings. We further searched for pixels with abnormally high variance () with time. Pixels were also masked if either the background or the noise surpassed a certain threshhold (1000 for both). All masked pixels were interpolated over using IRSCLEAN.
Once the 2D images were cleaned of rogue pixels, we created sky images from the data. The background for each target position was computed by taking the median of the cleaned images for all of the other positions.
The individual reduced frames were coadded to produce final 2D spectra at each map position. One dimensional spectra were extracted at each map position using the SPICE software provided by the SSC. The optimal extraction option was used. When this option is set, an extraction aperture is not set. Instead, each pixel is weighted by its position, based on the spatial profile of a bright calibration star. After extraction, we are left with 4 1D spectra per source. These were averaged together to produce the final 1D spectrum.
The signal-to-noise of the resulting spectra is difficult to quantify because of the lack of continuum. We estimate a noise level of 0.1–0.2 mJy by measuring the dispersion in the residuals of each spectrum after subtracting off the smoothed composite spectrum (see Section 3.2).
2.4. Pointed MIPS 70 and 160 observations and reduction
Although the multiwavelength survey of the entire Boötes field does include Spitzer MIPS 70 and 160 observations, these are too shallow to provide interesting limits on the far infrared SEDs of the DOGs. The 3- limits are 15 and 54 mJy at 70 and 160 , respectively. We therefore obtained deeper, pointed observations of these sources (program 30519, PI Le Floc’h). The data were reduced using version 3.06 of the MIPS Data Analysis Tool (DAT; Gordon et al. 2007). None of our sources were detected at either 70 or 160 . In §3.3 we show that the 70 non-detections are consistent with expectations based on low-redshift templates with IRS spectra similar to these higher-redshift sources. We used the following procedure for determining limits at both wavelengths.
For the 70 data, aperture photometry was performed at the position of the MIPS 24 source, using a 16 radius aperture, an 18 radius inner sky annulus, and a 39 outer sky annulus. We applied the aperture correction tabulated in the MIPS Data Handbook. We also measured the dispersion resulting from performing similar measurements over empty areas of the 70 micron images. The adopted 3 limit (5 mJy) is taken as three times this dispersion.
For the 160 data, aperture photometry was performed at the position of the MIPS 24 source, using a 32 radius aperture, a 64 inner sky annulus, and a 128 outer sky annulus. We applied the aperture correction tabulated in the MIPS Data Handbook. The limit was calculated in the same way as for the 70 data. In this case, the limit turned out to be 30 mJy, but was very uncertain due to the small number of pixels in the 160 images. To be conservative, we adopted the higher limit of 40.8 mJy predicted by the Spitzer SENS-PET.
3. Results
The IRS spectra of our 23 targets are shown in Figure 4. Strong PAH features are common in this sample, especially when compared to the brighter ULIRGs observed by the IRS in Boötes (Houck et al. 2005; Weedman et al. 2006).
In this section we first describe how we determined the spectroscopic redshifts of these sources. We then use these spectroscopic redshifts to present the composite spectrum of the sources with measured redshifts. From the composite spectrum, we measure the characteristic 7.7 PAH equivalent width. Finally, we estimate the bolometric and rest-frame 24 luminosities of these sources, so that they may be easily compared with other samples, both coeval and at low redshift.
3.1. Redshifts
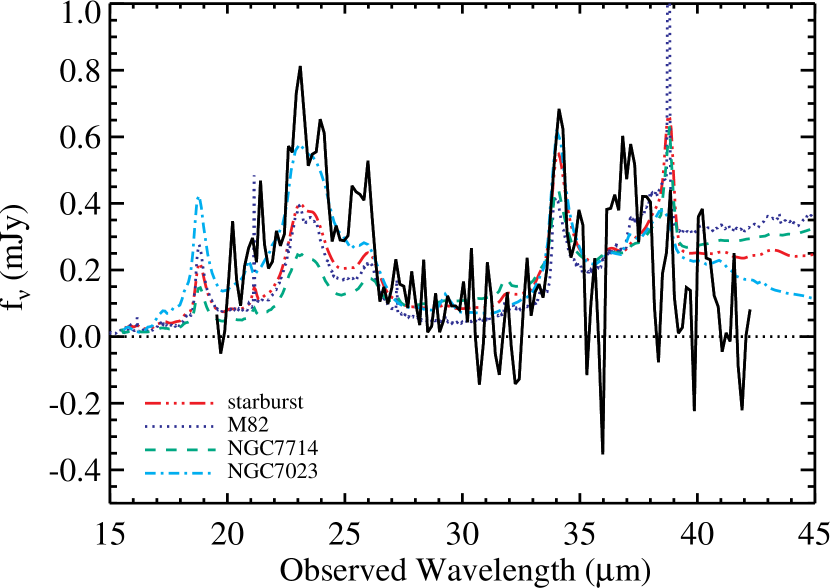
Many of the spectra displayed in Figure 4 contain at least one PAH emission feature (centered at rest-frame 6.2, 7.7, or 11.3 ) from which we can determine a redshift. Because these PAH features are fairly broad and the spectra are of only moderate signal-to-noise, we choose to measure the redshift using templates rather than fitting the lines individually. We use four templates that contain strong PAH features: the unobscured Galactic reflection nebula NGC 7023, which represents a pure photo-dissociation region (Werner et al. 2004b); the average starburst spectrum of Brandl et al. (2006); and the prototypical starbursts NGC 7714 (Brandl et al. 2004) and M82 (Sturm et al. 2000). Figure 5 shows an example of our redshift determination. After computing the best-fit redshift resulting from each template, we adopt the redshift associated with the template that provides the best formal fit. In 12 cases, this was NGC 7023; in four cases this was the average starburst spectrum; in three cases this was NGC 7714; and in one case this was the M82 template. We were unable to determine a spectroscopic redshift for three sources because they had no strong features. The adopted redshift for each source is listed in Table Strong PAH Emission from ULIRGs11affiliation: Based on observations made with the Spitzer Space Telescope, operated by the Jet Propulsion Laboratory under NASA contract 1407.. For a given source, all of the templates provided very similar redshifts. The redshift errors presented in Table Strong PAH Emission from ULIRGs11affiliation: Based on observations made with the Spitzer Space Telescope, operated by the Jet Propulsion Laboratory under NASA contract 1407. are based on the range of redshifts computed for a given source. The average redshift of sources in our sample is , and the dispersion is 0.30.
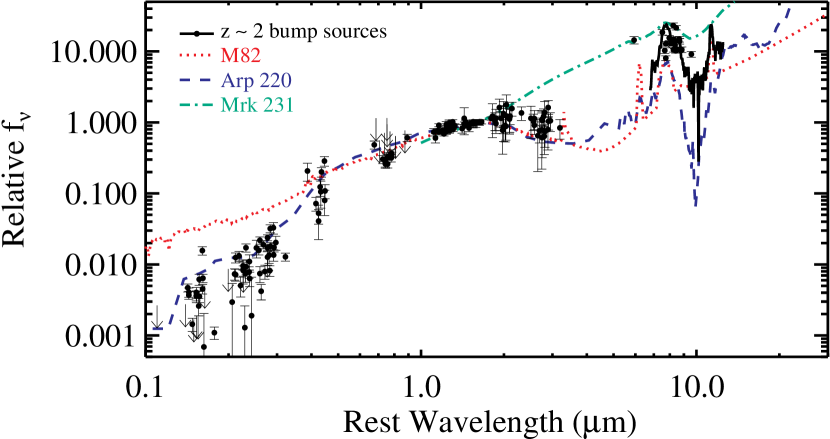
Figure 6 presents the rest-frame SEDs, scaled to unity at 1.6 , of all 20 sources with spectroscopic redshifts. For comparison, we overplot the SEDs of M82 (Sturm et al. 2000), Arp 220 (Armus et al. 2007), Mrk 231 (Armus et al. 2007). The SEDs of the starforming ULIRGs most closely resemble that of Arp 220, in terms of their colors. The SEDs of our sample appear to be much more strongly reddened than that of M82. Again, this is unsurprising given the selection criterion Vega mag. Also as expected, the SEDs of the high-redshift ULIRGs are significantly colder than that of Mrk 231. The exception is Source 21 at . Its observed-frame 24 (rest-frame 5.9) flux density is more consistent with the Mrk 231 template than that of Arp 220.
3.2. Composite spectrum
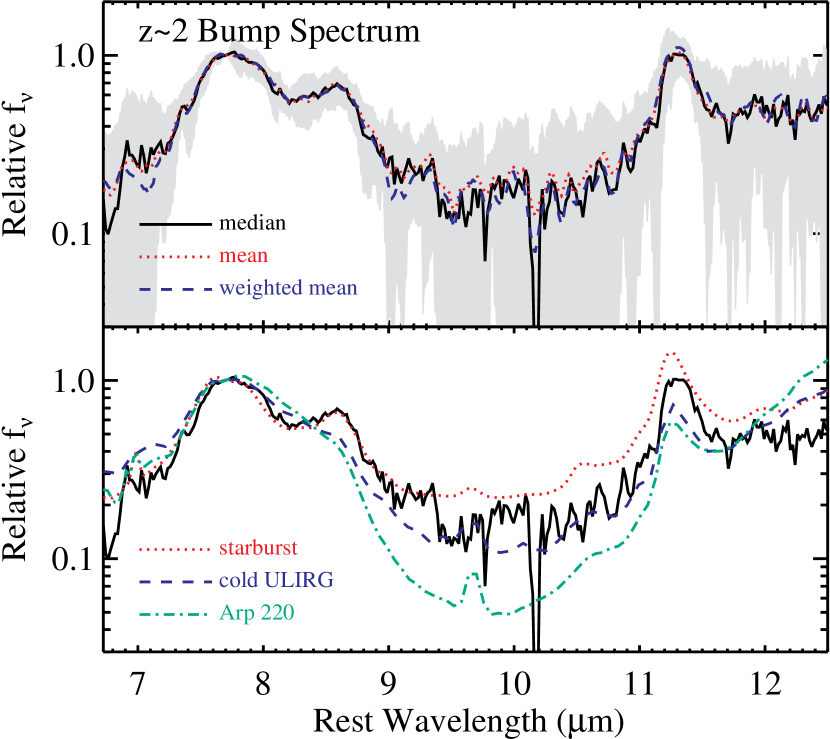
Because the signal-to-noise ratio of any individual spectrum in Figure 4 is fairly low, we provide three composite spectra in Figure 7: the median, the mean, and the variance-weighted mean. To compute the composite spectra, we shifted the wavelengths of each spectrum to the rest-frame, based on the redshifts calculated in §3.1; sampled the rest-frame wavelengths to a common grid; and normalized each spectrum to unity at 7.7 .
The median spectrum shows strong PAH features at 7.7, 8.6, and 11.3 . In the bottom panel of Figure 7, we compare this median spectrum to an average starburst spectrum compiled by Brandl et al. (2006), to a median cold () ULIRG spectrum compiled by Desai et al. (2007a), and to the spectrum of Arp 220 (Armus et al. 2007). The wavelength range between 9 and 11 can be strongly affected by a broad silicate absorption feature centered at 9.7 . Unfortunately, the limited wavelength range of our spectra prevent an accurate determination of the unabsorbed continuum level, and we are therefore unable to precisely quantify the depth of the silicate absorption. However, Figure 7 suggests that this absorption is comparable to that of local ULIRGs with cold SEDs.
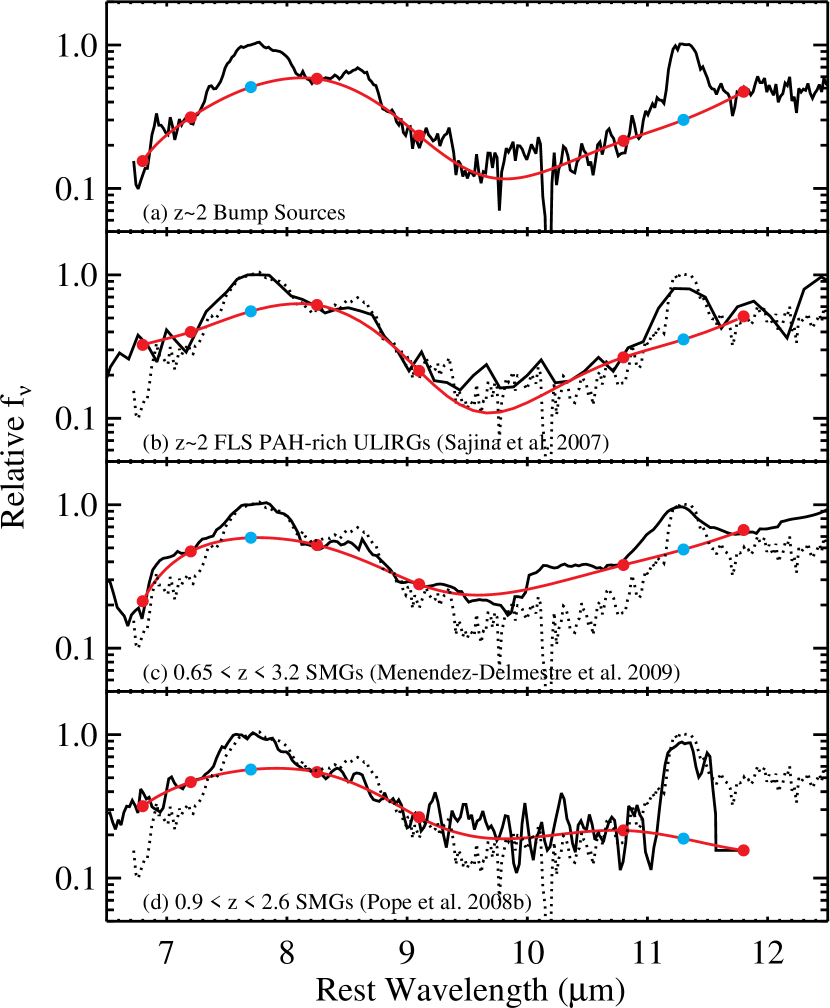
In Figure 8 we compare the median mid-infrared spectrum of our starforming DOGs to those of other high-redshift galaxies observed with the IRS (obtained via private communication). The first comparison sample is a subset of the Spitzer-selected ULIRGs detected in the First-Look Survey (Yan et al. 2005; Sajina et al. 2007). Of 48 targets spanning the redshift range , 25% show strong PAH features. The average strong-PAH spectrum is shown in the second panel of Figure 8.
The second comparison sample consists of 24 SMGs (23 detected), with 19 displaying PAH features, in the redshift range (Menéndez-Delmestre et al. 2009). Of these, 19 display prominent PAH emission. The composite spectrum from this sample is shown in the third panel of Figure 8.
The third comparison sample consists of 13 GOODS-N submillimeter galaxies in the redshift range (Pope et al. 2008). Of these, 11 have mid-infrared luminosities dominated by PAH emission. The composite PAH-rich spectrum from this sample is shown in the fourth panel of Figure 8.
Although Figure 7 provides the visual impression that the bump DOGs have mid-infrared spectral properties intermediate between those of local cold ULIRGs and local starburst galaxies, we wish to measure the equivalent widths of the PAH emission to facilitate a quantitative comparison to other samples. Three PAH emission features are clearly seen in Figure 7, including those centered at rest-frame 7.7, 8.6, and 11.3 . The 11.3 feature is strongly affected by the rest-frame 9.7 silicate feature. The other two features are close enough in wavelength that they are often measured together. We adopt this procedure and call the result the 7.7 PAH equivalent width. Because our spectrum has limited wavelength coverage, the continuum is quite difficult to determine. We therefore adopt an empirical method similar to that used by Spoon et al. (2007). The technique is illustrated in Figure 8. The resulting rest-frame equivalent width for the 7.7 PAH feature is 0.50.05 for our sample. Given the difficulties of this measurement, this is similar to the values of 0.40.05 that we find for the comparison samples. It is also similar to the values found for local starbursts (Brandl et al. 2006).
In addition to constructing a single composite spectrum, we also tried binning the spectra by observed properties to explore the variation within our sample. For example, a trend with spectral type and luminosity is observed in the local universe (see §4.2). It has also been seen in the sample of Sajina et al. (2007). However, we find no convincing correlation between spectral shape and in our sample (see §3.3 for derivation of luminosity). In both the low and high redshift samples where a correlation is seen, the scatter is very large, and can only be seen when comparing the full range of spectral types (AGN-dominated to starburst-dominated). Therefore, the lack of a correlation within our modest sample of primarily starburst-dominated sources is consistent with previous findings. We also explored spectral variations with the colors plotted in Figures 2 and 3, and found no convincing trends.
3.3. Luminosities
Given the redshifts calculated in §3.1 (), we can estimate the infrared luminosities of our sources. Our estimates are necessarily crude because we currently have no direct flux measurements at wavelengths that probe the expected peak ( rest-frame 70 ) of the spectral energy distributions of our sources. Our longest wavelength photometric detection comes from Spitzer MIPS observations in the 24 band, which corresponds to a rest-frame of 8.4 for these sources. Although we have 70 and 160 observations (corresponding to rest-frames 24 and 55 , respectively), these provide only limits, not detections (see §2.4).
Given our lack of direct constraints on the far-infrared SEDs of our sources, we extrapolate from the rest-frame mid-infrared to determine L8-1000µm. There are a variety of bolometric correction factors calibrated on local sources (e.g. Caputi et al. 2007) and several families of templates (e.g. Chary & Elbaz 2001; Dale et al. 2005; Siebenmorgen & Krügel 2007; Rieke et al. 2009) that can be used to guide this extrapolation. Unfortunately, the resulting value of L8-1000µm can vary by a factor of 5 depending on which local relation or template is used (Dale et al. 2005; Caputi et al. 2007; Dey et al. 2008). Thus, it is important to choose local templates that are as similar as possible to the sample with unknown far-infrared SEDs.
A first pass with the starburst templates of Chary & Elbaz (2001) indicates that the bump DOGs have ULIRG luminosities. To refine our estimate of the bolometric luminosity, we therefore wish to use a local ULIRG sample for our extrapolation. The Spitzer IRS GTO Team obtained IRS spectra for 100 local ULIRGs spanning a range of infrared colors and luminosities (Armus et al. 2007; Desai et al. 2007a; Farrah et al. 2007; Spoon et al. 2007). We use this sample to estimate L8-1000µm using the following procedure. First, we fit each of the 107 GTO ULIRGs to the median spectrum shown in Figure 7. We then ranked the GTO ULIRGs according to how well they fit the median bump spectrum, as measured by the . We fit the first-ranked GTO ULIRG to each of the individual bump spectra, yielding infrared luminosities in the range . This variation is due both to the fact that the bump sources have a variety of 24 flux densities (from 0.5 to 0.75 mJy) as well as a range of redshifts (from 1.5 to 3.0). To examine the possible error in the value of for a given bump source, we calculated the range in that results from the most highly ranked 10, 25, and 50 local GTO ULIRGs. These result in ranges that are within a factor of 2, 3, and 3 of the best-fit . We estimate that the individual values of are good to a factor of 3. The results are listed in Table Strong PAH Emission from ULIRGs11affiliation: Based on observations made with the Spitzer Space Telescope, operated by the Jet Propulsion Laboratory under NASA contract 1407..
The radio fluxes and limits presented in Table Strong PAH Emission from ULIRGs11affiliation: Based on observations made with the Spitzer Space Telescope, operated by the Jet Propulsion Laboratory under NASA contract 1407. (see also §2.1) can also be used to constrain . At low redshift, a far-infrared-radio correlation has been observed to hold for a wide variety of galaxy types over four orders of magnitude in luminosity (e.g. de Jong et al. 1985; Helou et al. 1985; Condon 1992; Yun et al. 2001; Bell 2003). Such a correlation has also been observed at higher redshifts (; Gruppioni et al. 2003; Appleton et al. 2004; Frayer et al. 2006; Kovács et al. 2006). To illustrate the systematic uncertainties in using the far-infrared-radio correlation to estimate for our bump sources, we use two different calibrations of the correlation. The first calibration is that of Bell (2003), and is based on a sample of 164 local galaxies without signs of AGN activity. The second is by Kovács et al. (2006), and is determined from 15 high-redshift () SMGs. The high-redshift calibration yields smaller values (by a factor of 4) of for a measured radio flux. It is consistent with the findings of Murphy et al. (2008) for 11 SMGs out to . The infrared luminosities resulting from each calibration are presented in Table Strong PAH Emission from ULIRGs11affiliation: Based on observations made with the Spitzer Space Telescope, operated by the Jet Propulsion Laboratory under NASA contract 1407.. Despite the large uncertainties, the radio-derived luminosities are consistent with the interpretation that these sources are ULIRGs. Because a significant fraction of our sources have only radio limits, in the following we adopt the values of derived by extrapolating the IRS spectra of our sources using local ULIRG templates (column 2 of Table Strong PAH Emission from ULIRGs11affiliation: Based on observations made with the Spitzer Space Telescope, operated by the Jet Propulsion Laboratory under NASA contract 1407.).
If all of this luminosity is produced by star formation, this would correspond to star formation rates in the range 400–4000 M⊙ yr-1 (Kennicutt 1998). In reality, some fraction of this infrared luminosity is likely due to AGN activity. Unfortunately, given the limited wavelength range of our spectrum, we cannot disentangle the fraction of the mid-infrared luminosity that is contributed by star formation versus AGN activity. However, the AGN contribution is likely not dominant, since a strong power-law component would overwhelm both the 1.6 stellar bump and the PAH features. Although these estimates are uncertain, they indicate that the sources we have identified are extremely luminous, comparable to the coeval submillimeter galaxies. Another possibility is that the local templates differ significantly from our high-redshift sources in the far-infrared. Direct measurements at long wavelengths are needed to explore this possibility.
In §2.4, we described follow-up 70 and 160 follow-up observations of a subset of the sources presented in this paper. All were non-detections, with 3- limits of 5 and 40.8 mJy at 70 and 160 , respectively. If our sources are similar in luminosity to SMGs, then these limits should be consistent with the far-infrared SEDs measured for SMGs. Using the SMG SEDs presented in Figure 5 of Pope et al. (2008), we estimate that SMGs with 24 flux densities similar to our bump sources should have observed 70 flux densities of 2 mJy and 160 flux densities of 20 mJy. These estimates are below our detection limits, and thus our far-infrared non-detections are still consistent with SMG-like luminosities.
Similarly, the wavelength coverage of the available IRS spectra allows us to predict the 70 flux density that would be observed if the local GTO ULIRGs were shifted out to . Using the 10 GTO ULIRGs that provide the best fit to the median spectrum shown in Figure 7, we estimate mJy. Thus, the observed-frame far-infrared SEDs of our bump sources are consistent with low-redshift ULIRGs.
4. Discussion
4.1. Why does our selection of starforming ULIRGs lie within such a narrow redshift range?
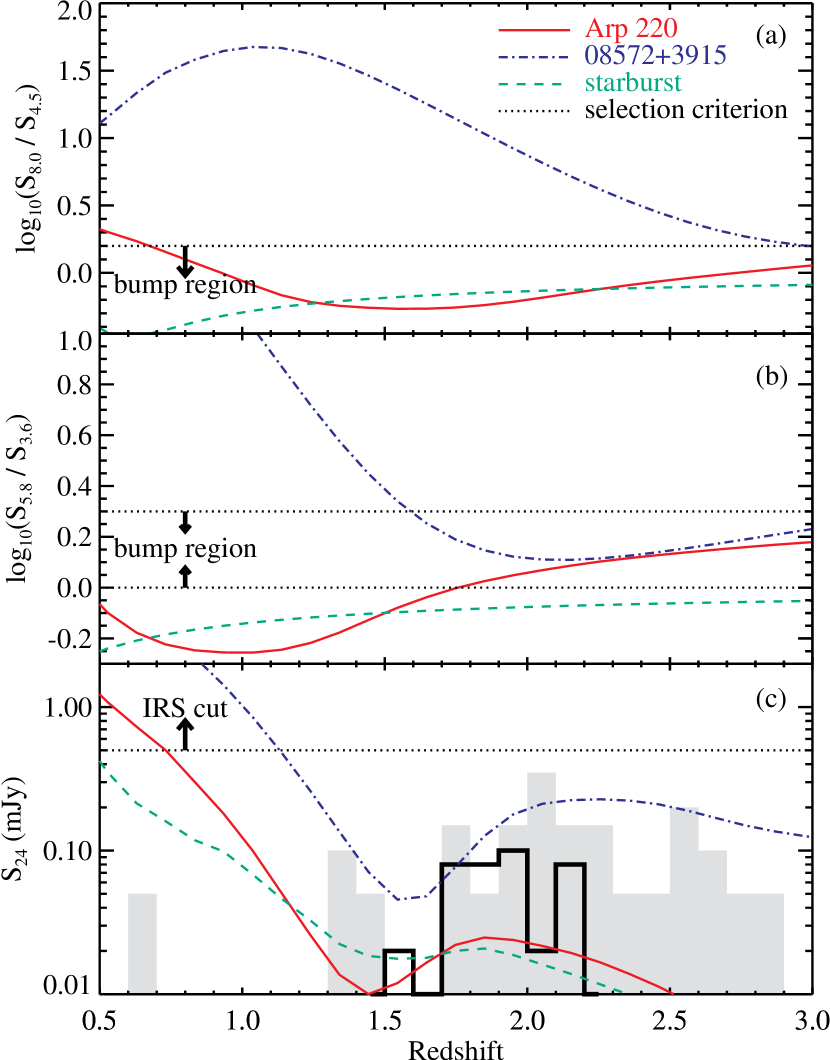
Table Strong PAH Emission from ULIRGs11affiliation: Based on observations made with the Spitzer Space Telescope, operated by the Jet Propulsion Laboratory under NASA contract 1407. shows that our sample of starforming ULIRGs has a very narrow range of redshifts: . We imposed two selection criteria which impact this distribution: (1) our requirement that we see the 1.6 stellar bump in the IRAC bands; and (2) our requirement that mJy. In this section, we explore how these criteria could have resulted in the observed narrow redshift distribution.
Based on local templates, is it plausible that requirement (1) results in the observed narrow redshift range? In Figure 3, we showed that requirement (1) translates roughly into selecting targets from a region of IRAC color-color space defined by and . In the top two panels of Figure 9, we plot the expected IRAC colors of three local templates as a function of redshift. The three templates span a range of properties: Arp 220 is PAH-rich ULIRG, 08572+3915 is a deeply obscured AGN-dominated ULIRG, and the starburst template is an average of lower-luminosity starbursts from Brandl et al. (2006). Figure 9 shows that Arp 220 meets requirement (1) over the redshift range , while 08572+3915 and local starbursts would never be identified as bump sources over the redshift range plotted. We conclude that our requirement of seeing the 1.6 bump in the IRAC bands selects for high redshift sources (), but can not by itself explain the narrowness of the resulting redshift distribution.
To investigate how requirement (2) affects the redshift range of our sources, we also show the expected 24 flux density of our three templates as a function of redshift in the bottom panel of Figure 9. All templates show a dip at . One cause for this dip is that the 24 bandpass is sampling the 9.7 silicate absorption feature at . In Arp 220 and in the starburst template, an additional reason for this dip is that the 24 bandpass samples the 8.6 and 11.3 PAH emission features at both higher and lower redshifts, respectively. In these two sources, the 7.7 and 8.6 PAH emission features passing through the 24 passband cause a peak at . The 24 flux density of the AGN-dominated ULIRG 08572+3915 does not fall as sharply at because of strong continuum emission longward of rest-frame 8.6 . Also shown in Figure 9 is the redshift distribution of the bump DOGs with IRS redshifts. The redshifts of the bump sources coincide with the peak seen in the Arp 220 template. This coincidence suggests that the narrow redshift distribution of the bump sources is due to the fact that they are preferentially detected over the redshift range where their PAH emission features are sampled in the 24 bandpass.
Figure 9 formally allows for the possibility of a significant population of bump DOGs at that are missed by our selection technique because there is no PAH feature in the 24 bandpass to boost the 24 flux density enough to meet our flux cut. However, there is a second reason why we do not see bump DOGs at . On average, bump sources that satisfy our 24 detection limit at () would have to be more luminous by a factor of 1.25 (2) compared to those at . Since the top end of the galaxy luminosity function typically declines exponentially, this could be the reason that we do not see exceptionally luminous DOGs powered by star formation at . Thus, both the mid-infrared spectral shape of starforming ULIRGs and the declining luminosity function at high luminosities are responsible for the decline in the redshift distribution at (and the resulting tightness of the redshift distribution). Which mechanism dominates is unclear from the data in hand.
In the bottom panel of Figure 9 we also show the redshift distribution of the bright ( mJy) power-law DOGs from Houck et al. (2005). For , this distribution tracks the profile of 08572+3915. At lower redshifts, sources become brighter in the -band, and fail to make our DOG cut. This suggests that the redshift distribution of power-law DOGs is determined in large part by the SED shape of AGN-dominated ULIRGs. The fact that power-law DOGs are found at greater redshifts than bump DOGs suggests that the luminosity function of power-law DOGs may be shifted to higher luminosities compared to bump DOGs. This is consistent with the observation that the most luminous ULIRGs in the local universe tend to be AGN-dominated (e.g. Veilleux et al. 1999; Tran et al. 2001; Desai et al. 2007a).
The presence of a bump in the IRAC SEDs allowed the selection of high-redshift () sources, but the additional requirement of a 24 detection tightly constrained the redshift distribution to , for the reasons described above. For example, Brodwin et al. (2006) use the optical, near-infrared, and IRAC data available in the Boötes field to compute photometric redshifts for a sample selected at 4.5 . They do not use the 24 flux densities. Using a hybrid method involving both neural net and template-fitting techniques (but no ULIRG templates), calibrated using over 15,000 spectra, they achieve an accuracy of for 95% of galaxies at and for 95% of AGN at . However, the photometric redshifts computed for the sample presented here range from , with an accuracy of . This shows that photometric redshifts that achieve high accuracy for the majority of objects do not perform nearly as well on these rare, extreme DOGs.
4.2. Comparison to Local ULIRGs
We intitially used Arp 220 as a template for selecting bump DOGs. Figure 6 illustrates that the SEDs of bump DOGs are consistent with that of Arp 220. However, Figure 9 shows that neither Arp 220 nor 08572+3915, if placed at , would be selected in this study. The reason for this is that they would be too faint at 24 , by factors of 25 and 2, respectively. Even if we scaled Arp 220 to match the observed 4.5 flux densities of our bump DOGs at , it would not make our 24 cut. In contrast, a scaled Mrk 231 at would. This implies that PAH features are not necessary to boost the observed-frame 24 flux density of a given source into our sample; continuum is sufficient. The fact that we see very few continuum-dominated sources in our bump sample implies that galaxies with only a small AGN contribution at observed 8 also have a limited AGN contribution at observed-frame 24 .
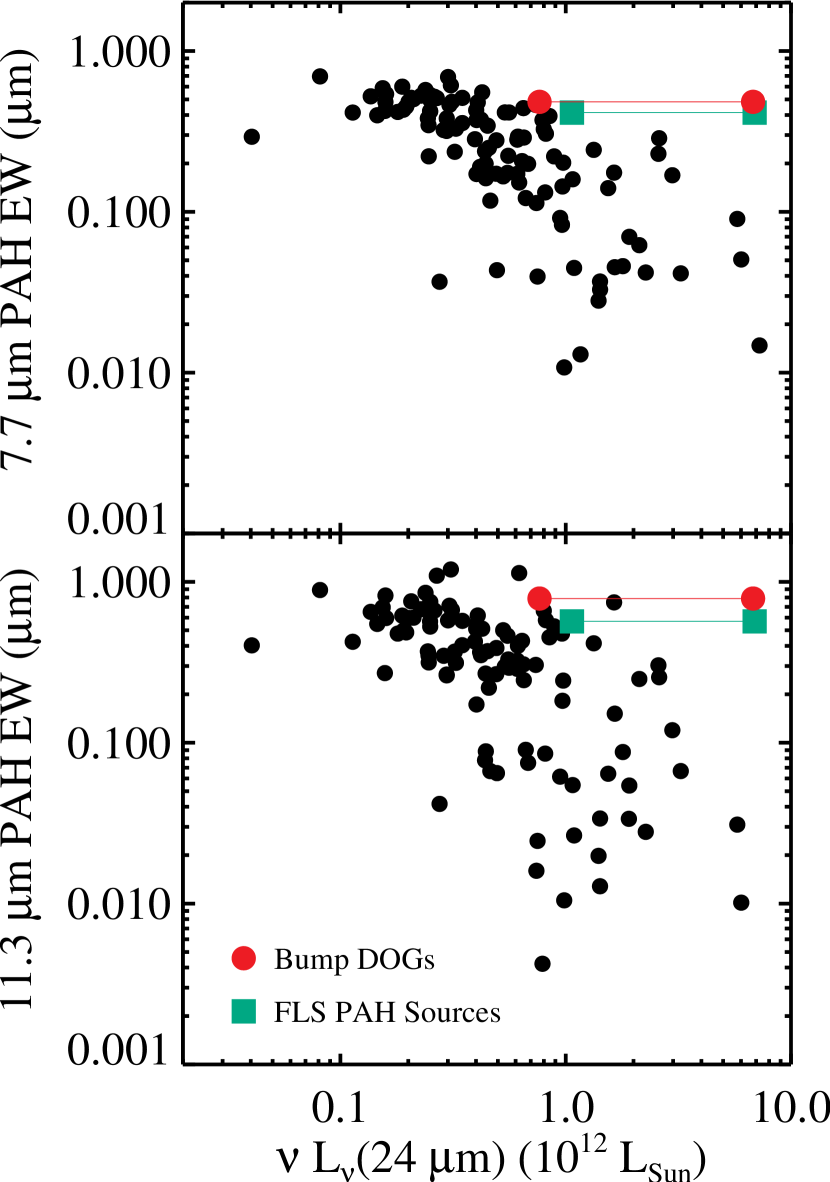
Figure 10 shows the rest-frame equivalent widths of the 7.7 and 11.3 PAH features as a function of rest-frame 24 luminosity for the bump sample, the PAH-rich Spitzer-selected FLS sample from Sajina et al. (2007), and for the 100 local ULIRGs from Desai et al. (2007a). This plot illustrates that the population of high-redshift starbursts that Spitzer is detecting includes galaxies that are uncommonly luminous at rest-frame 24 compared to ULIRGs in the local universe.
4.3. Why do bump sources have strong PAHs?
The existing IRS spectra of ULIRGs at indicate that prominent rest frame 1.6 stellar photospheric features are accompanied by large PAH equivalent widths. The corollary also holds: 24 sources with power-law rest frame near-infrared SEDs have small PAH equivalent widths.
This trend can be understood within a commonly accepted framework, wherein the rest-frame near-infrared and mid-infrared spectrum of a galaxy is a combination of three basic components: stars, the ISM, and an AGN (e.g. Huang et al. 2007). In galaxies selected by their colors, the SEDs of these components are also strongly affected by dust attenuation. Old stars have an SED resembling a blackbody that peaks at 1.6 in the rest frame and falls off steeply towards longer wavelengths. In contrast, dust-obscured young stars have an infrared SED which is characterized by mid-infrared PAH features with high equivalent widths and a broadband SED which rises steeply beyond 6 . Finally, the AGN contributes a power-law SED through the near- and mid-infared.
Within this framework, galaxies with an observable 1.6 stellar bump have a limited AGN contribution. In contrast, galaxies without an observable 1.6 bump have an AGN contribution which is large enough to disguise the underlying stellar emission by providing additional flux on its long-wavelength side (rest frame 2.5 ). If an AGN is emitting significantly at such short wavelengths, and if it has a power-law SED, then the expected flux at rest frame wavelengths of 8 would be even more significant. A strong AGN-heated dust component at 8 would increase the continuum under the PAH features. The result is a low equivalent width for PAH features in sources with weak 1.6 stellar bumps. Similarly, a source which does not have enough AGN-heated dust to swamp out the 1.6 stellar bump will not have enough AGN-heated dust to depress the equivalent width of the mid-infrared PAH features. In this scenario, the PAH features are diluted by AGN-heated smooth dust continuum. The degree of the dilution depends on the luminosity and extinction of the AGN relative to that of the starburst component. Teplitz et al. (2007) mix the SEDs of a local starburst (NGC 7714) and a pure QSO (PG 0804+761) to quantitatively explore how an AGN contribution affects both the 1.6 stellar bump and the PAH features. They find that a weak AGN contributing 10% of the total 1–1000 luminosity of a composite source can hide the 1.6 bump and decrease the PAH EQW by over 40%.
While it is generally agreed upon that weak PAH features indicate a strong AGN component, PAH dilution is not the only scenario that has been invoked as an explanation. It is also possible that PAH carriers are destroyed in the harsh radiation fields produced by AGN (Aitken & Roche 1985; Voit 1992). With the data in hand, we cannot distinguish between the dilution and destruction scenarios within the bump sources.
There is some evidence that PAH dilution occurs in local ULIRGs. Among local cold ULIRGs, the median 11.3 PAH equivalent width (EW) is 80% of that found in starburst galaxies, while the median 6.2 PAH EW is only 50% (Desai et al. 2007b). In the destruction scenario, the EWs of both PAH features should be reduced. However, the observation that the 11.3 PAH EW is more similar to the starburst value finds a natural explanation in the dilution scenario. Namely, the emission from the hot dust responsible for the dilution at 6.2 is highly extincted at 11.3 , due to the strong, broad absorption feature centered at 9.7 . Whether or not these results based on lower redshift ULIRGs apply to higher redshift samples remains an open question.
5. Conclusions
We have tested a technique for using mid-infrared photometry to select strongly starforming and highly obscured ULIRGs at . In a previous work, we demonstrated that the simple criteria Vega mag and mJy select for about half of the ULIRGs at (Dey et al. 2008). We refer to the resulting sample as Dust-Obscured Galaxies, or DOGs. Initial studies of the DOGs with the brightest 24 flux densities ( mJy) revealed AGN-dominated sources. In this paper, we attempted to select the most vigorously star-forming DOGs. Our technique was to search for DOGs whose IRAC (3–8 ) SEDs show evidence for the redshifted 1.6 stellar photospheric bump characteristic of old stars. Sources with strong AGN components should have enough hot dust to swamp this feature. Thus, sources with clear 1.6 bumps should have a limited AGN contribution to their mid-infrared luminosities. These sources are likely to be dominated by star formation. In addition to selecting for starforming galaxies, this technique also selects for galaxies at , since the 1.6 bump must be shifted into IRAC channels 2 or 3 (4.5 or 5.8 , respectively) in order to be easily detected. To test this selection, we obtained mid-infrared IRS spectroscopy of 23 candidate star-forming galaxies. Based on these data, we come to the following conclusions:
-
1.
Of 23 targets, 20 have mid-infrared spectra displaying PAH emission lines indicating that 1) these sources lie at with a dispersion of 0.3; and 2) these sources are strongly starforming. These results indicate that even for the most obscured galaxies, the rest-frame 1.6 stellar photospheric bump can be used to efficiently select starforming galaxies at . This redshift distribution implies that the space density of bump DOGs ( Vega mag, , ) is 7.5 10-5 Mpc-3, consistent with the space density of SMGs in GOODS-N (private communication; Wall et al. 2008).
-
2.
We have confirmed that DOGs with faint 24 flux densities are more likely to be starforming than brighter DOGs. Brand et al. (2006) used X-ray data to show that this is true for the general population of 24 sources. Dey et al. (2008) showed that the fraction of DOGs with AGN-like (power-law) IRAC SEDs smoothly decreases with decreasing 24 flux density. In this paper, we verify that DOGs which show evidence of the 1.6 stellar opacity feature in their mid-infrared photometry also show strong PAH emission, and appear to be powered principally by star formation.
-
3.
Local templates predict that our sample of starforming DOGs have infrared luminosities in the range (6–50) L⊙. If all of this luminosity is due to star formation, the star formation rates among our sample would be 1000–8500 M⊙ yr-1. AGN may be contributing to the total infrared luminosity, but the strong PAHs suggest that star formation dominates at least the mid-infrared luminosity. The unphysically large star formation rates implied may point to an evolution in the template from high to low redshift. This is also implied by the fact that starburst galaxies as luminous as those recently detectable by Spitzer are uncommon in the local universe (10). Other authors have found hints that this may be the case (e.g. Desai et al. 2007b; Rigby et al. 2008). While we have limits on the rest-frame 24 and 55 flux densities of these DOGs from MIPS 70 and 160 data, direct measurements of the far-infrared SEDs of high-redshift dusty galaxies are critical to determining their contribution to the global star formation rate at that epoch.
-
4.
The redshift distribution of bump DOGs is remarkably narrow because at , the strong 7.7 PAH feature boosts the 24 flux, pushing sources with insufficient continuum into our flux-limited sample. Analogously, the redshift distribution of power-law DOGs is dictated by the fact that sources with sufficient continuum to meet the 24 flux density cut fall out of the sample at , when the 9.7 absorption feature is in the 24 bandpass.
-
5.
The dearth of objects with the 1.6 stellar feature with AGN-like mid-infrared spectra indicates that objects lacking enough AGN emission at 2 to hide the stellar bump also lack an AGN powerful enough to dilute and/or destroy the PAH features.
6. Acknowledgments
We thank the anonymous referee for suggestions which improved this paper. Support for MB was provided by the W. M. Keck Foundation. AHG acknowledges support from an NSF Small Grant for Exploratory Research under award AST-0436681. This work made use of images and data products provided by the NOAO Deep Wide-Field Survey (Jannuzi & Dey 1999), which is supported by the National Optical Astronomy Observatory (NOAO). NOAO is operated by AURA, Inc., under a cooperative agreement with the National Science Foundation. The Spitzer MIPS and IRAC surveys of the Boötes region were obtained using GTO time provided by the Spitzer Infrared Spectrograph Team (PI: James Houck), M. Rieke, and the IRAC Team (PI: G. Fazio). IRAC is supported in part through contract 960541 issued by JPL. The IRS was a collaborative venture between Cornell University and Ball Aerospace Corporation funded by NASA through the Jet Propulsion Laboratory and the Ames Research Center. Support for this work by the IRS GTO team at Cornell University was provided by NASA through contract 1257184 issued by JPL/Caltech.
Facilities: Spitzer(MIPS, IRAC, IRS), Mayall(Mosaic-1), KPNO:2.1m(ONIS, SQUID, FLAMINGOS, FLAMINGOS-1)
References
- Aitken & Roche (1985) Aitken, D. K., & Roche, P. F. 1985, MNRAS, 213, 777
- Appleton et al. (2004) Appleton, P. N. et al. 2004, ApJS, 154, 147
- Armus et al. (2007) Armus, L. et al. 2007, ApJ, 656, 148
- Bell (2003) Bell, E. F. 2003, ApJ, 586, 794
- Brand et al. (2007a) Brand, K. et al. 2007a, ApJ, 663, 204
- Brand et al. (2007b) —. 2007b, ApJ, 663, 204
- Brand et al. (2006) —. 2006, ApJ, 644, 143
- Brandl et al. (2006) Brandl, B. R. et al. 2006, ApJ, 653, 1129
- Brandl et al. (2004) —. 2004, ApJS, 154, 188
- Brodwin et al. (2006) Brodwin, M. et al. 2006, ApJ, 651, 791
- Brodwin et al. (2008) —. 2008, ApJ, 687, L65
- Bussmann et al. (2009) Bussmann, R. S. et al. 2009, ApJ, 693, 750
- Caputi et al. (2007) Caputi, K. I. et al. 2007, ApJ, 660, 97
- Chary & Elbaz (2001) Chary, R., & Elbaz, D. 2001, ApJ, 556, 562
- Condon (1992) Condon, J. J. 1992, ARA&A, 30, 575
- Dale et al. (2005) Dale, D. A. et al. 2005, ApJ, 633, 857
- Dasyra et al. (2008) Dasyra, K. M., Yan, L., Helou, G., Surace, J., Sajina, A., & Colbert, J. 2008, ApJ, 680, 232
- de Jong et al. (1985) de Jong, T., Klein, U., Wielebinski, R., & Wunderlich, E. 1985, A&A, 147, L6
- de Vries et al. (2002) de Vries, W. H., Morganti, R., Röttgering, H. J. A., Vermeulen, R., van Breugel, W., Rengelink, R., & Jarvis, M. J. 2002, AJ, 123, 1784
- Desai et al. (2007a) Desai, V. et al. 2007a, ApJ, 669, 810
- Desai et al. (2007b) —. 2007b, ApJ, 660, 1151
- Desai et al. (2008) —. 2008, ApJ, 679, 1204
- Dey et al. (2008) Dey, A. et al. 2008, ApJ, 677, 943
- Eisenhardt et al. (2004) Eisenhardt, P. R. et al. 2004, ApJS, 154, 48
- Elston et al. (2006) Elston, R. J. et al. 2006, ApJ, 639, 816
- Farrah et al. (2007) Farrah, D. et al. 2007, ApJ, 667, 149
- Farrah et al. (2008) —. 2008, ApJ, 677, 957
- Fazio et al. (2004) Fazio, G. G. et al. 2004, ApJS, 154, 10
- Fiore et al. (2008) Fiore, F. et al. 2008, ApJ, 672, 94
- Frayer et al. (2006) Frayer, D. T. et al. 2006, AJ, 131, 250
- Gordon et al. (2007) Gordon, K. D. et al. 2007, PASP, 119, 1019
- Gruppioni et al. (2003) Gruppioni, C., Pozzi, F., Zamorani, G., Ciliegi, P., Lari, C., Calabrese, E., La Franca, F., & Matute, I. 2003, MNRAS, 341, L1
- Helou et al. (1985) Helou, G., Soifer, B. T., & Rowan-Robinson, M. 1985, ApJ, 298, L7
- Houck et al. (2004) Houck, J. R. et al. 2004, ApJS, 154, 18
- Houck et al. (2005) —. 2005, ApJ, 622, L105
- Huang et al. (2009) Huang, J. . et al. 2009, ArXiv e-prints
- Huang et al. (2007) Huang, J.-S. et al. 2007, ApJ, 664, 840
- Jannuzi & Dey (1999) Jannuzi, B. T., & Dey, A. 1999, in ASP Conf. Ser. 191: Photometric Redshifts and the Detection of High Redshift Galaxies, 111–+
- Kennicutt (1998) Kennicutt, R. C. 1998, ARA&A, 36, 189
- Kovács et al. (2006) Kovács, A., Chapman, S. C., Dowell, C. D., Blain, A. W., Ivison, R. J., Smail, I., & Phillips, T. G. 2006, ApJ, 650, 592
- Lacy et al. (2004) Lacy, M. et al. 2004, ApJS, 154, 166
- Lonsdale et al. (2008) Lonsdale, C. J. et al. 2008, ArXiv e-prints
- Melbourne et al. (2009) Melbourne, J. et al. 2009, AJ, 137, 4854
- Melbourne et al. (2008) —. 2008, AJ, 136, 1110
- Menéndez-Delmestre et al. (2009) Menéndez-Delmestre, K. et al. 2009, ArXiv e-prints
- Murphy et al. (2008) Murphy, E. J., Chary, R. ., Alexander, D. M., Dickinson, M., Magnelli, B., Morrison, G., Pope, A., & Teplitz, H. I. 2008, ArXiv e-prints
- Pope et al. (2008) Pope, A. et al. 2008, ApJ, 675, 1171
- Rieke et al. (2009) Rieke, G. H., Alonso-Herrero, A., Weiner, B. J., Pérez-González, P. G., Blaylock, M., Donley, J. L., & Marcillac, D. 2009, ApJ, 692, 556
- Rieke et al. (2004) Rieke, G. H. et al. 2004, ApJS, 154, 25
- Rigby et al. (2008) Rigby, J. R. et al. 2008, ApJ, 675, 262
- Sajina et al. (2005) Sajina, A., Lacy, M., & Scott, D. 2005, ApJ, 621, 256
- Sajina et al. (2007) Sajina, A., Yan, L., Armus, L., Choi, P., Fadda, D., Helou, G., & Spoon, H. 2007, ApJ, 664, 713
- Siebenmorgen & Krügel (2007) Siebenmorgen, R., & Krügel, E. 2007, A&A, 461, 445
- Spoon et al. (2007) Spoon, H. W. W., Marshall, J. A., Houck, J. R., Elitzur, M., Hao, L., Armus, L., Brandl, B. R., & Charmandaris, V. 2007, ApJ, 654, L49
- Stern et al. (2005) Stern, D. et al. 2005, ApJ, 631, 163
- Sturm et al. (2000) Sturm, E., Lutz, D., Tran, D., Feuchtgruber, H., Genzel, R., Kunze, D., Moorwood, A. F. M., & Thornley, M. D. 2000, A&A, 358, 481
- Teplitz et al. (2007) Teplitz, H. I. et al. 2007, ApJ, 659, 941
- Tran et al. (2001) Tran, Q. D. et al. 2001, ApJ, 552, 527
- Tyler et al. (2009) Tyler, K. D. et al. 2009, ApJ, 691, 1846
- Veilleux et al. (1999) Veilleux, S., Kim, D.-C., & Sanders, D. B. 1999, ApJ, 522, 113
- Voit (1992) Voit, G. M. 1992, MNRAS, 258, 841
- Wall et al. (2008) Wall, J. V., Pope, A., & Scott, D. 2008, MNRAS, 383, 435
- Weedman et al. (2006) Weedman, D. W. et al. 2006, ApJ, 651, 101
- Werner et al. (2004a) Werner, M. W. et al. 2004a, ApJS, 154, 1
- Werner et al. (2004b) Werner, M. W., Uchida, K. I., Sellgren, K., Marengo, M., Gordon, K. D., Morris, P. W., Houck, J. R., & Stansberry, J. A. 2004b, ApJS, 154, 309
- Yan et al. (2005) Yan, L. et al. 2005, ApJ, 628, 604
- Yan et al. (2007) —. 2007, ApJ, 658, 778
- Yun et al. (2001) Yun, M. S., Reddy, N. A., & Condon, J. J. 2001, ApJ, 554, 803
| Num | MIPS Name | z | templateaaThe local template spectrum that provided the best fit to the observed IRS spectrum. This fit was used to determine the redshift. | |
|---|---|---|---|---|
| 1 | SST24 J142920.1+333023.9 | 2.01 | 0.02 | NGC 7023 |
| 2 | SST24 J143458.9+333437.0 | 2.13 | 0.02 | NGC 7023 |
| 3 | SST24 J143324.3+334239.5 | 1.91 | 0.03 | NGC 7023 |
| 4 | SST24 J143137.1+334501.6 | 1.77 | 0.02 | NGC 7023 |
| 5 | SST24 J143349.6+334601.7 | 1.86 | 0.01 | starburst |
| 6 | SST24 J143503.2+340243.6 | 1.97 | 0.02 | NGC 7714 |
| 7 | SST24 J142832.4+340849.8 | 1.84 | 0.02 | NGC 7023 |
| 8 | SST24 J142941.1+340915.7 | 1.91 | 0.03 | starburst |
| 9 | SST24 J142951.2+342042.1 | 1.76 | 0.01 | NGC 7714 |
| 10 | SST24 J143321.8+342502.0 | 2.10 | 0.02 | NGC 7714 |
| 11 | SST24 J143502.9+342658.8 | 2.10 | 0.02 | NGC 7023 |
| 12 | SST24 J142600.6+343452.8 | |||
| 13 | SST24 J143152.4+350030.1 | 1.50 | 0.02 | NGC 7023 |
| 14 | SST24 J142724.9+350824.3 | 1.71 | 0.02 | NGC 7023 |
| 15 | SST24 J143331.9+352027.2 | 1.91 | 0.02 | NGC 7023 |
| 16 | SST24 J143143.4+324943.8 | |||
| 17 | SST24 J143020.5+330344.2 | 1.87 | 0.02 | NGC 7023 |
| 18 | SST24 J143816.6+333700.6 | 1.84 | 0.04 | NGC 7023 |
| 19 | SST24 J143216.8+335231.7 | 1.76 | 0.02 | M82 |
| 20 | SST24 J143743.3+341049.4 | 2.19 | 0.02 | NGC 7023 |
| 21 | SST24 J143702.0+344630.4 | 3.04 | 0.02 | starburst |
| 22 | SST24 J142652.5+345506.0 | 1.91 | 0.02 | starburst |
| 23 | SST24 J142637.4+333025.7 |
Note. — The MIPS name encodes the RA and Dec (J2000) of the 24 source.
Note. — All magnitudes are on the Vega system. All limits are 3- limits.
Note. — Source 1 through 15 were also the targets of pointed Spitzer/MIPS observations, all of which led to 3 upper limits of 5000 Jy and 40,800 Jy at 70 and 160 , respectively. See §2.4.