Scaling and memory in recurrence intervals of Internet traffic
Abstract
By studying the statistics of recurrence intervals, , between volatilities of Internet traffic rate changes exceeding a certain threshold , we find that the probability distribution functions, , for both byte and packet flows, show scaling property as . The scaling functions for both byte and packet flows obeys the same stretching exponential form, , with . In addition, we detect a strong memory effect that a short (or long) recurrence interval tends to be followed by another short (or long) one. The detrended fluctuation analysis further demonstrates the presence of long-term correlation in recurrence intervals.
pacs:
89.75.-k, 89.75.-Da, 89.20.-Hh, 05.40.-aMany complex systems are characterized by heavy-tailed distributions, such as power-law distributions Newman2005 , lognormal distributions Crow1988 , and stretched exponential distributions Laherrere1998 . These distributions imply a nontrivial probability of the occurrences of the extreme events. Statistical laws on these extreme events provides evidence for the understanding of the mechanism that underlies the dynamical behaviors of the corresponding complex systems. Recently, some typical complex systems, such as earthquakes Bak ; Corral1 ; Corral2 ; Corral3 ; Livina , financial markets Wang2001 ; Lillo ; Yamasaki ; Wang and many other natural hazards Bunde , have been widely investigated. Taking the earthquakes for example, excluding the well established Omori Law Omori and Gutenberg-Richter Law Gutenberg , the scaling law for temporal and spatial variability of earthquakes have been observed by Bak et al. Bak and Corral Corral1 ; Corral2 ; Corral3 , and the memory effect in the occurrence of the earthquakes is revealed by showing the statistics of the recurrence times above a certain magnitude Livina .
The Internet has been viewed as a typical complex system that evolves in time through the addition and removal of nodes and links, and empirical evidence has demonstrated its small-world and scale-free structural properties Faloutsos3 ; NJP . One of the research focuses, the Internet traffic, has been widely studied by computer scientists, physicists and beyond. For instance, Leland et al. first found the self-similar nature and long-range dependence of Ethernet traffic that have serious implications for the design, congestion control, and analysis of computer communication networks Leland . After that, several traffic models are proposed to understand the underlying mechanism for information transport and congestion control of the Internet traffic Taqqu6 ; Taqqu9 ; Taqqu10 , especially, those models (see Refs. Taqqu6 ; Taqqu9 about the models and the Ref. Taqqu10 about the time series analysis) can, to some extent, reproduce the self-similar nature of the Internet traffic, which indicates the existence of burstiness of traffic and the large volatility of traffic rate changes.

Herein we are interested in the large volatility that implies the suddenly drastic changes of traffic rate. In previous studies, by analyzing a set of time series data of round-trip time, Abe and Suzuki Abe1 ; Abe2 reported that the drastic changes, named of Internet quakes, are characterized with the Omori Law and Gutenberg-Richter Law. By statistical analysis on recurrence interval between the volatility of traffic rate changes exceeding a certain threshold , this Letter reports that: (i) the probability distribution functions (pdfs) for both byte and packet flows, rescaled by the mean recurrence interval , yield scaling property that the scaling function follows a stretching exponential form with for all data; (ii) a short/long recurrence interval tends to be followed by another short/long recurrence interval, implying a strong memory effect.
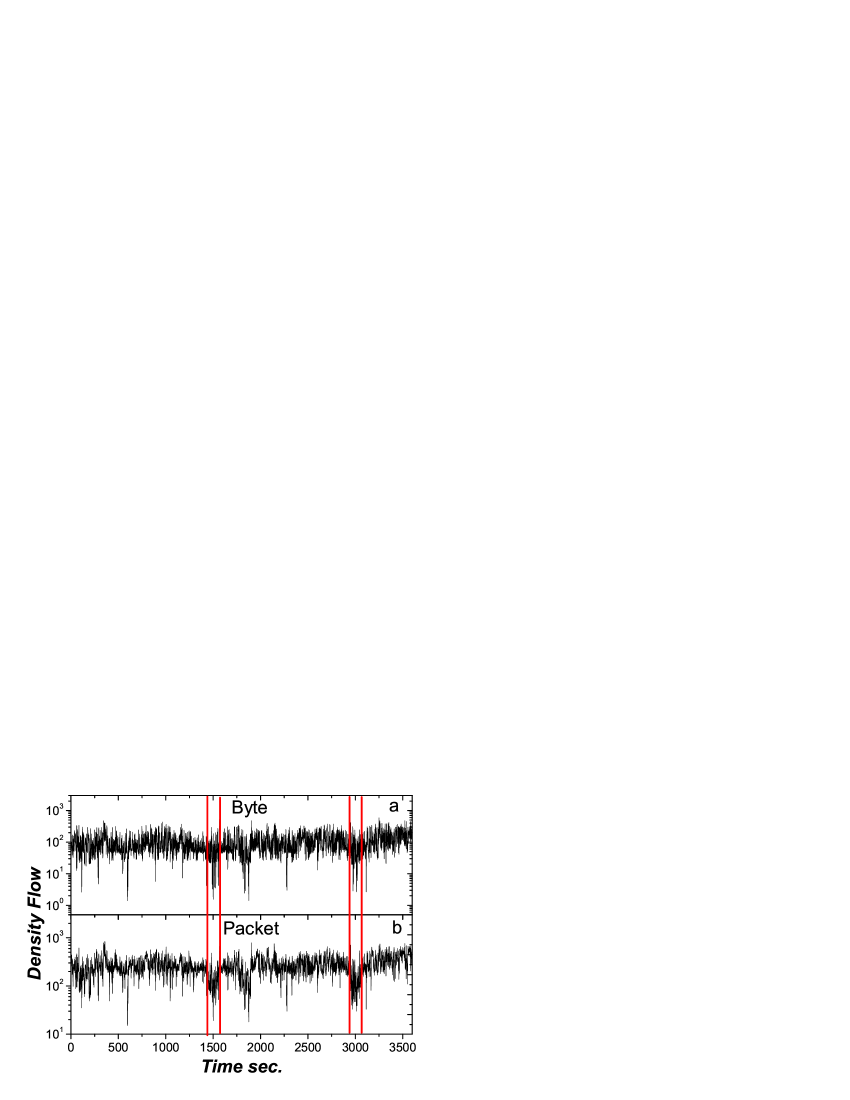
The data used in this paper are part of Ethernet traffic set collected at Bellcore. They correspond to one “normal” hour’s worth of traffic, collected every 10 milliseconds, hence resulting in a time series with a length of 360000. There are two types of measurements, recording the number of bytes and packets per unit time, respectively. The data and information can be found at the Internet traffic archive web2 . These data have been widely used and become the most important benchmark data in relevant areas. We firstly integrate the time series into a second resolution, that is, each integrated data point is an average of 100 original points. As shown in Fig. 1, the time series exhibit clustering phenomenon that is resulted from the traffic congestion in the Internet. For both byte and packet flows, we use the absolute value of changes, where denotes the data point at time , to quantify the volatility. It has been demonstrated that the pdf of decays in an asymptotic power-law form and the volatilities are long-term correlated Cai . We then normalize the volatility time series by the standard deviation . In this way, the threshold are in units of the standard deviation of the volatility. An illustration of recurrence interval is shown in Fig. 2.

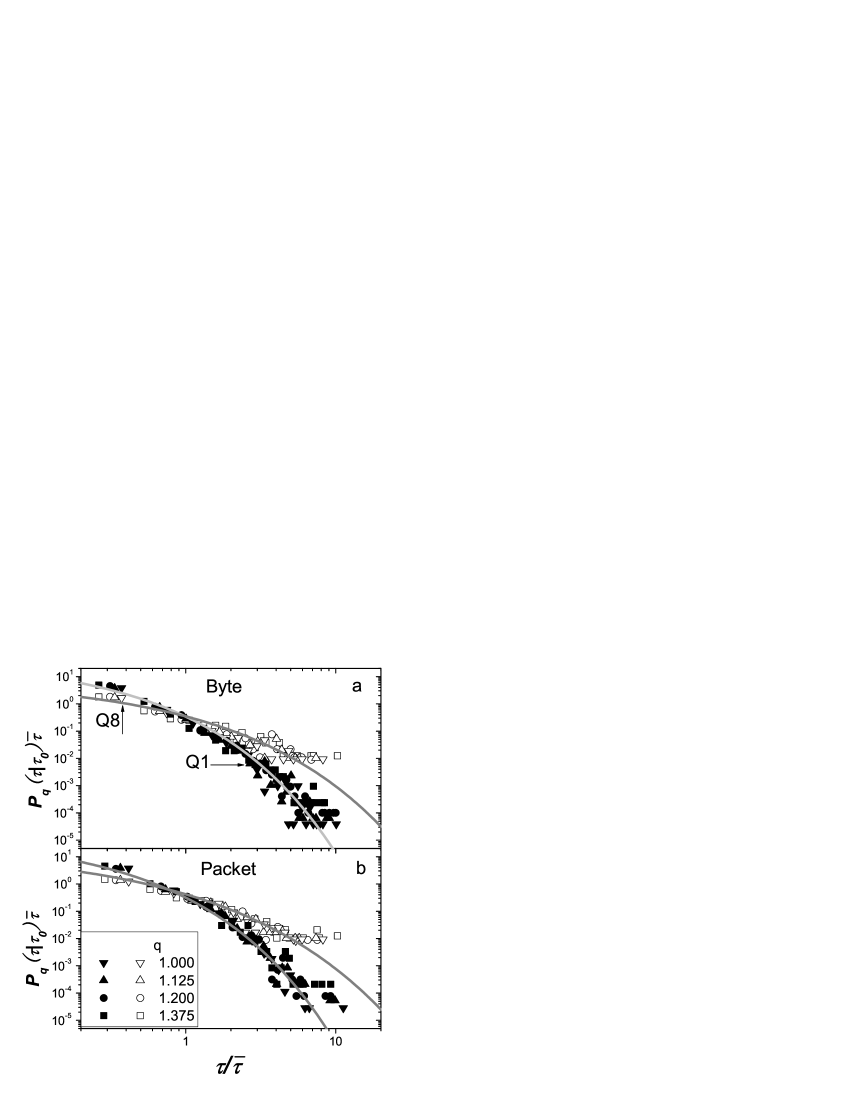
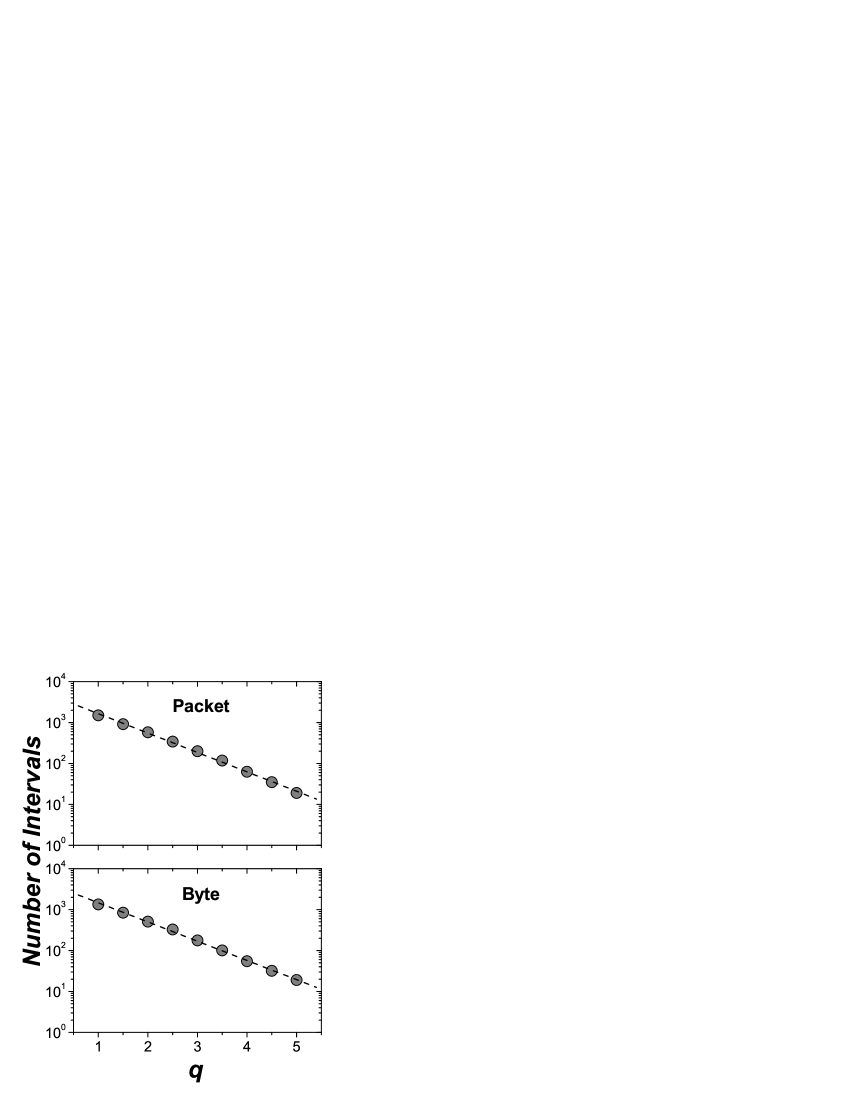
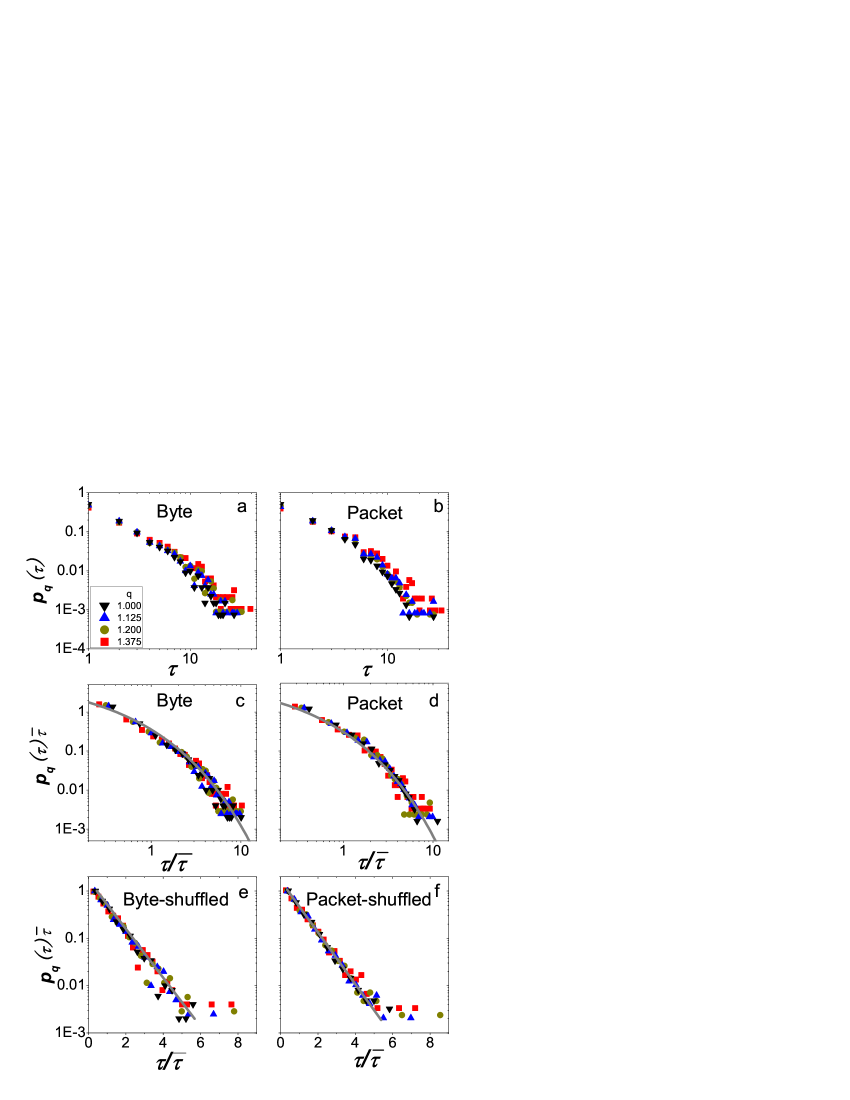
For the normalized data, the smaller value of threshold, , does not suggest the recurrence interval between the large volatilities (extreme events), therefore we concentrate on the cases with . As shown in Fig. 3, for both byte and packet flows, the number of recurrence intervals decays exponentially fast as the increasing of . For large , the results are inaccurate and incredible for the low statistics, and thus we mainly discuss the statistics for a very limited range of . Figure 4(a) and 4(b) present the behaviors of the pdfs, , for both byte and packet flows with different , which are obviously broader than the Poisson distributions as for uncorrelated data, and the pdf for larger decays slower than that for smaller . To understand how depends on , in Fig. 4(c) and 4(d), we show the rescaled pdfs, , for byte and packet flows as functions of the rescaled recurrence intervals . The data collapse to a single curve, indicating a scaling relation
| (1) |
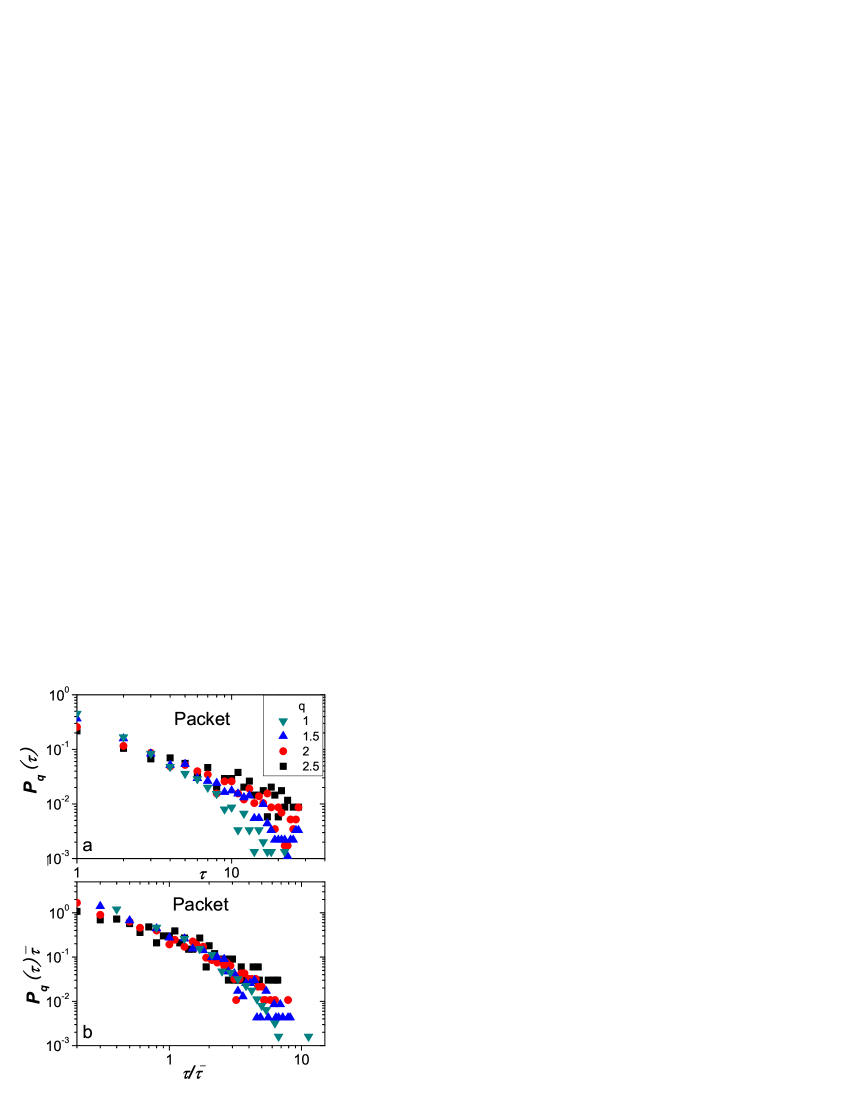
which suggests that the scaling function does not directly depend on the threshold but only through . Furthermore, as shown in Fig. 4(c) and 4(d), the scaling functions for both byte and packet flows follow the same stretching exponential form, with , indicating a possibly universal scaling property in the recurrence intervals of Internet traffic data (see also a similar scaling in the intertrade time in financial markets Ivanov2004 ). Therefore, one can estimate for an arbitrary with the knowledge of for a certain . This scaling property is particularly significant for the understanding of the statistics of large- case where the number of data is usually very small. Similar analysis for very large has also been done, as shown in Fig. 5, the rescaled distributions get much closer to each other than the original distributions. However, it is hard to tell whether these curves collapse a single master curve since the number of intervals for large is very small. Hereinafter, we focus on the statistics for .
The stretching exponential distributions of rescaled recurrence intervals suggest the existence of correlation of volatilities. In contrast, the recurrence intervals for uncorrelated time series are expected to follow a Poisson distribution, as . To confirm this expectation, the volatilities are shuffled to remove the correlations, and the resulting distributions, as shown in Fig. 4(e) and 4(f), decay in an exponential form, which is remarkably different from that of the real time series. Furthermore, the very short and very long recurrence intervals occur more frequently in the real data (see Fig. 4(c)-4(f)), indicating a burstiness of Internet traffic, similar as observed in many other complex systems Goh2008 .
The scaling property of of recurrence intervals only indicates the long-term correlations of volatility time series of traffic rate changes, but does not tell if the recurrence intervals are themselves correlated. To answer this question, we next investigate the memory effect in the recurrence intervals. Before that, we show a typical example of recurrence intervals for both byte and packet flows in Fig. 6(a) and 6(b), as well as the corresponding shuffled sequences in Fig. 6(c) and 6(d). Compared with the shuffled ones, the original data exhibit the clustering of large intervals, which indeed indicates the memory effect that a short (or long) recurrence interval tends to be followed by another short (or long) one.
To quantify the memory effect, we study the conditional pdf , representing the probability a recurrence interval, , immediately follows a recurrence interval, . If no memory effect exists, will be identical to and independent to . Therefore, we study not for a specific , but for a range of values. Analogous to the analysis of daily volatility return intervals Yamasaki , the data set of recurrence intervals are sorted in increasing order and divided into eight subsets, , , , , so that each subset contains of the total data. It makes the lowest recurrence intervals belong to , whereas the largest ones belong to , where denotes the total number of data points. Figure 7(a) and 7(b) show for byte and packet flows. The distribution corresponding to if obtained by recording all the values (they form a distribution) if their predecessor, is no less then the smallest interval in and no more than the largest interval in (see Ref. Yamasaki for more details). As shown in Fig. 7, the rescaled pdfs, for different , collapse into a single curve that can also be fitted by stretching exponential functions. The remarkable difference between the distributions with in and clearly demonstrated the existence of memory effect.
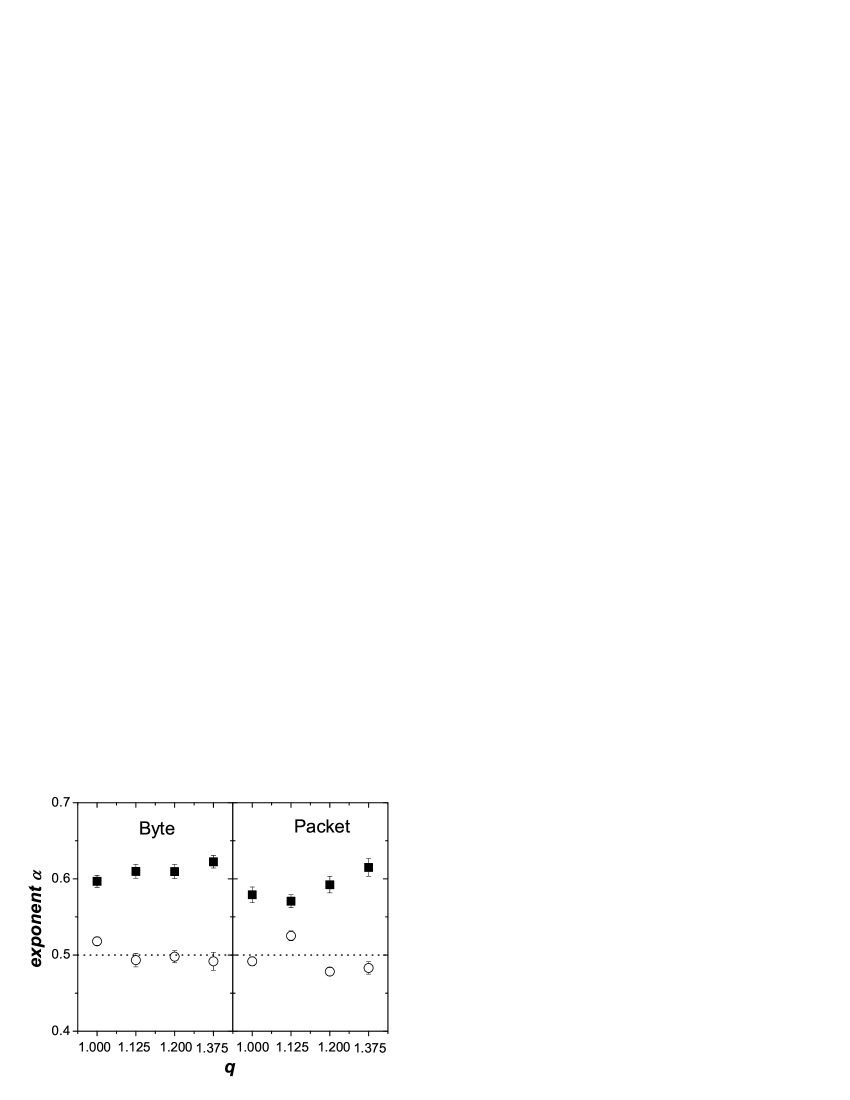
To check whether the memory effect is limited only to the neighboring recurrence intervals, we use the detrended fluctuation analysis (DFA), which is a benchmark method to quantify long-term correlations (see Ref. Peng1994 for the original method, as well as Ref. Hu2001 and Ref. Chen2002 for the effects of trends and nonstationarities, respectively). The fluctuation of a time series and window of seconds, computed by DFA, follows a power-law relation as . Uncorrelated time series corresponds to , while the larger (or smaller) indicates long-term correlation (or anti-correlation). Figure 8 shows the values of for recurrence intervals, which are all larger than 0.5 and of which mean value is with mean error , indicating the presence of long-term correlations in recurrence intervals. Furthermore, for the shuffled recurrence intervals, the long-term correlations are absent with (mean value is with mean error 0.007).
In summary, we have investigated the scaling and memory properties in recurrence intervals of the Internet traffic. The empirical pdfs for byte and packet flows, respectively, can fall into a single curve by rescaling with the mean recurrence intervals , as shown in Eq. (1). The scaling function has a stretching exponential form, as with for both byte and packet flows. This scaling property can be used to predict the occurrence probability of on rare events that correspond to large . We also detected the memory effect that a short (or long) recurrence interval tends to be followed by another short (or long) one, which is further demonstrated by the empirical results that the conditional pdf, , is strongly dependent on . Further more, by using the DFA method, we found that the recurrence intervals are indeed long-term correlated. Some recently reported empirical studies show that the Internet-based human activities exhibit burstiness and memory in temporal statistics, such as the web accessing Dezso2006 ; Goncalves2008 and on-line entertainment Zhou2008 . All those activities contribute some to the Internet traffic, and thus we think the analysis of the burstiness and memory of the Internet traffic itself can be considered as a valuable complementary work. More interestingly, the results suggest that the Internet shares some common properties with other complex systems like earthquake and financial market Wang2001 ; Lillo ; Yamasaki ; Wang , which gives support to the possibly generic organizing principles governing the dynamics of apparently disparate complex systems, as dreamed by Goh and Barabási Goh2008 .
This work is supported by the National Science Foundation of China under Grant Nos. 70671097, 60874090 and 10635040. S.-M.C. acknowledges the financial support of State 863 Projects (2008AA01A318).
References
- (1) M. E. J. Newman, Contemporary Physics 46, 323 (2005).
- (2) E. L. Crow and K. Shimizu, Lognormal distributions: theory and applications (Marcel Dekker Inc., New York, 1988).
- (3) J. Laherrere and D. Sornette, Eur. Phys. J. B 2, 525 (1998).
- (4) P. Bak, K. Christensen, L. Danon, and T. Scanlon, Phys. Rev. Lett. 88, 178501 (2002).
- (5) A. Corral, Phys. Rev. E 68, 035102(R) (2003).
- (6) A. Corral, Phys. Rev. Lett. 92, 108501 (2004).
- (7) A. Corral, Phys. Rev. E 71, 017101 (2005).
- (8) V. Livina, S. Havlin, and A. Bunde, Phys. Rev. Lett 95, 208501 (2005).
- (9) B.-H. Wang and P.-M. Hui, Eur. Phys. J. B 20, 573 (2001).
- (10) F. Lillo and R. N. Mantegna, Phys. Rev. E 68, 016119 (2003).
- (11) K. Yamasaki, L. Muchnik, S. Havlin, A. Bunde, and H. E. Stanley, Proc. Natl. Acad. Sci. U.S.A. 102, 9424 (2005).
- (12) F. Z. Wang, K. Yamasaki, S. Havlin, and H. E. Stanley, Phys. Rev. E 73, 026117 (2006).
- (13) A. Bunde, J. F. Eichner, J. W. Kantelhardt, and S. Havlin, Phys. Rev. Lett 94, 048701 (2005).
- (14) F. Omori, J. Coll. Sci. Imp. Univ. Tokyo 7, 111 (1894).
- (15) B. Gutenberg and C. F. Richter, Bull. Seismol. Soc. Am. 34, 185 (1944).
- (16) R. Pasto-Santorras and A. Vespignani, Evolution and Structure of the Internet: A Statistical Physics Approach (Cambridge University Press, Cambridge, 2004).
- (17) G.-Q. Zhang, G.-Q. Zhang, Q.-F. Yang, S.-Q. Cheng, and T. Zhou, New J. Phys. 10, 123027 (2008).
- (18) W. E. Leland, M. S. Taqqu, W. Willinger, and D. V. Wilson, IEEE/ACM Trans. Netw. 2, 1 (1994).
- (19) B. Tadić, S. Thurner, G. J. Rodgers, Phys. Rev. E 69, 036102 (2004).
- (20) G. Yan, T. Zhou, B. Hu, Z.-Q. Fu, B.-H. Wang, Phys. Rev. E 73, 046108 (2006).
- (21) S.-M. Cai, G. Yan, T. Zhou, P.-L. Zhou, Z.-Q. Fu, and B.-H. Wang, Phys. Lett A 366, 14 (2007).
- (22) S. Abe and N. Suzuki, Europhys. Lett. 61, 852 (2003).
- (23) S. Abe and N. Suzuki, Physica A 319, 552 (2003).
- (24) The specific describation of measuremnt of Ethernet traffic sets at http://ita.ee.lbl.gov/html/contrib/BC.html.
- (25) P.-L. Zhou, S.-M. Cai, T. Zhou, and Z.-Q. Fu, Procceding of International Conference on Communication, Circuit And Systems 2006 (IEEE Press, 2006, pp. 1744-1748).
- (26) P. C. Ivanov, A. Yuen, B. Podobnik, and Y. Lee, Phys. Rev. E 69, 056107 (2004).
- (27) K.-I. Goh and A.-L. Barabási, Europhys. Lett. 81, 48002 (2008).
- (28) C. K. Peng, S. V. Buldyrev, S. Havlin, M. Simons, H. E. Stanley, and A. L. Golderger, Phys. Rev. E 49, 1685 (1994).
- (29) K. Hu, P. C. Invanov, Z. Chen, P. Carpena, and H. E. Stanley, Phys. Rev. E 64, 011114 (2001).
- (30) Z. Chen, P. C. Ivanov, K. Hu, and H. E. Stanley, Phys. Rev. E 65, 041107 (2002).
- (31) Z. Dezsö, E. Almaas, A. Lukács, B. Rácz, I. Szakadát, and A.-L. Barabási, Phys. Rev. E 73, 066132 (2006).
- (32) B. Goncalves and J. J. Ramasco, Phys. Rev. E 78, 026123 (2008).
- (33) T. Zhou, H. A.-T. Kiet, B.-J. Kim, B.-H. Wang, and P. Holme, Europhys. Lett. 82, 28002 (2008).