A photodissociation model for the morphology of Hi near OB associations in M33
Abstract
We present an approach for analysing the morphology and physical properties of Hi features near giant OB associations in M33, in the context of a model whereby the Hi excess arises from photodissociation of the molecular gas in remnants of the parent Giant Molecular Clouds (GMCs). Examples are presented here in the environs of NGC604 and CPSDPZ204, two prominent Hii regions in M33. These are the first results of a detailed analysis of the environs of a large number of OB associations in that galaxy. We present evidence for “diffusion” of the far-UV radiation from the OB association through a clumpy remnant GMC, and show further that enhanced CO(1-0) emission appears preferentially associated with GMCs of higher volume density.
Subject headings:
galaxies: individual (M33) — galaxies: ISM — ISM: clouds — ISM: molecules — HII regions — ultraviolet: galaxies1. Introduction
It is widely accepted that stars form from molecular gas in galaxies, and that the largest stars form in Giant Molecular Clouds (GMCs). Such massive stars produce prodigious quantities of far-UV (FUV) radiation, that will react back on the parent GMCs producing photodissociation regions (PDRs) on the cloud surfaces. Highly luminous PDRs very near to OB associations are a rich source of atomic, molecular, and solid grain spectral features, especially in the IR, and several prominent cases (e.g. the Orion region) in the Galaxy have been extensively studied both theoretically and observationally (see e.g. the review by Hollenbach & Tielens, 1999). Less well appreciated is that Hi atoms are also produced in such PDRs in quantities sufficient to be detectable in 21-cm radio emission (see Allen et al. (2004) and references cited there), and that this can occur in situations of much more modest volume densities and far-UV fluxes than is usually required to produce detectable IR line emission. Furthermore, such relatively low-density PDRs are physically large, rendering them more easily detectable by radio astronomy.
In this paper, we present the first results of a study of Hi features in the the environs of OB associations in M33 (NGC 598) in terms of this PDR model. We explain the observations in a consistent, simple physical context, using a method motivated by the initial discoveries of Allen et al. (1986). Those authors presented evidence that large-scale spiral arm features in the Hi distribution of M83 (NGC 5236), offset from the dust lanes, were produced by photodissociation of H2. Allen et al. (1997) provided a qualitative analysis of similar features in M81 (NGC 3031), consistent with the occurrence of large-scale, low-density Hi PDRs connected to nearby bright FUV sources. They also suggested a more quantitative approach that was subsequently used on M101 (NGC 5457) by Smith et al. (2000), based on a simple equilibrium model for the physics of Hi production in PDRs. This provided a new method for determining densities of molecular gas in star-forming GMCs of galaxies, a method that is independent of the excitation conditions for specific molecular tracers. Using a combination of GALEX FUV and VLA Hi data, essentially the same technique was applied to M81 (Heiner et al., 2008a) and M83 (Heiner et al., 2008b). While evidence for the presence of widespread molecular gas in both galaxies was found, we concluded that the molecular gas in the GMCs in M81 is generally of lower volume density. This is in agreement with the fact that the CO emission is generally fainter in M81 and hence likely to be less excited (e.g. Knapen et al., 2006).
The closer proximity of M33 allows for a much more detailed analysis than was possible for M81 and M83, and we are therefore carrying out an extensive study of the Hi in the immediate surroundings of OB associations in this galaxy in the context of the photodissociation model for Hi production. As an example of what can be accomplished with this approach, we analyse the Hi near two prominent OB associations in M33: CPSDP Z204 (Courtes et al., 1987) and NGC 604. The Hi features surrounding these associations are sufficiently bright in 21-cm emission that they stand out above the general background, presenting a plausible case that their morphology is indeed a consequence of dissociation by FUV photons from the cluster of bright young stars nearby. In the case of CPSDP Z204 we model the Hi as a function of depth into a nearby GMC in terms of the “diffusion” of the far-UV radiation propagating into a clumpy medium. In all cases we determine gas densities in the surrounding GMCs and compare the results to the appearance of CO(1-0) emission nearby where available. CPSDP Z204 and NGC 604 have in common that local metallicity measurements are available from the literature (which improves the precision of our calculations), as well as CO detections (confirming the presence of molecular gas). We find that the higher density clouds as determined by our method are more likely to show CO emission nearby, in agreement with our earlier M83 results.
2. Method and Data
We have used a simple equilibrium model of photodissociation physics to derive total hydrogen volume densities in candidate PDRs in M33, as we did in Heiner et al. (2008a) and Heiner et al. (2008b). Every Hi “patch” in the immediate environment of the OB association is considered a candidate PDR. The data entering into the calculation are: the measured far-UV flux of the OB association; the distance from the association to the Hi patch; the column density of the Hi patch; the local dust-to-gas ratio; and, some simplifying assumptions about the actual 3D geometry of the region.
The following basic parameters of M33 were used: We assume a distance of 847 kpc (Saha et al., 2006). A UV foreground Galactic extinction correction of 0.33 was applied, appropriate for the GALEX FUV band, after Schlegel et al. (1998) and Gil de Paz et al. (2007).
The photodissociation-reformation equilibrium balance is highly sensitive to the local dust content, as it influences both the effective absorption cross section of the dust grains and the H2 formation rate. The dust-to-gas ratio is normalized to the solar neighborhood value. We derive its value directly from the metallicity as measured in the ionized gas of the OB associations by Rosolowsky & Simon (2008), after Issa et al. (1990). It is assumed that this metallicity measurement from the Hii region is an acceptable approximation of the metallicity in the molecular clouds that we are interested in. This is identical to our approach in Heiner et al. (2008a) and Heiner et al. (2008b), but now we can take advantage of individual metallicity measurements (where available) instead of using a metallicity gradient over the galaxy. Rosolowsky & Simon (2008) point out that, while their gradient fit has a high statistical accuracy, there is significant intrinsic scatter around this gradient (their Fig. 3). We will therefore assume that an individual measurement is a better estimate than using a gradient in this case.
If we adopt a solar metallicity of 8.69 (from Allende Prieto et al., 2001), the dust-to-gas ratio becomes:
| (1) |
This is the same as assuming that the metallicity gradient is identical to the gradient in the dust-to-gas ratio, where the gradient is constructed from the solar metallicity (the dust-to-gas ratio scaled to the solar neighborhood value equals 1 by definition) and the value of the metallicity at the location that we are interested in. However, since we are only interested in individual values, a radial dependence is not explicitely computed. We adopted NGC 604’s metallicity from Esteban et al. (2002) and CPSDP Z204’s metallicity from Rosolowsky & Simon (2008).
The PDR model we applied comes from Allen (2004) with improved coefficients provided by Allen et al. (2004):
| (2) |
where is the (background subtracted) atomic hydrogen column density (in ), is the incident FUV flux measured at the affected Hi patch and is the total hydrogen volume density. This gas is likely to be mostly atomic on the surface of the GMC and mostly molecular deep inside the cloud. Allen et al. (2004) (their Appendix B) provide a full treatment of how is defined and derived. Heaton (2009) recently proposed an improvement to this model by taking into account a more realistic self-shielding function of molecular hydrogen based upon multiple transitions instead of a single one. In that case, our computed volume densities need to be multiplied by a factor , or 0.9 in the case of NGC 604 and 0.8 in the case of CPSDP Z204, well within our estimated level of uncertainty.
We used the publicly accessible GALEX FUV image of M33, which has a linear resolution of about 16 pc (). This data at is used as a proxy for the dissociating UV () since the spectrum of the UV radiation in the ISM is fairly flat, at least in the Galaxy close to the sun (van Dishoeck & Black, 1988). The 21-cm Hi radio image of M33 was obtained from David Thilker (2007, private communication) and has a linear resolution of 20 pc (). Noise levels are typically . At these spatial scales we expect to start seeing more frequently the signature PDR morphology in the Hi features found near FUV sources. The radio data were taken with the VLA and with the GBT (combined using a similar procedure as described in Braun et al., 2009). They are therefore photometrically accurate (within the noise levels). We adopt a local Hi background level for each region, based on measurements of the Hi column densities away from the candidate PDRs. The background levels are measured on a scale of typically 100 pc, and can be as high as . The remaining column density after subtraction of the background is then assumed to be produced entirely by photodissociating photons from the nearby OB association111The origin of the smooth Hi background is not discussed here. It is possible that this too is photodissociated gas, arising for example from an extended population of B stars, but some fraction of it may be primordial..
To apply the PDR model, we have generally followed the methods previously used in M81 and M83. However, owing to the higher linear resolution, some further improvements have been made. The UV sources at the center of each region are identified (to the extent that they are resolved), their fluxes measured, and used to calculate a cumulative incident flux on the Hi patch of current interest. No internal extinction correction was applied, for reasons outlined in Heiner et al. (2008a). We measured the distances between the central UV sources and a number of nearby Hi ’patches’, defined as a local maximum in the Hi column density. These patches were generally selected based on their prominence in the image and/or their proximity to available CO detections. In these measurements we limited the distance between any UV source and any Hi patch to 200 pc, which is smaller than the cut-off of 400 pc we used previously, but more appropriate to the scale of the candidate PDRs we expect to see at this level of detail. At these separations, the FUV flux contributed by the young clusters of OB stars has also dropped to about 1% of the local ambient UV flux, and the additional Hi contributed by those clusters will be difficult to distinguish in the noise and confusion of the general Hi background. The final result of the calculation on each Hi patch is an estimate of the total hydrogen volume density in the GMC associated with that patch.
3. Results
3.1. Atomic hydrogen in candidate PDRs
As a prelude to the actual analysis of the candidate PDRs, we first present the atomic hydrogen images of the immediate surroundings of the two OB associations that we selected. The general morphology of the Hi will, in our picture, be a function of both the local surface number density of GMCs and the ambient UV flux. Since we are assuming that atomic hydrogen peaks near OB associations are produced by photodissociation, we can measure these peaks and then use these results to calculate total hydrogen volume densities. It should be noted that we do not aim to identify all Hi patches, but rather attempt to find those that are clearly produced by photodissociation.
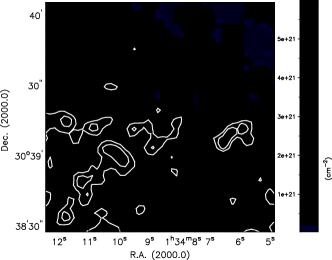
The CPSDP Z204 area shows a variety of Hi patches with a suggestive shell-like feature immediately surrounding the OB association. Two more extended patches can be seen further away, as well as some more patches that either do not stand out much or are beyond our 200 pc cut-off. The more extended patches are studied in more detail in this paper, because they are likely to be caused by the central OB association as well as being sufficiently resolved to try to model the Hi distribution radially.
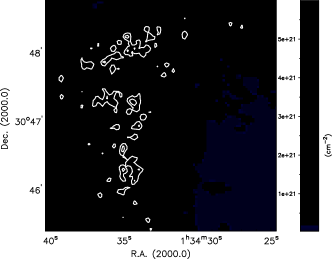
The distribution of atomic hydrogen in NGC 604 is part of a larger spiral arm and appears to curve around the central OB association in NGC 604 on the eastern side. While the general level of Hi column density is fairly high, the peaks do show a bit of structure, albeit a chaotic one. We analyzed four Hi patches in this area, as well as considering a larger-scale approach to the PDR morphology by averaging the atomic hydrogen over a larger area. These patches were chosen partially because of the presence of CO in the area (a confirmation of the presence of molecular gas, sure to produce atomic hydrogen under the influence of FUV emission). Another reason to look at NGC 604 in particular is the wealth of available data. Since our method is generally sensitive to low-density molecular gas, it is interesting to test it at the extreme end of higher densities that are known to occur in NGC 604 and compare the results.
3.2. Hi morphology in the environs of CPSDP Z204

The Hii region CPSDP Z204 (galactocentric radius 1.63 kpc) was included in several surveys—most notably the one from which it derives its name (Courtes et al., 1987), but it does not appear to have been singled out for individual study before.
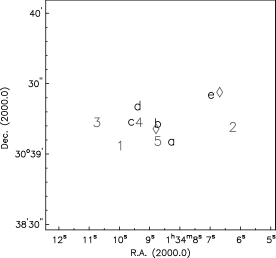
We have modeled the morphology of two particular Hi patches near FUV sources using PDR physics and simple models of the geometry of the GMCs. We identified four FUV sources which define the center of Z204, and one additional source a bit further away to the northwest as shown in Fig. 2. We also located five Hi local maxima, that we assume to be on the surface of GMCs. The FUV fluxes are generally about ten times fainter than in NGC 604. CO emission detected by Engargiola et al. (2003) can be seen in two locations, at a resolution of 13″ or about 50 pc. The results of our measurements of CPSDP Z204 are listed in Table 1. The letters and numbers in the finding chart correspond with the superscripts of values in the table. The resulting total hydrogen volume densities range from 15 to . One of the CO detections, close to source b, is accompanied by two Hi patches (nos. 4 and 5) that yield the highest volume densities in the area. The other CO detection, close to source e, does not correspond to a particular Hi patch at the highest column densities, but its presence is a confirmation that there is molecular gas in the area. This is important for the applicability of our method. It should also be noted here that the resolution of the CO measurements is poorer than that of the Hi map, and the CO location is accurate to within about 80–90 pc at best.
The Hi patches in the area are consistent with being the photodissociated edges of GMCs, either unresolved or partially resolved, and illuminated by the central cluster of OB stars. To test this assumption we have modeled two patches numbered 1 and 2 in the finding chart of 2.
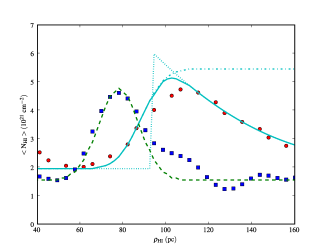
The average Hi column densities of these patches were measured along the line through the center of the patch in the direction to the nearest cluster of UV sources. The column densities were averaged in thin slabs of oriented perpendicular to that line. Distances were deprojected in the case of patch 1 by a factor of 0.6 in order to obtain the separation in the plane of the galaxy. The resulting average column densities are shown in Fig. 3.
The density profile of patch 2 (squares) is the easiest to model. The patch seems unresolved along the line of sight from the UV source, and barely resolved in the perpendicular direction. We fitted the data to a model of a simple rectangular Hi patch of constant column density, convolved with our 5″ (radio) beam. The best result is achieved with a 3″ 9″ patch with an intrinsic column density of (not including a background level of ). The volume density inferred for the GMC underlying this patch is using the observed column density enhancement of about from Fig. 3, but this decreases to after correcting the column density for beam smoothing. Note further that the brightness temperature associated with such a level of Hi column density suggests that the Hi is quite possibly optically thick, in which case the real column density may be significantly higher. The extra “lump” of Hi gas at about 100 pc distance from the FUV source might be an indication that the GMC is somewhat “porous” to the UV radiation, which has penetrated through holes in the GMC and produced more atomic hydrogen further from the FUV source. A more elaborate version of this model will now be described for patch 1.
Patch 1 looks resolved in Fig. 3, but cannot be explained by a simple rectangular source as we have done for patch 2; the Hi distribution drops off too slowly on the right side, beyond about 100 pc (circles). The approximately exponential decrease at larger distances from the FUV source suggest a model GMC which is porous to FUV radiation, with many unresolved molecular clumps embedded in a lower-density medium (see e.g. Falgarone & Phillips, 1996). These molecular clumps will all have photodissociated Hi on their surfaces; it is this Hi which we observe. The effective FUV optical depth of such a medium is much lower than that expected for uniform gas.
We calculate first the FUV flux incident on the GMC at about 90 pc using the FUV luminosity of the OB associations and the distance to the GMC. Beyond that point the FUV flux drops not only as the square of the distance, but also with an extra internal “extinction”, proportional to . In this case an opacity of (optically thin) gives a reasonable fit. According to Hollenbach & Tielens (1999), a clumpy medium that is essentially empty in the interclump regions has an effective . The filling factor is approximately for GMCs that have densities comparable to what we are finding, which means that would be ; this is consistent with the properties of small, dense molecular clumps such as those found in the Orion Nebula.
The final step in our model is to smooth this source distribution with the beam, resulting in the solid line shown in Fig. 3. We note that this model provides a good fit to the data (circles).
3.3. NGC 604
NGC 604 is the largest and most luminous Hii region in M33 and a site of active star formation, situated at a galactocentric radius of 3.47 kpc. It consists of several clusters of O and B stars (Churchwell & Goss, 1999), which are partially resolved in the GALEX image of NGC 604. The region is known to contain molecular clouds of various sizes in a clumpy medium (Lebouteiller et al., 2006; Wilson & Scoville, 1992). Finally, Wilson & Scoville (1992) pointed out that M33 Hi data implies that NGC 604 has a relatively large mass fraction of atomic hydrogen, which may be the result of photodissociation. This makes the region an excellent target to find large-scale PDRs. We now estimate molecular gas densities in NGC 604 using our model, and compare our results with those obtained from CO maps.
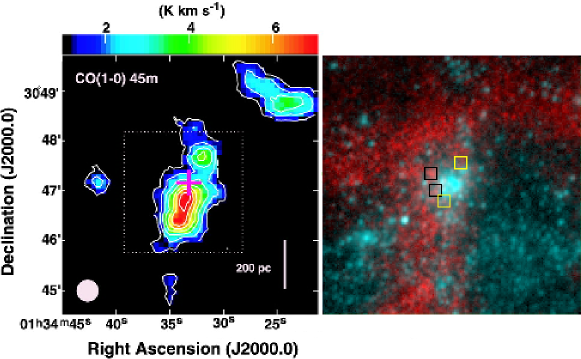
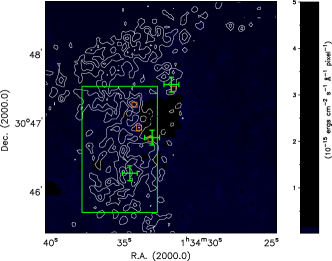
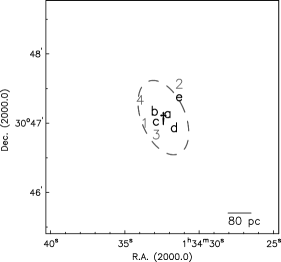
A detailed view of NGC 604 in FUV and Hi 21-cm radio emission is shown in the right panel of Fig. 4. The FUV emission (blue) is spread across the region, but it is strongest at the Hii region defining NGC 604. The atomic hydrogen (red) follows one of M33’s spiral arms, and appears to “wrap around” to the east of NGC 604, forming a large Hi structure of typical size 200 pc similar to those structures first identified in M81 by Allen et al. (1997). The Hi to the west of the arm drops below the detection limit, but it is present at faint levels in lower resolution maps. Five resolved OB associations were identified and their FUV fluxes measured. Four representative Hi patches were selected as candidate PDRs, two of them based on the detection of CO close to their locations. This is shown in Fig. 5. Table 1 lists the measurements of candidate PDRs, taken in a similar fashion as in CPSDP Z204. The resulting total hydrogen densities of the underlying GMCs vary from about 20 to 140 , with the highest values corresponding to the two locations near the CO detections by Engargiola et al. (2003).
We have also analyzed the Hi “envelope” around NGC 604 as if we had observed it’s Hi with a typical resolution of pc, analogous to our earlier work on M101, M81 and M83 (boldface in Table 1). At this linear resolution, the (smoothed) Hi column densities are lower, leading to higher GMC volume densities of typically 500 estimated with a simple application of the PDR model. However, the more detailed analyses we have provided in this paper show that the true mean densities are likely to be significantly lower when a clumpy source geometry and the effects of finite telescope resolution are included222This apparently counter-intuitive behavior is a consequence of Equation 2, which shows that for a given the only way to increase is to decrease the total volume density ..
The densities of the GMCs that we found here are lower than those obtained using CO methods. This is caused by our method being specifically sensitive to lower densities. Higher density clouds have a thinner layer of atomic hydrogen, as well as a lower beam filling factor as they are more concentrated. The GMCs with the highest densities that can be detected through their CO emission will therefore correspond to smoothed Hi column densities that are too low to stand out from the general background level. What can be seen here is that our method yields cloud densities on the high end of the range of densities to which we are sensitive.
| NGC 604 | CPSDP Z204 | |
| 0.63 | 0.38 | |
| FUV fluxes () | , , , , | , , , , |
| 1.0 | 1.0 | |
| , , , , | , , , | |
| (background-subtracted) | , | |
| (cumulative) | , , , , | , , , , |
| range | ; ; ; | , , , |
| ; | , | |
| n (derived, in ) | , , , , | , , , , |
| Fractional error range | 0.26 - 0.44 | 0.26 - 0.36 |
| A description of this table can be found in §§3.2 and 3.3. | ||
4. Conclusions
-
1.
Using VLA + GBT observations of the 21-cm Hi line and GALEX observations of the FUV emission, along with a simple model for the photodissociation of molecular hydrogen on the surfaces of GMCs, we have estimated total hydrogen volume densities in the GMCs surrounding the two OB associations NGC 604 and CPSDP Z204 in M33.
-
2.
We find values for the molecular gas densities in the parent GMCs near these OB associations ranging from 15 to 540 . Regions with higher gas densities () appear to be correlated with the presence of CO(1-0) emission.
-
3.
We explain the morphology of two Hi patches in the environs of CPSDP Z204 using straightforward assumptions about the underlying geometry of the molecular gas. One patch appears to be a slightly-resolved GMC. The other source was largely resolved; it can be modeled as a clumpy molecular medium which is very porous, and therefore significantly more transparent to FUV emission than would otherwise be expected. In our model, the Hi we are observing is produced by photodissociation of H2 on the surfaces of these molecular clumps.
Our approach views the Hi found in the environs of star-forming regions of galaxies to be a product of the star formation process, not a precursor to it. The ability to model the morphology of Hi features in the environs of OB associations and to predict the appearance of CO emission as an excitation effect related to higher volume densities in the parent GMCs are two results of this paper which lend further support to this approach. A more extensive treatment of GMCs in M33 based on this approach is in preparation (Heiner 2009, PhD thesis).
References
- Allen (2004) Allen, R. J. 2004, in Astrophysics and Space Science Library, Vol. 319, Penetrating Bars Through Masks of Cosmic Dust, ed. D. L. Block, I. Puerari, K. C. Freeman, R. Groess, & E. K. Block, 731
- Allen et al. (1986) Allen, R. J., Atherton, P. D., & Tilanus, R. P. J. 1986, Nature, 319, 296
- Allen et al. (2004) Allen, R. J., Heaton, H. I., & Kaufman, M. J. 2004, ApJ, 608, 314
- Allen et al. (1997) Allen, R. J., Knapen, J. H., Bohlin, R., & Stecher, T. P. 1997, ApJ, 487, 171
- Allende Prieto et al. (2001) Allende Prieto, C., Lambert, D. L., & Asplund, M. 2001, ApJ, 556, L63
- Braun et al. (2009) Braun, R., Thilker, D. A., Walterbos, R. A. M., & Corbelli, E. 2009, ApJ, 695, 937
- Churchwell & Goss (1999) Churchwell, E., & Goss, W. M. 1999, ApJ, 514, 188
- Courtes et al. (1987) Courtes, G., Petit, H., Petit, M., Sivan, J.-P., & Dodonov, S. 1987, A&A, 174, 28
- Engargiola et al. (2003) Engargiola, G., Plambeck, R. L., Rosolowsky, E., & Blitz, L. 2003, ApJS, 149, 343
- Esteban et al. (2002) Esteban, C., Peimbert, M., Torres-Peimbert, S., & Rodríguez, M. 2002, ApJ, 581, 241
- Falgarone & Phillips (1996) Falgarone, E., & Phillips, T. G. 1996, ApJ, 472, 191
- Gil de Paz et al. (2007) Gil de Paz, A., Boissier, S., Madore, B. F., Seibert, M., Joe, Y. H., Boselli, A., Wyder, T. K., Thilker, D., Bianchi, L., Rey, S.-C., Rich, R. M., Barlow, T. A., Conrow, T., Forster, K., Friedman, P. G., Martin, D. C., Morrissey, P., Neff, S. G., Schiminovich, D., Small, T., Donas, J., Heckman, T. M., Lee, Y.-W., Milliard, B., Szalay, A. S., & Yi, S. 2007, ApJS, 173, 185
- Heaton (2009) Heaton, H. I. 2009, ApJ, 694, 978
- Heiner et al. (2008a) Heiner, J. S., Allen, R. J., Emonts, B. H. C., & van der Kruit, P. C. 2008a, ApJ, 673, 798
- Heiner et al. (2008b) Heiner, J. S., Allen, R. J., Wong, O. I., & van der Kruit, P. C. 2008b, A&A, 489, 533
- Hollenbach & Tielens (1999) Hollenbach, D. J., & Tielens, A. G. G. M. 1999, Reviews of Modern Physics, 71, 173
- Issa et al. (1990) Issa, M. R., MacLaren, I., & Wolfendale, A. W. 1990, A&A, 236, 237
- Knapen et al. (2006) Knapen, J. H., Allen, R. J., Heaton, H. I., Kuno, N., & Nakai, N. 2006, A&A, 455, 897
- Lebouteiller et al. (2006) Lebouteiller, V., Kunth, D., Lequeux, J., Aloisi, A., Désert, J.-M., Hébrard, G., Lecavelier Des Étangs, A., & Vidal-Madjar, A. 2006, A&A, 459, 161
- Rosolowsky & Simon (2008) Rosolowsky, E., & Simon, J. D. 2008, ApJ, 675, 1213
- Saha et al. (2006) Saha, A., Thim, F., Tammann, G. A., Reindl, B., & Sandage, A. 2006, ApJS, 165, 108
- Schlegel et al. (1998) Schlegel, D. J., Finkbeiner, D. P., & Davis, M. 1998, ApJ, 500, 525
- Smith et al. (2000) Smith, D. A., Allen, R. J., Bohlin, R. C., Nicholson, N., & Stecher, T. P. 2000, ApJ, 538, 608
- Tosaki et al. (2007) Tosaki, T., Miura, R., Sawada, T., Kuno, N., Nakanishi, K., Kohno, K., Okumura, S. K., & Kawabe, R. 2007, ApJ, 664, L27
- van Dishoeck & Black (1988) van Dishoeck, E. F., & Black, J. H. 1988, ApJ, 334, 771
- Wilson & Scoville (1992) Wilson, C. D., & Scoville, N. 1992, ApJ, 385, 512