The black hole mass, Eddington ratio, and relation in young radio galaxies
Abstract
The masses of the central supermassive black holes and the Eddington ratios for a sample of 65 young radio galaxies [27 gigahertz-peaked spectrum (GPS) and 38 compact steep-spectrum (CSS) sources] are estimated by various methods. We find that the average BH mass of these young radio galaxies is , which is less than that of radio loud QSOs and low redshift radio galaxies (). The CSS/GPS sources have relatively high Eddington ratios with average ratio , which are similar to those of narrow line Seyfert 1 galaxies (NLS1s). It suggests that the CSS/GPS sources may not only be in the early stage of radio activities, but also in the early stage of their accretion activities.
We find that the young radio galaxies as a class deviate systematically from the relation defined by nearby inactive galaxies, when using as a surrogate for the stellar velocity dispersion . There is no significant correlation between the deviation of the [O III] emission line width, , and the jet/accretion power, where are calculated from the Tremaine et al. relation using the estimated BH masses. However, we find that the deviation in young radio galaxies is well correlated with the Eddington ratio, and this correlation is found to be similar to that of radio quiet AGN (QSOs/NLS1s) where the radio jet is absent or weak. We suggest that the accretion activities may still play an important role in shaping the kinematics of [O III] narrow line in these young radio galaxies.
keywords:
accretion, accretion discs - ISM: jets and outflows - galaxies: active - radio continuum: galaxies - quasars: emission lines1 Introduction
Gigahertz-peaked spectrum (GPS) and compact steep-spectrum (CSS) radio sources constitute a large fraction () of the powerful () radio source population. Their radio spectra are simple and convex with peaks close to 1 GHz and 100 MHz for GPS and CSS sources respectively. Morphologically, the GPS sources are generally less than 1 kpc in projected linear size and CSS sources are less than 20 kpc (see O’Dea 1998 for a review). Two main theories have been proposed to explain the CSS/GPS phenomenon: the youth scenario (Fanti et al. 1995) and the frustration scenario (van Breugel 1984). The age of CSS/GPS sources has been estimated using both the lobe proper motion (e.g., Owsianik & Conway 1998) and the radiative ages (Murgia et al. 1999). The ages derived are less than a few thousand years, therefore strongly supporting the youth scenario in the interpretation of their compactness. In fact, it has been suggested that compact CSS/GPS sources perhaps eventually evolve into extended, edge-brightened Fanaroff-Riley II sources (Snellen et al. 2003). In the frustration scenario, the radio source is confined and frustrated by a cocoon of dense gas and dust for its entire life. However, the far-infrared fluxes and near-infrared propertities of CSS sources are roughly consistent with those of radio sources with extended jets, which suggest that they have similar dust content in the circumnuclear environment (e.g., Fanti et al. 2000; de Vries et al. 1998).
If the evolutionary hypothesis of the youth scenario is correct, study of the early-phase of the radio activity and feedback in CSS/GPS sources may impact our understanding of galaxy evolution. There is much evidence to suggest that, in a significant fraction of the radio source population, the radio sources are triggered by merger events of two or more galaxies (e.g., Heckman et al. 1986). There are many compact radio sources exhibiting features attributed to mergers, such as double nuclei, tidal tails, arcs of emission and distorted isophotes, suggesting that these sources are possibly observed relatively shortly after the merger event (Stanghellini et al. 1993). The merger of galaxies will deposit large quantities of gas and dust into the nuclear region, the central black hole (BH) will grow rapidly through the merger-induced accretion, and eventually form strong winds/outflows during fast accretion (e.g., Di Matteo et al. 2005). Narrow line Seyfert 1 galaxies (NLS1) are a particular class of active galactic nuclei (AGN). The most widely accepted paradigm for NLS1s is that they accrete at close to the Eddington rate and have smaller BH masses compared broad line AGN, which might be in the early stage of AGN evolution (e.g., Mineshige et al. 2000; Boroson 2002; Grupe 2004; Bian & Zhao 2004). Most of the radio loud NLS1s galaxies are compact, steep-spectrum sources, which are similar to CSS/GPS sources (e.g., Gallo et al. 2006; Komossa et al. 2006). Therefore, compact radio sources (CSS/GPS) may not only be in the early stage of radio activity, but also in the early stage of BH accretion.
The mass of supermassive BH in the AGN is a key parameter to understand the nuclear energy generation as well as BH formation and evolution. There are several methods for estimating the BH masses in AGN. In quiescent galaxies, dynamical modeling of either stellar kinematics (e.g., Kormendy 1988) or gas motions (e.g., Harms 1994) is used to determine central BH masses (e.g., Kormendy & Gebhardt 2001 for a review). The correlation between the bulge stellar velocity dispersion and the central BH mass is now well established in nearby inactive galaxies ( relation, e.g., Gebhardt et al. 2000a; Ferrarese & Merritt 2000; Tremaine et al. 2002). Interestingly, the relation for normal galaxies also extends to AGN (e.g., Gebhardt et al. 2000b). Unfortunately, the bulge stellar velocity dispersion in bright AGN is generally difficult to measure directly. In order to derive the BH mass in a larger sample of AGN, the width of the [O III] line emitted by the narrow-line region is frequently used as a surrogate for the stellar velocity dispersion, since the kinematics of [O III] emission line is believed to be dominated by the gravitational potential of the bulge. Nelson & Whittle (1996) found in a sample of 66 Seyfert galaxies, where and FWHM is full width at half-maximum of the emission line. Nelson (2000) and Boroson (2003) found that and are strongly correlated and consistent with the Tremaine et al. (2002) relation, although with substantial scatter. The reverberation mapping (RM) method provides a virial estimate of the BH mass in type 1 AGN. Using this technique, the size of the broad line region (BLR) can be measured using the time lag between the variations of the continuum and emission line fluxes. The BH mass can then be estimated with , if we assume the gas near the BH is virialized, where is the BLR size, is the characteristic velocity (e.g.,FWHM), and is the gravitational constant (e.g., Blandford & McKee 1982; Peterson 1993; Peterson 2004, and references therein). The most important result of the RM method is the discovery of a simple scaling relationship between the BLR size and the optical luminosity, which provides a useful secondary method of mass determination (e.g., Wandel et al. 1999; Kaspi et al. 2000; Vestergaard 2002; Kaspi et al. 2005; Greene & Ho 2005a; Kong et al. 2006). This technique has been widely used in the literature (e.g., Gu et al. 2001; Wu et al. 2004).
Despite the widespread use of as a surrogate of in AGN, there are also several exceptions. In particular, one should be cautious where the [O III] kinematics may be affected by other drivers (e.g., outflows/winds) apart from the first driver of gravitational potential of bulge. For example, it is found that NLS1s as a class deviate systematically from the relation seen in normal galaxies, when assuming (e.g., Grupe & Mathur 2004; Bian & Zhao 2004). However, Barth et al. (2005) measured in 19 NLS1s, and found that these NLS1s still follow the relation. The width of low-ionization lines (e.g., [S II]) or the core component of [O III] (after removal of asymmetric blue wings) of NLS1s is still a good proxy for stellar velocity dispersion (e.g., Greene & Ho 2005b; Komossa et al. 2008). Therefore, the accretion activity (e.g., accretion-driven outflows/winds) may affect the kinematics of the [O III] emission line (e.g., Greene & Ho 2005b; Bian et al. 2005; Komossa et al. 2008). The other possible exception is the [O III] narrow emission line in young radio galaxies (CSS/GPS sources) and some luminous linear radio sources, which, normally, have highly broadened line profiles (e.g., Gelderman & Whittle 1994; Nelson & Whittle 1996; Tadhunter et al. 2001; O’Dea et al. 2002; Holt et al. 2003, 2006, 2008). High resolution optical and radio imaging show that the [O III] optical narrow emission line is strongly aligned with each other in CSS sources at all redshifts (e.g., de Vries et al. 1997; de Vries et al. 1999; Axon et al. 2000; Privon et al. 2008). The expanding radio jets provide a convenient driving mechanism for the observed nuclear outflows which may broaden the [O III] emission line (jet-driven outflows, e.g., Tadhunter et al. 2001; Holt et al. 2003, 2006, 2008). Labiano (2008) also found that the [O III] luminosity is well correlated with the CSS/GPS source size, which seems to support the jet-driven scenario. The ionization diagnostics on different narrow lines found that mix of shock and photo-ionization give the best explainations in the extended emission line gas (e.g., Inskip et al. 2002; Labiano et al. 2005; Holt et al. 2006; Humphrey et al. 2008).
Much of the work on the compact radio galaxies has concentrated on the radio wavebands and optical emission lines, but relatively little attention has been paid to their central engine properties (e.g., BH masses and accretion modes). In particular, the accretion-driven outflows/winds may also affect the kinematics of the [O III] emission line in the radio loud CSS/GPS sources in addition to jet-driven outflows, if their Eddington ratios are high as those of radio quiet NLS1s. Therefore, it is important to test these two scenarios in young radio galaxies. In this paper, we present the BH masses, Eddington ratios, and the possible relations between the [O III] kinematics and the accretion/jet properties for a sample of CSS/GPS sources. Throughout this paper, we assume the following cosmology: , and .
Table 1. BH masses, Eddington ratios, [O III] kinematics, and jet powers.
| Source | za | Refs. | Method 1b | Method 2c | Refs.d | Refs. | Band | ||||
|---|---|---|---|---|---|---|---|---|---|---|---|
| log () | log | log (km/s) | log | ||||||||
| (1) | (2) | (3) | (4) | (5) | (6) | (7) | (8) | (9) | (10) | (11) | (12) |
| CSS sample | |||||||||||
| 3C 43 | 1.459 | S89 | 9.2 | -1.0 | + | L5100 | M06 | … | … | 47.20 | 160M |
| 3C 48 | 0.369 | S89 | 8.8 | -0.30 | + | J91,C97 | 2.84 | G94 | 46.49 | 178M | |
| 3C 67 | 0.310 | S89 | 8.1 | -1.52 | + | L5100 | S07 | 2.41 | G94 | 45.71 | 160M |
| 3C 93.1 | 0.244 | S89 | 7.1 | … | - | Fitting | W02 | 2.42 | G94 | 45.49 | 160M |
| 3C 138 | 0.759 | S89 | 8.7 | -0.25 | + | Fitting | W02 | 2.72 | G94 | 46.71 | 160M |
| 3C 147 | 0.545 | S89 | 8.7 | -0.90 | + | L96,M06 | 2.71 | G94 | 46.85 | 178M | |
| 3C 186 | 1.063 | S89 | 8.9 | -0.30 | + | H03 | 2.67 | H03 | 46.88 | 151M | |
| 3C 190 | 1.195 | S89 | 7.8 | -0.13 | + | H03 | 2.61 | H03 | 47.07 | 190M | |
| 3C 191 | 1.956 | S89 | 9.7 | -1.27 | + | M06,C91 | … | … | 47.49 | 160M | |
| 3C 213.1 | 0.194 | S89 | 9.1 | -0.42 | - | e | D03 | 2.52 | G94 | 45.07 | 160M |
| 3C 216 | 0.670 | S89 | 7.0 | -0.30 | + | L96 | … | … | 46.63 | 178M | |
| 3C 241 | 1.617 | S89 | 7.8 | 0.56 | + | H03 | 2.63 | H03 | 47.71 | 151M | |
| 3C 268.3 | 0.372∗ | S89 | 7.8 | … | - | … | NED | 2.46 | G94 | 45.87 | 178M |
| 3C 277.1 | 0.320 | S89 | 7.6 | -0.14 | + | G94 | 2.34 | G94 | 45.65 | 178M | |
| 3C 286 | 0.849 | S89 | 8.5 | -0.09 | + | L5100 | M06 | 2.31 | G94 | 46.87 | 151M |
| 3C 287 | 1.055 | S89 | 9.6 | -0.85 | + | L5100 | M06 | … | … | 46.87 | 151M |
| 3C 293 | 0.045 | S04 | 8.0 | -1.78 | - | L5100 | W02,X08 | … | … | 44.22 | 151M |
| 3C 298 | 1.439 | S89 | 10.4 | -0.83 | + | L5100 | M04 | … | … | 47.68 | 178M |
| 3C 303.1 | 0.270∗ | S89 | 8.4 | … | - | … | NED | 2.54 | G94 | 45.54 | 151M |
| 3C 309.1 | 0.905 | S89 | 9.1 | -0.45 | + | L96 | … | … | 46.95 | 178M | |
| 3C 343 | 0.988 | S89 | 7.5 | 0.14 | + | Fitting | W02 | … | … | 46.81 | 178M |
| 3C 346 | 0.162 | S89 | 8.8 | -2.54 | - | L5100 | NED,M04 | 2.60 | G94 | 45.16 | 160M |
| 3C 380 | 0.692 | S89 | 9.4 | -1.15 | + | L5100 | M04 | 2.41 | G94 | 47.07 | 178M |
| 3C 454 | 1.757 | S89 | 8.6 | -0.58 | + | B90 | … | … | 47.25 | 160M | |
| 3C 455 | 0.543 | S89 | 8.5 | -1.62 | + | L5100 | M04 | 2.25 | G94 | 45.84 | 160M |
| 3C 459 | 0.220 | H08 | 8.5 | … | - | … | NED | 2.63 | H08 | 45.79 | 160M |
| 2342+821 | 0.735 | S89 | 7.5 | 0.18 | + | Fitting | W02 | 2.39 | G94 | 46.00 | 151M |
| 4C 14.82 | 0.235 | S89 | 7.9 | -0.79 | + | C97 | 2.33 | G94 | 45.20 | 160M | |
| PKS 0252-71 | 0.563∗ | H08 | 8.0 | … | - | … | NED | 2.48 | H08 | 46.11 | 408M |
| PKS 1151-348 | 0.258 | M97 | 9.1 | -1.54 | + | Fitting | W02 | … | … | 45.53 | 160M |
| PKS 1221-423 | 0.171 | J05 | 7.8 | … | - | … | NED | 2.53 | J05 | 45.04 | 160M |
| PKS 1524-136 | 1.687 | E04 | 9.1 | -0.91 | - | L5100 | P06 | … | … | 47.11 | 160M |
| PKS 1549-79 | 0.152 | H08 | 8.0 | -0.32 | - | H06 | 2.77 | H06 | 45.29 | 408M | |
| PKS 2004-447 | 0.240 | G06 | 7.6 | -0.26 | + | Fitting | W02 | … | … | 44.94 | 408M |
| SDSS 1722+565 | 0.425 | K06 | 7.5 | -0.14 | + | L5100 | K06 | 2.32 | K06 | 44.48 | 330M |
| RX J0134-4258 | 0.237 | K06 | 7.6 | 0.01 | + | L5100 | K06 | 2.34 | K06 | 44.73 | 4850M |
| TeX 11111+329 | 0.189 | K06 | 7.3 | -0.21 | + | L5100 | K06 | 2.80 | K06 | … | … |
| IRAS 2018-2244 | 0.185 | K06 | 6.5 | 1.25 | + | L5100 | K06 | 2.47 | K06 | 44.0 | 352M |
| GPS sample | |||||||||||
| B 0019-0001 | 0.305 | S03 | 8.4 | … | - | … | S03 | … | … | 45.09 | 178M |
| B 0830+5813 | 0.094 | S03 | 7.6 | … | - | … | S03 | … | … | 42.84 | 325M |
| B 0941-0805 | 0.228 | S03 | 7.7 | … | - | … | S03 | … | … | … | … |
| B 1819+6707 | 0.221 | S03 | 8.4 | … | - | … | S03 | 2.2 | S99 | 44.25 | 325M |
| B 1144+3517 | 0.063 | S03 | 8.2 | … | - | … | S03 | … | … | 42.93 | 151M |
| B 1946+7048 | 0.101 | S03 | 7.9 | … | - | … | S03 | 2.15 | S99 | 43.56 | 325M |
| B 2352+4933 | 0.238 | S03 | 8.2 | … | - | … | S03 | … | … | 44.65 | 151M |
| B 0537+6444 | 2.417 | S99 | 7.7 | -0.29 | + | S99 | … | … | 45.39 | 325M | |
| B 0544+5847 | 2.860 | S99 | 8.0 | -0.91 | + | S99 | … | … | 45.77 | 325M | |
| B 0601+5753 | 1.840 | S99 | 7.9 | -0.53 | + | S99 | … | … | 45.16 | 325M | |
| B 0755+6354 | 3.005 | S99 | 8.3 | -0.41 | + | S99 | … | … | 45.72 | 325M | |
| B 0758+5929 | 1.977 | S99 | 8.1 | -1.05 | + | S99 | … | … | 45.84 | 325M | |
| B 0826+7045 | 2.008 | S99 | 8.5 | -0.93 | + | S99 | … | … | 45.46 | 325M | |
| B 1538+5920 | 3.880 | S99 | 7.7 | -0.16 | + | S99 | … | … | 45.99 | 325M | |
| B 1550+5815 | 1.320 | S99 | 8.9 | -0.65 | + | S99 | … | … | 45.42 | 325M | |
| B 1622+6630 | 0.202 | S99 | 7.7 | -0.94 | + | S99 | 2.15 | S99 | 43.26 | 325M | |
| B 1642+6701 | 1.895 | S99 | 9.1 | -0.79 | + | S99 | … | … | 45.89 | 325M | |
| B 1647+6225 | 2.180 | S99 | 7.2 | -0.38 | + | S99 | … | … | 45.50 | 325M | |
| B 1746+6921 | 1.886 | S99 | 7.5 | -0.22 | + | S99 | … | … | 45.65 | 325M |
Table 1. (Continued)
| Source | z | Refs. | Method 1 | Method 2 | Refs. | Refs. | Band | ||||
|---|---|---|---|---|---|---|---|---|---|---|---|
| log () | log | log (km/s) | log | ||||||||
| (1) | (2) | (3) | (4) | (5) | (6) | (7) | (8) | (9) | (10) | (11) | (12) |
| B 1945+6024 | 2.700 | S99 | 7.5 | -0.70 | + | S99 | … | … | 45.61 | 325M | |
| B 1958+6158 | 1.820 | S99 | 7.8 | -0.21 | + | S99 | … | … | 45.53 | 325M | |
| B 0237-233 | 2.223 | S99 | 9.5 | -0.77 | + | S99 | … | … | 47.26 | 365M | |
| B 0457+24 | 2.384 | S99 | 8.8 | -0.77 | + | S99 | … | … | 46.61 | 365M | |
| B 2126-158 | 3.270 | S99 | 9.2 | -0.56 | + | S99 | … | … | 46.30 | 333M | |
| B 2134+004 | 1.936 | S99 | 9.1 | -0.77 | + | S99 | … | … | 46.88 | 365M | |
| OQ 172 | 3.544 | O98 | 9.6 | -0.10 | + | H03 | 2.97 | H03 | 47.61 | 408M | |
| 4C 12.50 | 0.124∗ | O98 | 7.8 | … | - | … | D06 | 2.77 | G94 | 44.62 | 178M |
: S89: Spencer et al. (1989); H08: Holt, J. et al. (2008); M97: Morganti et al. (1997); J05: Johnston et al. (2005); E04: Edwards & Tingay (2004); G06: Gallo et al. (2006); K06: Komossa et al. (2006); S03: Snellen et al. (2003); S99: Snellen et al. (1999); O98: O’Dea (1998); M06: McLure et al. (2006); J91: Jackson & Browne (1991); C97: Corbin (1997); S07: Sikora et al. (2007); W02: Woo & Urry (2002); L96: Lawrence et al. (1996); H03: Hirst et al. (2003); C91: Corbin (1991); D03: D’Elia et al. (2003); G94: Gelderman & Whittle (1994); X08: Xie et al. (2008); M04: Marchesini et al. (2004); B90: Barthel, Tytler, & Thomson (1990); P06: Peng et al. (2006); H06: Holt et al. (2006); D06: Dasyra et al. (2006).
:
(a) The redshifts are selected from NED1, and the redshifts with stars are updated in Holt et al. 2008.
(b) Methods for calculating the BH masses in column 4 as described in section 3.1.
(c) Data used to calculate the bolometric luminosities in column 5 as described in section 3.2.
(d) References for related data used in columns 6 and 7.
(e) The BH mass is calculated from the relation between ionizing luminosity and BH mass (refer D’Elia et al. 2003 for more details).
2 Sample
Our goal is to investigate the nuclear properties (e.g., accretion and jet) and their possible relation to the kinematics of the [O III] emission line in the compact radio galaxies (CSS/GPS sources), whose selection is unbiased with respect to the nuclear properties themselves. For each source, we must be able to estimate the BH mass, and/or bolometric luminosity, jet power, the [O III] kinematics (e.g., FWHM). We present 38 CSS sources, of which 27 sources are selected from Spencer et al. (1989) and the other 11 sources are selected from different papers (see Table 1 for references). We also selected 27 GPS sources from the literature from various surveys (e.g., Snellen et al. 1999, 2003), of which two sources (OQ 172 and 4C 12.50) were defined as CSS sources in Spencer et al. (1989), but later were defined to be GPS sources according to their radio spectra and sizes (e.g., O’Dea 1998 and references therein). Therefore, our sample includes 65 compact radio sources (38 CSS + 27 GPS objects). We note that our sample is a characteristic, rather than complete sample of compact radio sources. The histogram distributions of the redshift for our sample are shown in Figure 1. The dotted-line is for CSS sources, the dashed-line is for GPS sources, and the solid-line is their sum.

Table 1 lists our sample with the relevant information. Columns (1)-(3) give the object’s name, redshift, and references for the classification as CSS/GPS sources. Columns (4)-(8) list the BH masses, Eddington ratios, methods for deriving the BH masses, methods for deriving bolometric luminosities, and references for related information in columns 6 and/or 7. Columns (9)-(10) give and their references. Columns (11)-(12) list the jet power obtained from NED111NASA/IPAC Extragalactic Database; http://nedwww.ipac.caltech.edu, and the waveband in which the power was calculated.

3 Methods
3.1 BH mass estimation
For the RM method, it takes a long time to simultaneously monitor the variability of the broad emission line and the continuum, and then obtain the BLR size. Fortunately, Kaspi et al. (2000) found an empirical correlation between the BLR size and the monochromatic luminosity at 5100. Recently, Kaspi et al. (2005) reinvestigated the relationship between the characteristic BLR size, , and the emission line, X-ray, UV and optical continuum luminosities. Several other empirical relations between and emission line luminosities (e.g., , C IV and Mg II) have also been investigated (e.g., Vestergaard 2002; Greene & Ho 2005a; Kong et al. 2006; McGill et al. 2008). The BH mass then can be estimated with the assumption of virialized gas around the BH,
| (1) |
where the quantity can be estimated from the FWHM of the broad emission lines (), and assuming an isotropic distribution of the BLR clouds (e.g., Wandel et al. 1999; Kaspi et al. 2000).
The optical continuum in the radio loud (RL) AGN may be contaminated by the nonthermal emission from a jet: their optical luminosity and hence the viral BH mass may be over-estimated. In general, steep-spectrum radio sources tend to be oriented with jets pointing away from our line of sight, and the jet contribution at optical waveband may be negligible due to the weakness of beaming effects. Fanti et al. (1990) proposed that CSS sources were not strongly affected by Doppler boosting. Woo & Urry (2002) found that the BH masses derived from the optical luminosities and FWHM of the broad emission lines in RL AGN are consistent with those derived from other independent methods. Therefore, BH masses derived from broad line width and optical continuum/line luminosities for CSS sources should be credible. However, Baker & Hunstead (1995) found that the composite GPS quasar spectrum is clearly different from that of CSS quasars, but similar to that of flat-spectrum radio quasars (FSRQs). If this is true, the optical emission in GPS sources may be strongly contaminated by the synchrotron emission from the jets, as in FSRQs (e.g., Liu et al. 2006). Therefore, we use broad line luminosities to calculated the BH masses for GPS sources in our sample. We list the equations used to estimate BH mass from the broad emission line ( and from Greene & Ho 2005a; Mg II and C IV from Kong et al. 2006),
| (2) |
| (3) |
| (4) |
| (5) |
BH masses for some CSS sources, estimated from the optical luminosity and broad line width, are also selected from the literature directly if there is no line luminosity, but we correct the optical luminosity to our cosmology (see Table 1).
The BH mass can also be derived from the relation (e.g., Tremaine et al. 2002) for nearby AGN (e.g., Gebhardt et al. 2000b),
| (6) |
with an intrinsic scatter dex .
Alternatively, the BH mass can be estimated from the galactic host bulge luminosity. McLure & Dunlop (2002) found that the BH mass is tightly correlated with the luminosity of the host galaxy for a sample of both active and inactive galaxies, with a scatter dex. We use the relation between the host galaxy absolute magnitude at -band and BH mass proposed by McLure et al. (2004),
| (7) |
to estimate the central BH masses for the sources without data for broad emission lines or bulge stellar velocity dispersion.
3.2 Bolometric luminosity estimation
The Bolometric luminosity of AGN is sometimes approximated from the optical luminosity since integration of the spectral energy distribution (SED) is usually hampered by the lack of multi-wavelength observational data that spans many decades in wavelength. It is found that the bolometric luminosity is roughly 10 times the optical luminosity, , where bolometric luminosity was integrated for the SEDs of AGN (e.g., Kaspi et al. 2000; Woo & Urry 2002; see also Vasudevan & Fabian 2007). In this work, we adopt , where (Kaspi et al. 2000). However, the monochromatic optical luminosity cannot be used to derive the bolometric luminosity if beaming is important in radio loud AGN (e.g., BL Lac, FSRQs and maybe also GPS sources in our work). We know that the broad line emission is illuminated by the ionizing luminosity from the central engine, and, therefore, it can be used as a good indicator of thermal optical emission. We can estimate the thermal optical emission using the broad emission lines for the sources in which the optical emission may be contaminated by the jet (BL Lacs, FSRQs, and/or GPS sources). To do so, we fit the bolometric luminosities (assuming ) and the broad line luminosities (, Mg II and C IV) for a sample of radio quiet AGN in Kaspi et al. (2005), where the optical emission is believed to be free from contamination by the nonthermal synchrotron emission (the jet is weak, if present). The luminosities and 5100 monochromatic luminosites are selected from Kaspi et al. (2005) for 35 AGN, of which 27 sources with Mg II luminosities, and 32 sources with C IV luminosities are selected from Kong et al. (2006). The relation between the bolometric luminosities and different broad emission lines (, Mg II and C IV) are shown in Figure 2, and their linear regressions are
| (8) |
| (9) |
| (10) |
With Eqs. 8-10, we can calculate the bolometric luminosities for the radio loud AGN from their broad emission line luminosities, especially for sources that are probably significantly contaminated by the beamed emission from the relativistic jets. We note that our bolometric luminosities derived from the luminosities are roughly 3 times larger than that derived using the popular relation between the bolometric luminosity and the BLR luminosity , where (e.g., Celotti et al. 1997; Liu et al. 2006 and references therein).
3.3 Jet power estimation
Jet power is a fundamental parameter reflecting the energy transport to large spatial scales from the central engine by the radio jet. The jet power can be estimated from the low frequency radio emission, which is usually emitted from the extended optically thin radio lobes, and is free from Doppler beaming due to the low bulk velocity of the lobe motion (e.g., Willott et al. 1999). In this work, we use the formula proposed by Willott et al. (1999),
| (11) |
where is the radio luminosity from the lobes measured at 151 MHz in units of . Willott et al. (1999) have argued that the normalization is uncertain and introduced the factor () to account for these uncertainties. Blundell & Rawlings (2000) argued that is a likely consequence of the evolution of magnetic field strengths as radio sources evolve. In this work, we adopt , and search the low frequency radio data from NED for CSS/GPS sources. The extended emission was corrected to 151 MHz assuming (), and the jet power was then calculated from Eq. 11 (see Table 1).
4 Results
4.1 BH mass, Eddington ratio and jet power
The BH masses of 65 compact radio galaxies (38 CSS+27 GPS objects) are calculated in this work, or collected from the literature, using several different methods as described in Sect. 3.1. We find that the BH masses vary by several orders from -, for both CSS and GPS sources. The histogram distributions of the BH masses are shown in Figure 3, the dotted-line, dashed-line and solid-line are for CSS sources, GPS sources, and the whole sample respectively. We find that the average logarithmic BH masses are =8.31, 8.23, 8.28 for 38 CSS sources, 27 GPS sources, and the whole sample respectively.


The correlation between the bolometric luminosities and broad emission line luminosities (, Mg II and C IV) for a sample of radio quiet AGN are explored in this work (see Figure 2 and Sect. 3.2 for more details). We then calculate the bolometric luminosities for all GPS sources, and some of CSS sources from their broad emission lines with the above empirical correlations (Eqs. 8-10), except for those with bolometric luminosities derived from their SED fittings. The Eddington ratios are calculated with , where . We find that young radio galaxies (GPS/CSS sources) have relatively high Eddington ratios, several (see Figure 4). The average logarithmic Eddington ratios are =-0.55, -0.58 and -0.56 for the 32 CSS sources, the 19 GPS sources, and their sum, respectively.
It is found that the jet power ranges from to for both the CSS and GPS sources. The histogram distributions of the jet power for the CSS/GPS sources are shown in Figure 5. The average logarithmic jet powers are =46.1 and 45.3 for the 37 CSS and the 26 GPS sources respectively. The average jet power in the CSS sources is larger than that of the GPS sources based on our sample.

4.2 [O III] kinematics and accretion/jet properties
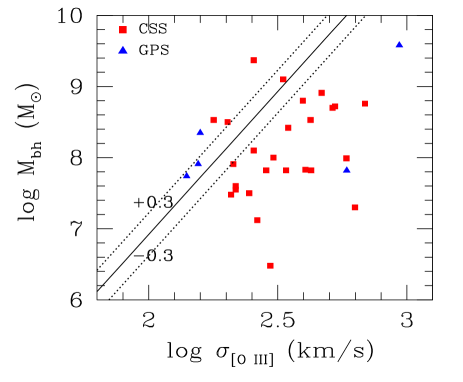
Figure 6 plots BH mass, , versus velocity dispersion, , derived from FWHM(O III), which includes 23 CSS (squares) and 5 GPS sources (triangles). The solid line is the relation of Tremaine et al. (2002) obtained for 31 nearby inactive galaxies. It is clear that the CSS sources systematically deviate from the Tremaine et al. relation. Two of the five GPS sources also deviate substantially (OQ 172 and 4C 12.50).
We calculate the deviation for our sample with the measured , where is calculated from the Tremaine et al. relation (Eq. 6) with the estimated BH mass. Figure 7a and 7b plot versus jet power, , and bolometric luminosity, , respectively. Using the Spearman rank correlation analysis, there are no significant correlations between and ( and =0.51) or between and ( and =0.59).
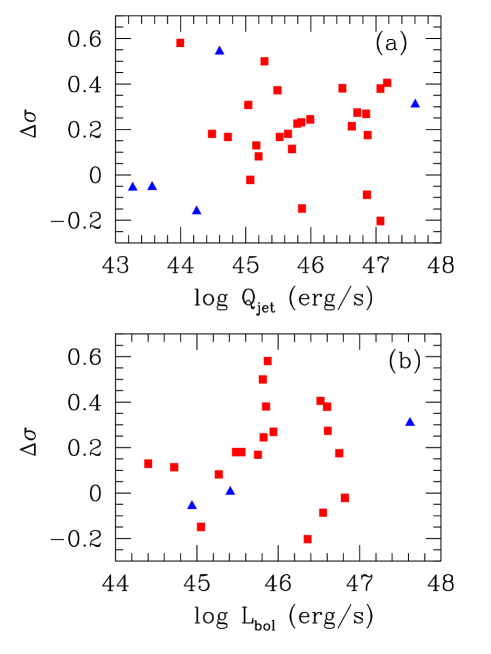
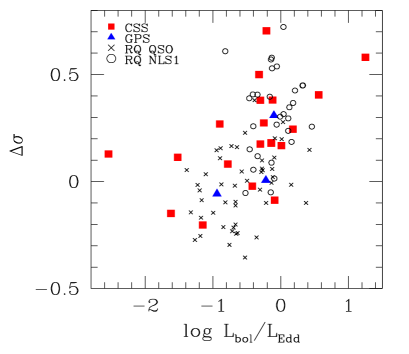
Figure 8 plots versus Eddington ratio for the compact radio galaxies (20 CSS + 3 GPS sources). We find a significant correlation between and for these 23 young radio sources, with the Spearman correlation coefficient and probability . For comparison with the radio quiet AGN (the jet is weak, if present), we also calculate and the Eddington ratio for 31 NLS1s (circles) and 49 QSOs (crosses). The NLS1s are selected from Grupe & Mathur (2004) and QSOs are selected from Shields et al. (2003), where BH masses are calculated from and the broad line width, and bolometric luminosities are calculated from . We find that the relation, -, in the young radio galaxies (GPS/CSS) is similar to that of radio quiet AGN, and the sources with 1 have the largest deviations (see Figure 8).
5 Discussion
In this paper we investigate the central engine properties for a sample of young radio galaxies (CSS/GPS sources), i.e., BH masses, Eddington ratios, jet powers, and then explore the possible relation between kinematics of [O III] narrow line and accretion/jet activities.
The BH masses of the young radio galaxies are estimated from several empirical relations in this work, as described in Sect. 3.1, and some BH masses are selected from the literature after correcting to our cosmology, if the luminosities are used in deriving BH masses. We find that most of the BH masses are in the range of - for both CSS and GPS sources (Figure 3), which are typical BH masses for normal AGN. The mean BH mass of the 38 CSS sources is similar to that of the 27 GPS sources in our sample, with no evident difference between them. More complete sample is desired to further test this issue. However, the mean BH mass of young radio galaxies (CSS/GPS sources, 8.3) is systematically less than that of radio loud QSOs (9.1, e.g., Marchesini et al. 2004) or low redshift radio galaxies (8.9, e.g., Bettoni et al. 2003). One of the possible physical reasons is that the BHs in young radio galaxies are still growing rapidly.
The bolometric luminosities for young radio galaxies are estimated from SED fitting, monochromatic optical luminosities or broad line luminosities (see Sect. 3.2 for details). The bolometric luminosities of some CSS/GPS sources are not estimated due to a lack of information on their classification (e.g., type I or II) where optical luminosities and then bolometric luminosities may be underestimated if they are obscured by the putative torus. Normally, steep-spectrum radio sources do not suffer from strong contamination from the Doppler-boosted emission from the jet, due to the possible large inclination angles. However, there is some evidence from radio variability that at least some of the GPS sources are Doppler-boosted (e.g., O’Dea 1998, and references therein). The optical composite spectrum of some GPS sources is also clearly different from that of CSS sources, which is similar to that of FSRQs and may be contaminated by the nonthermal emission from jets (e.g., Baker & Hunstead 1995). Therefore, the bolometric luminosities of all GPS sources are calculated from the broad line luminosities (if present) using our empirical correlations constrained from a sample of radio quiet AGN (Eqs. 8-10). We estimate the Eddington ratios, , from estimated BH masses and bolometric luminosities, and find that all CSS/GPS sources are high Eddington ratio systems (several, see Figure 4). The mean Eddington ratios are =-0.55 and -0.58 for CSS and GPS sources respectively, which are higher than that of broad line radio galaxies =-1.91 or radio loud QSOs (=-1.11, e.g., Marchesini et al. 2004), but similar to those of NLS1s (-0.8, e.g., Bian et al. 2008). Our results suggest that these young radio galaxies are also in the early stage of the accretion activity and that the BHs are still growing rapidly. Czerny et al. (2009) proposed that the short-lived young radio galaxy may be due to the intermittent activity caused by the radiation pressure instability in the accretion disk, where the instability occurred when the accretion rate (in the Eddington unit) exceeds a few percent. It should be noted that most of the young radio galaxies in our sample are high Eddington ratio sources (see Figure 4), which may have suffered the radiation pressure instabilities. If this is true, the radiation pressure instability will offer an interesting physical mechanism for the possibly short-lived young radio galaxies (Wu 2009, in preparation).
Kawakatu et al. (2009) found that young radio loud AGN favor an accretion disc without the big blue bump of the standard accretion disc, based on photoionization modeling of various narrow emission lines, and suggested that the accretion mode in these young radio galaxies may be though advection dominated accretion flow (ADAF, see Narayan & McClintock for a recent review and references therein). It is widely believed that optically thin ADAF exists only for Eddington ratios less than a critical value (e.g., Narayan & Yi 1995), and the accretion mode should transit to an optically thick standard accretion disc when the Eddington ratio larger than this critical value (e.g., Wu & Gu 2008 and references therein). However, our results show that nearly all the young radio galaxies in our sample have Eddington ratios larger than this critical value, and, therefore, it does not support the ADAF scenario. The difference in the narrow line ratios between young radio loud AGN and radio quiet Seyfert 2 galaxies in Kawakatu et al. (2009) may be caused by other factors.
The width of the [O III] emission line has been used as a proxy for stellar velocity dispersion to derive the BH masses in AGN, even through the scatter is large (e.g., Nelson 2000; Boroson 2003; Shields et al. 2003; Bonning et al. 2005). However, previous studies of NLS1 galaxies, employing different samples and methods, led to partially conflicting results in that the NLS1 galaxies are systematically off the relation if is assumed (e.g., Bian & Zhao 2004; Grupe & Mathur 2004; Komosssa & Xu 2007). The [O III] width seems to be broader than gravitational velocities in these NLS1s. It has been shown that CSS sources also tend to have rather broad [O III] emission lines (e.g., Gelderman & Whittle 1994; Nelson & Whittle 1996; Tadhunter et al. 2001; O’Dea et al. 2002; Holt et al. 2008). However, a direct comparison of [O III] width with the central BH mass has not yet been made so far. We estimate the BH masses for a sample of young radio galaxies (CSS/GPS sources) in this work, and find that most of the sources lie systematically off the relation, when using , as found for NLS1s (see Figure 6). A difference is that more than 50% of BH masses in young radio galaxies are larger than and many of them have broad line widths of , while most BH masses of NLS1s are less than with broad line widths of (e.g., Grupe & Mathur 2004). Therefore, the BH mass is not the key parameter causing the deviation of [O III] emission line width. We note that the extreme [O III] kinematic components, as strong wings with blueshifts up to 2000 km/s, are found in both radio quiet NLS1s (e.g., Aoki et al. 2005; Bian et al. 2005; Komossa et al. 2008) and young radio galaxies (e.g., Tadhunter et al. 2001; Holt et al. 2008), and these strong blue wings are often not well included in the FWHM fittings. However, the sources with extreme kinematics are still rare (e.g., Bian et al. 2005), which will not change our main conclusion.
In the standard model, the narrow emission lines are excited through photoionization by the UV continuum produced by the accretion disc. The situation is more complicated in radio galaxies, since shocks caused by the interaction of jet and interstellar medium may also be important for the morphology, kinematics, and excitation of the narrow emission lines. Inskip et al. (2002) investigated eight 6C radio galaxies at redshift and concluded that combination of accretion disc photoionization and shock photoionization provide the best explanation of their spectra. Furthermore, by modeling the ratios of different narrow emission lines with shock and AGN photoionization models, Moy & Rocca-Volmerange (2002) suggested that the shock ionization may be dominant for radio sources with intermediate radio sizes (2 kpc150 kpc, e.g., CSS sources), while AGN photoionization is dominant by the most compact radio sources (2 kpc, e.g., GPS sources) and the extended sources with 150 kpc. We note that there are two GPS sources (OQ 172 and 4C 12.50) with radio sizes of less one kpc, which also show large deviations in their [O III] width (Figure 6). More compact GPS sources are needed to further test this issue.
The jet-cloud interaction is expected to produce extreme kinematics of narrow emission lines, and the jet-driven outflows provide a convenient mechanism to explain the highly broadened line profile, large velocity shift, and strong alignment between radio jet and optical line in young radio galaxies (e.g., de Vries et al. 1997, 1999; Axon et al. 2000; Tadhunter et al. 2001; Holt et al. 2003, 2006, 2008; Labiano et al. 2005). We investigate the possible relation between the deviation of [O III] line width and the jet power of young radio galaxies. However, there is no significant correlation between them based on our sample. Therefore, the jet power should be not the only parameter caused the extreme [O III] kinematics if the jet-driven scenario is indeed important.
The Eddington ratio, which is proportional to the accretion rate per unit BH mass, characterizes the extent to which radiation pressure competes with gravity in the nucleus, and may also play an important role in shaping the kinematics of the [O III] emission line apart from the primary driver of gravitational potential of the bulge (e.g., Greene & Ho 2005b). After removing the blue wings, the core component of is still a good proxy of stellar velocity dispersion (e.g., Greene & Ho 2005b; Komossa & Xu 2007). Blue wings are always found in NLS1s with high Eddington ratios (, e.g., Komossa et al. 2008), which may result from the winds/outflows driven by the strong radiation pressure in these high Eddington ratio sources. It is interesting to note that most of young radio galaxies also have high Eddington ratios, which are similar to those of NLS1s (Figure 3). We find that the deviations of the [O III] emission line in these young radio galaxies, , are also well correlated to the Eddington ratios (see Figure 8). In particular, the young radio sources with Eddington ratios have the largest deviations, which are also similar to those of radio quiet NLS1 galaxies (see Figure 8). The similarity in [O III] width deviations between radio loud CSS/GPS sources and radio quiet AGN (QSOs and NLS1s) suggests that the accretion activities may play a more important role than the jet activities in shaping the kinematics of [O III] narrow emission line, since the jet is absent or weak in radio quiet AGN. The alignment of the narrow emission-line gas with the radio jet is always used to as an evidence for the shock scenario (e.g., de Vries et al. 1997; de Vries et al. 1999; Axon et al. 2000; Privon et al. 2008). However, it should be also natural for the alignment of radio jet and [O III] emission line if the outflow is driven by the radiation pressure caused by accretion activities.
6 Summary
Using a sample of 65 young radio galaxies (38 CSS + 27 GPS sources) selected from the literature, we estimate BH masses, Eddington ratios, and investigate the possible physical reasons for deviations of width of [O III] narrow emission line. The main results can be summarized as follows:
(1) The BH masses in young radio galaxies (CSS/GPS sources) range from -, which is the typical value in AGN (see also Gu et al. 2009), and the mean value is 8.3 which is less than that of radio loud QSOs or low redshift radio galaxies (9.0, e.g., Marchesini et al. 2004; Bettoni et al. 2003).
(2) Most of the CSS/GPS sources have relatively high Eddington ratios, with mean value =-0.56, which are similar to those of NLS1s. This result supports the idea that the young radio galaxies are not only in the early stage of jet activities but also in an early stage of accretion activities.
(3) The relation in young radio galaxies systematically deviates that defined by nearby inactive galaxies, and reminiscent of NLS1s. We find that the deviation of the [O III] width is not related to the jet power or accretion power, but is related to the Eddington ratio (Figures 6, 7, and 8). There is no evident difference between the radio loud CSS/GPS sources and radio quiet QSOs/NLS1s in the - relation, which may suggest that accretion activities may still play an important role in shaping the kinematics of the [O III] emission line in these young radio galaxies, since that radio jet is weak or absent in radio quiet AGN.
ACKNOWLEDGMENTS
We thank the referee for constructive comments that helped to clarify the paper. We also thank Xinwu Cao, Andrew Humphrey and Minfeng Gu for their careful reading of the manuscript, valuable discussions and comments. This research has made use of the NASA/IPAC Extragalactic Database (NED) which is operated by the Jet Propulsion Laboratory, California Institute of Technology, under contract with the National Aeronautics and Space Administration. This work is partly supported by the NSFC (grants number 10703009).
References
- (1) Aoki K., Kawaguchi T., Ohta K. 2005, ApJ, 618, 601
- Axon et al. (2000) Axon D. J. et al. 2000, AJ, 120, 2284
- Barth et al. (2005) Barth A. J., Greene J. E., Ho L. C. 2005, ApJ, 619, 151
- (4) Barthel P. D., Tytler D. R., Thomson, B. 1990, A&AS, 82, 339 (B90)
- Baker & Hunstead (1995) Baker J. C., Hunstead, R. W. 1995, ApJ, 452, 95
- (6) Bettoni D., Falomo R., Fasano G., Govoni F. 2003, A&A, 399, 869
- Bian & Zhao (2004) Bian W. & Zhao Y. 2004, MNRAS, 352, 823
- Bian et al. (2005) Bian W., Yuan Q., & Zhao Y. 2005, MNRAS, 364, 187
- (9) Bian W.-H., Hu C., Gu Q.-S., Wang J.-M. 2008, MNRAS, 390, 752
- Blandford & McKee (1982) Blandford R. D. & McKee C. F. 1982, ApJ, 255, 419
- Blundell & Rawlings (2000) Blundell K. M., Rawlings S., 2000, AJ, 119, 1111
- (12) Bonning E. W., Shields G. A., Salviander S., McLure R. J. 2005, 626, 89
- Boroson (2002) Boroson T. A. 2002, ApJ, 565, 78
- Boroson (2003) Boroson T. A. 2003, ApJ, 585, 647
- Celotti et al. (1997) Celotti A., Padovani P., Ghisellini G. 1997, MNRAS, 286, 415
- (16) Czerny, B., et al. 2009, ApJ, in press (arXiv:0903.3940)
- (17) Corbin M. R. 1991, ApJ, 375, 503 (C91)
- (18) Corbin M. R. 1997, ApJS, 113, 245 (C97)
- (19) Dasyra K. M. et al. 2006, ApJ, 638, 745 (D06)
- (20) D’Elia V., Padovani P., Landt H. 2003, MNRAS, 339, 1081 (D03)
- de Vries et al. (1997) de Vries W. H. et al. 1997, ApJS, 110, 191
- de Vries W. H. et al. (1998) de Vries W. H. et al. 1998, ApJ, 503, 138
- de Vries et al. (1997) de Vries W. H., O’Dea C. P., Baum S. A., Barthel P. D. 1999, ApJS, 526, 27
- Di Matteo et al. (2005) Di Matteo ., Springel, V., & Hernquist, L. 2005, Nature, 433, 604
- (25) Edwards, P. G., Tingay, S. J. 2004, A&A, 42, 91 (E04)
- Fanti et al. (1990) Fanti R. et al. 1990, A&A, 231, 333
- Fanti et al. (1995) Fanti C. et al., 1995, A&A, 302, 317
- Fanti et al. (1998) Fanti C. et al. 2000, A&A, 358, 499
- Ferrarese & Merritt (2000) Ferrarese L. & Merritt D. 2000, ApJ, 539, 9
- Gallo et al. (2006) Gallo L. C. et al. 2006, MNRAS, 370, 245 (G06)
- Gebhardt et al. (2000a) Gebhardt K. et al. 2000a, ApJ, 539, 13
- Gebhardt et al. (2000b) Gebhardt K. et al. 2000b, ApJ, 543, 5
- (33) Gelderman R. & Whittle M. 1994, ApJS, 91, 491 (G94)
- Greene & Ho (2005a) Greene J. E. & Ho L. C. 2005a, ApJ, 630, 122
- Greene & Ho (2005b) Greene J. E. & Ho L. C. 2005b, ApJ, 627, 721
- Grupe (2004) Grupe D. 2004, AJ, 127, 1799
- Grupe & Mathur (2004) Grupe D. & Mathur S. 2004, ApJ, 606, 41
- Gu et al. (2009) Gu M. F., Park S., Ho L. C. 2009, AN, 330, 253
- Gu et al. (2001) Gu M. F., Cao X. W., Jiang D. R. 2001, MNRAS, 327, 1111
- Harms et al. (1994) Harms R. J. et al. 1994, ApJ, 435, 35
- Heckman et al. (1986) Heckman, T. M. et al. 1986, 311, 526
- (42) Hirst P., Jackson N., Rawlings S., 2003, MNRAS, 346, 1009 (H03)
- Holt et al. (2003) Holt J., Tadhunter C. N., Morganti R. 2003, 342, 227
- Holt et al. (2006) Holt J. et al. 2006, MNRAS, 370, 1633 (H06)
- Holt et al. (2008) Holt J., Tadhunter C. N., Morganti R. 2008, MNRAS, 387, 639 (H08)
- (46) Humphrey A. et al. 2008, MNRAS, 383, 11
- (47) Inskip K. J. et al., 2002, MNRAS, 337, 1381
- (48) Jackson N., Browne I. W. A. 1991, MNRAS, 250, 414 (J91)
- (49) Johnston H. M., Hunstead R. W., Cotter G., Sadler E. M. 2005, MNRAS, 356, 515 (J05)
- Kaspi et al. (2000) Kaspi S. et al. ApJ, 2000, 533, 631
- Kaspi et al. (2005) Kaspi S., Maoz D., Netzer H., Peterson B. M., Vestergaard M., Jannuzi B. T. ApJ, 2005, 629, 61
- (52) Kawakatu N., Nagao T., Woo J.-H. 2009, ApJ, 693, 1686
- Komossa (2006) Komossa S. et al. 2006, ApJ, 132, 531 (K06)
- Komossa & Xu (2007) Komossa S., Xu D. 2007, ApJ, 667, 33
- Komossa et al. (2008) Komossa S., Xu D., Zhou H., Storchi-Bergmann T., Binette L. 2008, ApJ, 680, 926
- Kong et al. (2006) Kong M.-Z., Wu X.-B., Wang R., & Han, J.-L. 2006, ChJAA, 6, 396
- Kormendy (1988) Kormendy J. 1988, ApJ, 335, 40
- Kormendy & Gebhardt (2001) Kormendy J. & Gebhardt K. 2001,AIPC, 586, 363
- Labiano et al. (2005) Labiano A. et al. 2005, A&A, 436, 493
- Labiano (2008) Labiano A. 2008, MNRAS, 488, 59
- (61) Lawrence C. R. et al. 1996, ApJS, 107, 541 (L96)
- Liu et al. (2006) Liu Y., Jiang D. R., Gu M. F. 2006, ApJ, 637, 669
- (63) Marchesini D., Celotti, A. Ferrarese, L. 2004, 351, 733 (M04)
- McLure & Dunlop (2002) McLure R. J. & Dunlop J. S. 2002, MNRAS, 331, 795
- McLure & Dunlop (2004) McLure R. J. et al. 2004, MNRAS, 351, 347
- (66) McLure R. J., Jarvis M. J., Targett T. A., Dunlop J. S., Best P. N. 2006, MNRAS, 368, 1395 (M06)
- (67) McGill, K. L., Woo, J.-H., Treu, T., Malkan, M. A. 2008, ApJ, 673, 703
- Mineshige et al. (2000) Mineshige S., Kawaguchi T., Takeuchi M., & Hayashida K. 2000, PASJ, 52, 499
- (69) Moy E., Rocca-Volmerange B. 2002, A&A, 383, 46
- (70) Morganti, R., Tadhunter, C. N., Dickson, R., Shaw, M. 1997, A&A, 326, 130 (M97)
- Murgia M. et al. (1999) Murgia M. et al. 1999, A&A, 345, 769
- (72) Narayan R., Yi I., 1995, ApJ, 452, 710
- (73) Narayan R., McClintock, J. E. 2008, NewAR, 51, 733
- Nelson & Whittle (1996) Nelson C. H., Whittle M. 1996, ApJ, 454, 96
- Nelson (2000) Nelson C. H. 2000, ApJ, 544, 91
- O’Dea (1998) O’Dea C., 1998, PASP, 110, 493 (O98)
- O’Dea et al. (2002) O’Dea C. P. et al. 2002, AJ, 123, 2333
- Owsianik & Conway (1998) Owsianik I., & Conway J. E 1998, A&A, 337, 690
- (79) Peng C. Y., Impey C. D., Ho L. C., Barton E. J., Rix H.-W. 2006, ApJ, 640, 114 (P06)
- Peterson (1993) Peterson B. M. 1993, PASP, 105, 247
- Peterson et al. (2004) Peterson B. M. et al. 2004, ApJ, 613, 682
- Privon et al. (2008) Privon G. C et al. 2008, ApJS, 175, 423
- (83) Shields G. A. et al. 2003, ApJ, 583, 124
- (84) Sikora M., Stawarz L. Lasota J.-P. 2007, ApJ, 658, 815 (S07)
- (85) Snellen, I. A. G., et al. 1999, MNRAS, 307, 149 (S99)
- Snellen et al. (2003) Snellen I. A. G., Mack K.-H., Schilizzi R. T., & Tschager W. 2003, PASA, 20, 38
- (87) Snellen I. A. G., Lehnert M. D., Bremer M. N., Schilizzi R. T. 2003, MNRAS, 342, 889 (S03)
- Spencer et al. (1989) Spencer R. E., McDowell J. C., Charlesworth M., Fanti C., Parma P., Peacock, J. A. 1989, MNRAS, 240, 657
- Stanghellini et al. (1993) Stanghellini C., O’Dea C. P., Baum S. A., & Laurikainen, E. 1993, ApJS, 88, 1
- Tadhunter et al. (2001) Tadhunter C., Wills K., Morganti R., Oosterloo T., Dickson, R. 2001, MNRAS, 327, 227
- Tremaine et al. (2002) Tremaine S. et al. 2002, ApJ, 574, 740
- van Breugel (1984) van Breugel W. J. M., 1984, in Fanti, R., Kellerman, K. I., Proc. IAU Symp. 110, VLBI and Compact Radio Sources. Reidel, Dordrecht, P. 59
- Vestergaard (2002) Vestergaard M. 2002, ApJ, 571, 733
- Vasudevan & Fabian (2007) Vasudevan R. V., Fabian, A. C. 2007, MNRAS, 381, 1235
- Wandel et al. (1999) Wandel A., Peterson B. M., & Malkan, M. A. 1999, ApJ, 526, 579
- (96) Woo J.-H., Urry C. M. 2002, ApJ, 579, 530 (W02)
- (97) Wu Q. W., Gu M. F. 2008, ApJ, 682, 212
- Wu et al. (2004) Wu X.-B., Wang R., Kong M. Z., Liu F. K., Han, J. L. 2004, A&A, 424, 793
- (99) Xie Z. H.,Hao J. M., Du L. M., Zhang X., Jia Z. L. 2008, PASP, 120, 477 (X08)