Low, Milky-Way like, Molecular Gas Excitation of Massive Disk Galaxies at
Abstract
We present evidence for Milky-Way-like, low-excitation molecular gas reservoirs in near-IR selected massive galaxies at , based on IRAM Plateau de Bure Interferometer CO[3-2] and NRAO Very Large Array CO[1-0] line observations for two galaxies that had been previously detected in CO[2-1] emission. The CO[3-2] flux of at is comparable within the errors to its CO[2-1] flux, implying that the CO[3-2] transition is significantly sub-thermally excited. The combined CO[1-0] observations of the two sources result in a detection at the level that is consistent with a higher CO[1-0] luminosity than that of CO[2-1]. Contrary to what is observed in submillimeter galaxies and QSOs, in which the CO transitions are thermally excited up to , these galaxies have low-excitation molecular gas, similar to that in the Milky Way and local spirals. This is the first time that such conditions have been observed at high redshift. A Large Velocity Gradient analysis suggests that molecular clouds with density and kinetic temperature comparable to local spirals can reproduce our observations. The similarity in the CO excitation properties suggests that a high, Milky-Way-like, CO to H2 conversion factor could be appropriate for these systems. If such low-excitation properties are representative of ordinary galaxies at high redshift, centimeter telescopes such as the Expanded Very Large Array and the longest wavelength Atacama Large Millimeter Array bands will be the best tools for studying the molecular gas content in these systems through the observations of CO emission lines.
Subject headings:
cosmology: observations — galaxies: evolution — galaxies: formation — galaxies: high-redshift — galaxies: starburst1. Introduction
Daddi et al. (2008; D08 henceforth) recently reported the discovery of large molecular gas reservoirs inside near-IR selected galaxies with star formation rates and stellar masses at redshift . The SFR in these systems is an order of magnitude lower than in submillimeter galaxies (SMGs) and QSOs that were also previously detected in molecular gas emission at high redshift (e.g., Greve et al., 2005; Riechers et al., 2006). The CO[2-1] luminosities derived from IRAM Plateau de Bure Interferometer (PdBI) observations of two sources — and at and respectively — imply star-formation efficiencies (SFEs) similar to those of local spirals, an order of magnitude lower than those in submillimeter selected sources. The low SFEs suggest that these objects behave as scaled-up versions of local spirals, with long lasting, low-efficiency star-formation. Given the disk-like UV rest-frame morphology of these objects in deep HST+ACS imaging, and the good agreement between the UV and radio/mid-IR star formation rates, D08 suggested that star formation in these galaxies is taking place in disk-wide extended gas reservoirs. This is contrary to major merger-triggered nuclear starbursts as seen in local ULIRGs and distant SMGs, despite the fact that the SFRs and star formation surface densities in these objects are similar to those of local starbursts and ULIRGs. Given that both galaxies observed in CO by D08 were detected with large CO luminosities, and that the space density of similar sources is 10–30 larger than that of SMGs (Daddi et al. 2007), this suggests that such a quiescent gas-consumption activity could be a prevalent mode of star-formation and galaxy growth in the distant universe.
In order to gain insights on the physical properties of the molecular gas and thus on the nature of the star formation in these galaxies it is important to investigate the CO excitation properties. In galaxies like the Milky Way (Fixsen et al., 1999) and local star-forming spiral galaxies (e.g., Braine & Combes, 1992; Young et al., 1995; Mauersberger et al., 1999; Crosthwaite & Turner, 2007; Papadopoulos & Seaquist, 1998) the molecular gas has relatively low excitation and is rather diffusely distributed (low density and temperature), resulting in a high CO to H2 conversion factor. In contrast, dusty starburst systems like ULIRGs in the local Universe and SMGs and QSOs in the distant universe have very dense and warm gas (e.g., Tacconi et al., 2006, 2008; Weiß et al., 2005a, b; Riechers et al., 2006; Downes & Solomon, 1998), with a CO spectral energy distribution showing thermalized emission up to at least the rotational transition (Weiß et al., 2007b), and a CO to H2 conversion factor about 5 times lower than in typical spirals (Solomon & Vanden Bout, 2005). Despite many CO observations at high redshift, no evidence for Milky-Way-like CO excitation has been found so far. This result may be biased by the pre-selection of the most IR-luminous galaxies for study, and by the prevalence of high frequency, high-J transition observations.
Here we present multi-J CO observations based on PdBI and Very Large Array (VLA) observations for two BzK-selected galaxies previously detected in CO[2-1] with the aim to estimate the excitation properties of CO in these sources.
2. Observations
2.1. Plateau de Bure Observations
We observed at in the CO[3-2] transition (rest-frame 345.796 GHz) with the PdBI in D-configuration in May and June 2008. The on-source observing time was 9.7 hours with the full array (six antennae) and a beam size of . We tuned the receivers to 136.970 GHz (2mm window), slightly offset to the frequency of the CO[3-2] line at at 137.112 GHz. The total bandwidth of our dual polarization mode observations was 1 GHz (corresponding to 2200 km s-1). The correlator has 8 independent units each covering 320 MHz (128 channels each with a width of 2.5 MHz). The phase center was 7.5″ away from the position of in order to target the SMG GN20 during the same observations (Daddi et al. 2009). All the values quoted below were corrected for a primary beam attenuation (PBA) of 11%. We reduced and calibrated the data with the GILDAS software packages CLIC and MAP. The final data, imaged using natural weighting, have a noise of 0.11 mJy integrated over the full 1 GHz bandwidth. In addition to the CO[2-1] dataset already presented by D08, we also use CO[2-1] observations of both BzK galaxies obtained with IRAM PdBI in B-configuration (synthesized beam ) that have been already presented in Daddi et al. (2009). The new data solidly confirm the CO[2-1] detections of D08. Our flux calibration in both the 2mm and 3mm observations with IRAM PdBI is primarily based on measurements of the standard calibrator for which accurate models of the spectrum at these frequencies are available. The knowledge of the typical ranges of PdBI antennas efficiencies at the various frequencies can also be used as a cross check of the flux calibration. Overall, we estimate that the typical accuracy on the absolute flux calibration for our observations are within a range of 10% in the 3mm band and 22% in the 2mm band. To the measurement errors, we add in quadrature uncertainties corresponding to half those ranges for the estimate of the total error budget on fluxes and luminosities in each observing transition.
2.2. Very Large Array Observations
We observed both sources — and — with the VLA in D-configuration in August and September 2008 (synthesized beam of ). In order to measure the CO[1-0] transition (rest-frame 115.271 GHz) we used two contiguous 50 MHz IF bands tuned at 45.6851 GHz and 45.7351 GHz for and at 46.7351 GHz and 46.7851 GHz for . The total bandwidth of 100 MHz corresponds to about 650 km s-1 in velocity space, which covers well most of the emission lines. The total integration time was 21 h and 28 h on-source for and , respectively. We reduced and calibrated the data with standard techniques using AIPS. Given that summer time observations with the VLA can be subject to bad phase stability, we employed fast switching phase calibration using the calibrator J1302578. We also included cycles where we switched to a position near to the phase calibrator, and used these data to check the phase coherence time. From this we measured the flux correction factor due to de-coherence of 24% for and 15% for . We correct our measurements by these factors to account for these small losses of signal. The final maps (100 MHz bandwidth) have rms noise levels of 0.11 mJy and 0.13 mJy for and , respectively, once corrected for de-coherence and PBA at the 10% level. For the VLA observations, by monitoring the bootstrapped flux of the phase calibrator over the observing days, we estimate a gain calibration uncertainty in a range of 14%, small compared to the typical measurement uncertainties for our objects (see next section).
3. Results
3.1. CO[3-2] in
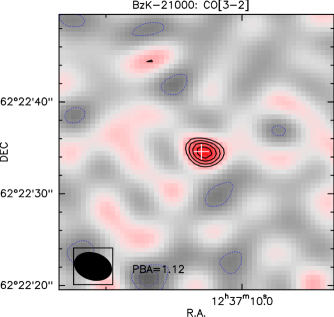
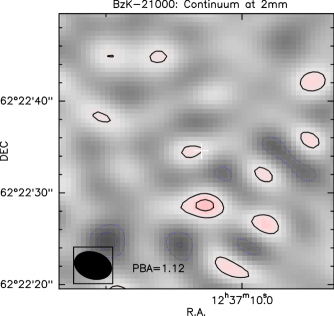
The CO[3-2] transition in -21000 is securely detected in the IRAM PdBI data at the level (Fig.1). In order to properly compare the fluxes from the different CO transitions, and to derive a CO spectral line energy distribution (SLED), we need to perform flux measurements over the same velocity range in the different transitions. We use a velocity range of 525 km s-1 centered on the CO[2-1] line (the transition detected with the highest S/N ratio, Fig. 2). We also corrected line fluxes for possible underlying continuum emission. Direct measurements in the PdBI maps return no significant evidence for continuum emission (Fig. 1 and 2) with formal measurements of Jy and Jy. Given the estimate of in these galaxies (D08) we would expect continuum emission at the level of Jy and Jy based on the SED models of Chary & Elbaz (2001) that have been shown to accurately reproduce the properties of BzK galaxies (e.g., Daddi et al. 2005; 2007). These predictions are consistent with our measurements. Given the non-detections of the continuum in our observations, we used the model estimates as our best guesses and subtracted those values to obtain continuum-free line measurements. These continuum corrections are small, 7% and 2.5% for the 2mm and 3mm band, respectively. We did not correct the VLA measurements for continuum emission, which is expected to be entirely negligible at 45 GHz (Jy).
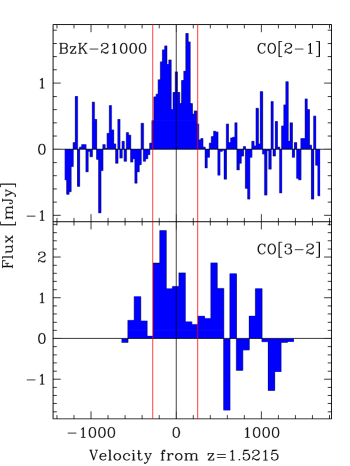
Applying all the corrections and adding all sources of uncertainty in quadrature, our CO measurements for are Jy km s-1 and Jy km s-1. This new CO[2-1] measurement is slightly lower than that reported in D08 but it has a higher S/N ratio. The CO[2-1] spectrum now clearly shows a double peak profile, similar to in D08, suggestive of rotation.
In the following we express the line ratios in terms of brightness temperature ratios (or equivalently, luminosity ratios) of the different transitions, as can be derived from equation 3 of Solomon & van den Bout 2005): . In the case of thermalized transitions the temperature ratio is 1 by definition, the CO luminosity is the same in the different transitions and the CO fluxes in Jy km s-1 scale proportionally to .
For we derive a solid measurement of . The measurement clearly shows that the CO[3-2] transition is sub-thermalized with respect to CO[2-1], a result significant at the level. From Fig. 2 it seems that CO[3-2] might be particularly weak in the reddest half of the spectrum, a possible sign of differential excitation. Measuring for the red and blue half separately we do find a suggestion for different excitation ( and 0.64, respectively), but the difference is significant only at the 1.7 level.
3.2. CO[1-0] constraints
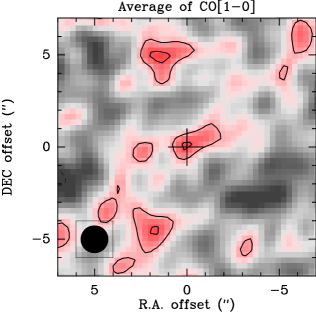
Inspection of the VLA observations of the two BzK galaxies shows peak signal close to the positions of both galaxies. Individual fluxes cannot be reliably derived from the data. In order to increase the S/N in the measurements we corrected each VLA map for de-coherence and PBA, aligned the maps at the VLA 1.4 GHz continuum coordinates of the two galaxies and averaged the data from the two objects. Fig. 3 shows that some positive CO[1-0] signal is detected at the expected position, significant at about 3.1 and corresponding to a peak flux density of mJy. Given the insufficient S/N of the data, it is impossible to know if the CO[1-0] emission is slightly extended. In order to compare this CO[1-0] measurement with the CO[2-1] results we have used the B-configuration CO[2-1] observation with IRAM PdBI, which have comparable angular resolution to the VLA CO[1-0] data, and extracted the signal over velocity ranges matching the VLA observations on each galaxy (covering very well both lines). This results on an average peak CO[2-1] signal in the combined CO[2-1] map of mJy. We derive , averaged over the two BzK galaxies. Taken at face value, this implies that we are seeing excess peak emission in CO[1-0] relative to what is expected from CO[2-1] although the evidence for an excess is very mild given the low S/N in the CO[1-0] data. Higher S/N observations would be needed to establish if the CO[2-1] transition is sub-thermally excited with respect to CO[1-0].
4. Discussion
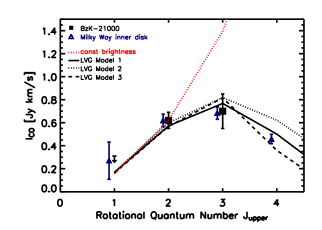
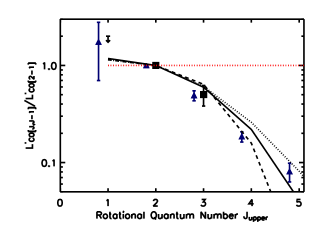
For , the CO[3-2] and [2-1] fluxes are comparable within the errors. The CO spectral line energy distribution of is consistent with the Milky-Way disk measurements by Fixsen et al. (1999) (Fig. 4), and similar to what is observed in local spirals (e.g., Braine & Combes, 1992; Young et al., 1995; Mauersberger et al., 1999; Crosthwaite & Turner, 2007). The CO SLED of is in stark contrast to what has been generally seen so far in high-redshift sources like QSOs and SMGs, for which gas has been found to be thermalized up to at least the transition (Weiß et al., 2005b, 2007a; Weiß et al., 2007b; Riechers et al., 2006). A possible exception is the extremely red galaxy HR 10 at according to the results of Andreani et al. (2000) and Papadopoulos & Ivison (2002) who find comparable fluxes of CO[5-4] and CO[2-1]. However we note that the excitation in our sources is still lower than that in HR10.
We now discuss the implication of our excitation measurements on the physical properties of the gas, including the kinetic temperature () and density () of the H2 gas in the molecular clouds, by using Large Velocity Gradient (LVG) modeling (Goldreich & Kwan, 1974; Scoville & Solomon, 1974). We use the collision rates from Flower (2001) with a fixed CO abundance to velocity gradient ratio of [CO]/(dv/dr) (Weiß et al., 2005a), an H2 ortho:para ratio of 3:1 and the cosmic background temperature at of 6.89 K 111Even for the lowest CO[1-0] transition the cosmic background radiation at will have only a minor effect on the depopulation of the state of our two sources. The reason is that the intrinsic temperature in the molecular clouds is expected to be higher, e.g. the intrinsic temperature within the Milky-Way clouds is at least greater than 10 K and most likely lies around K.. Due to the limited amount of information available, we will not be able to resolve the ambiguity between all the free parameters. E.g., choosing a different value of [CO]/(dv/dr) would also affect the SLED, and would require re-adjusting and/or to reproduce observed ratios (see, e.g., Weiß et al., 2005a, for a more detailed discussion of the parameter space degeneracies). We present here three representative models, spanning the range of parameter degeneracies in and (see Fig. 4), that reproduce the observed CO SED of . Model 1 has a kinetic gas temperature K and molecular cloud density of cm-3, very similar to the molecular gas excitation conditions of the Milky-Way. The filling factor of clouds, assuming a disk radius kpc from our ACS observations (D08), is 2% for this model. Model 2 can still fit the data assuming K and cm-3 with a similar filling factor to model 1. Model 3 results in a higher filling factor of 8% with a low K but a higher cm-3. Typical gas/dust temperatures in nearby spirals/starbursts are 10–30 K (e.g., Braine & Combes, 1992; Mauersberger et al., 1999), sometimes up to 40-50 K in the central regions of nuclear starbursts (Downes & Solomon, 1998). Normal galactic giant molecular clouds have typical average densities of cm-3 (Scoville et al., 1974; Evans, 1999). These values are broadly similar to what is allowed from LVG modeling of our observations. Clearly, we can rule out solutions where the gas is at high density and/or temperature, similar to what is generally found inside local ULIRGs, distant SMGs and QSOs.
Despite the degeneracies in the inferred physical parameters, the LVG models presented above consistently predict , higher than our average estimate for the BzK galaxies but consistent within the uncertainties. Robustly confirming an excess CO[1-0] emission over what is predicted by the LVG models shown in Fig. 4 would imply the discovery of very cold molecular gas unseen even in the CO[2-1] transition. For the moment, given our limited S/N at the measured , we assume that and are the typical values for our sources. This implies that the CO luminosities derived for our galaxies in D08 from CO[2-1] do not need substantial revisions, exception made for the small 16% increase required when converting CO[2-1] to CO[1-0], as suggested by our LVG modeling. However, our results strongly indicate that when using transitions higher than CO[2-1] only a fraction of the CO[1-0] luminosity is recovered (Fig. 4, right), implying that such measurements are not reliable for accurately estimating the total gas mass and star formation efficiencies in BzK-like galaxies. This evidence could explain the discrepancy between the observations of Hatsukade et al. (2009) and Tacconi et al. (2008) who failed to detect CO[3-2] in 4 optically and UV selected galaxies at , while so far we have a high detection rate in CO[2-1] at redshift . A large correction factor of 2.4 is required, in fact, at CO[3-2] in order to recover the total molecular gas mass, based on our results from .
Given that these two high redshift galaxies have star-formation efficiencies and CO excitation properties similar to those in local spirals and in the Milky Way, it is plausible that they may also have a Milky-Way-like molecular conversion factor as well. This would imply molecular gas reservoirs of and gas mass fractions . To summarize, our sources provide clear examples of the long-sought after population of low-excitation CO emitters at high-z. Observations of a larger sample of near-IR selected galaxies are required in order to confirm our results in a statistical way. In particular, high S/N observations of CO[1-0] and high-J CO are required to search for additional components of colder and warmer gas, respectively. Much higher S/N data will also be required to search for excitation variations inside the disks, as tentatively suggested by our data and as could be expected in the case of very clumpy gas distribution (e.g., Bournaud et al. 2008).
Given that these are the first excitation measurements inside normal, near-IR selected disk-like galaxies in the distant universe, it is plausible to speculate that such low-excitation properties might be typical in distant galaxies. ALMA will be a powerful device to study CO[2-1] in galaxies, but at much higher redshift, the higher order transitions may not be excited in the average galaxy (see also Papadopoulos & Ivison, 2002). In those cases, centimeter telescopes, such as the EVLA or the Square Kilometer Array (SKA), will become the primary tools for study of molecular gas in the earliest, normal galaxies. In distant galaxies with massive amounts of cold, diffuse, low-excitation gas we will be able to detect carbon lines with ALMA (e.g. [CII]158 m redshifted to m in galaxies). This synergistic combination of observations will offer a powerful tool for interpreting the gaseous content of ordinary galaxies at high redshift.
References
- Andreani et al. (2000) Andreani, P., Cimatti, A., Loinard, L., Röttgering, H. 2000, A&A, 354, L1
- Bournaud et al. (2008) Bournaud, F., et al. 2008, A&A, 486, 741
- Braine & Combes (1992) Braine, J., & Combes, F. 1992, A&A, 264, 433
- Chary & Elbaz (2001) Chary, R., & Elbaz, D. 2001, ApJ, 556, 562
- Crosthwaite & Turner (2007) Crosthwaite, L. P., & Turner, J. L. 2007, AJ, 134, 1827
- Daddi et al. (2005) Daddi, E., et al. 2005, ApJ, 631, L13
- Daddi et al. (2007) Daddi, E., et al. 2007, ApJ, 670, 156
- Daddi et al. (2008) Daddi, E., Dannerbauer, H., Elbaz, D., Dickinson, M., Morrison, G., Stern, D., & Ravindranath, S. 2008, ApJ, 673, L21
- Daddi et al. (2009) Daddi, E., et al. 2009, ApJ, 694, 1517
- Downes & Solomon (1998) Downes, D., & Solomon, P. M. 1998, ApJ, 507, 615
- Evans (1999) Evans, N. J., II 1999, ARA&A, 37, 311
- Fixsen et al. (1999) Fixsen, D. J., Bennett, C. L., & Mather, J. C. 1999, ApJ, 526, 207
- Flower (2001) Flower, D. R. 2001, Journal of Physics B Atomic Molecular Physics, 34, 2731
- Goldreich & Kwan (1974) Goldreich, P., & Kwan, J. 1974, ApJ, 189, 441
- Greve et al. (2005) Greve, T. R., et al. 2005, MNRAS, 359, 1165
- Hatsukade et al. (2009) Hatsukade, B., et al. 2009, PASJ, in press (astro-ph/0901.3388)
- Mauersberger et al. (1999) Mauersberger, R., Henkel, C., Walsh, W., & Schulz, A. 1999, A&A, 341, 256
- Papadopoulos & Seaquist (1998) Papadopoulos, P. P., & Seaquist, E. R. 1998, ApJ, 492, 521
- Papadopoulos & Ivison (2002) Papadopoulos, P. P., & Ivison, R. J. 2002, ApJ, 564, L9
- Riechers et al. (2006) Riechers, D. A., et al. 2006, ApJ, 650, 604
- Scoville et al. (1974) Scoville, N. Z., Solomon, P. M., & Jefferts, K. B. 1974, ApJ, 187, L63
- Scoville & Solomon (1974) Scoville, N. Z., & Solomon, P. M. 1974, ApJ, 187, L67
- Solomon & Vanden Bout (2005) Solomon, P. M., & Vanden Bout, P. A. 2005, ARA&A, 43, 677
- Tacconi et al. (2006) Tacconi, L. J., et al. 2006, ApJ, 640, 228
- Tacconi et al. (2008) Tacconi, L. J., et al. 2008, ApJ, 680, 246
- Weiß et al. (2005a) Weiß, A., Walter, F., & Scoville, N. Z. 2005a, A&A, 438, 533
- Weiß et al. (2005b) Weiß, A., Downes, D., Walter, F., & Henkel, C. 2005b, A&A, 440, L45
- Weiß et al. (2007a) Weiß, A., Downes, D., Neri, R., Walter, F., Henkel, C., Wilner, D. J., Wagg, J., & Wiklind, T. 2007a, A&A, 467, 955
- Weiß et al. (2007b) Weiß, A., Downes, D., Walter, F., & Henkel, C. 2007b, From Z-Machines to ALMA: (Sub)Millimeter Spectroscopy of Galaxies, 375, 25
- Young et al. (1995) Young, J. S., et al. 1995, ApJS, 98, 219