The Horsehead nebula, a template source for interstellar physics and chemistry
Abstract
We present a summary of our previous investigations of the physical and chemical structure of the Horsehead nebula, and discuss how these studies led to advances on the understanding of the impact of FUV radiation on the structure of dense interstellar clouds. Specific molecular tracers can be used to isolate different environments, that are more sensitive to changes in the FUV radiation or density than the classical tracers of molecular gas : the CO isotopologues or the dust (sub)millimeter continuum emission. They include the HCO or CCH radicals for the FUV illuminated interfaces, or the molecular ions H13CO+, DCO+ and other deuterated species (DNC, DCN) for the cold dense core. We discuss future prospects in the context of Herschel and ALMA.
1LERMA-LRA, CNRS UMR8112, Observatoire de Paris and Ecole Normale Supérieure, 24 Rue Lhomond, 75231 Paris cedex 05, France. email : maryvonne.gerin@ens.fr
2IRAM, 300 rue de la piscine, 38046 Grenoble, France. email:pety@iram.fr
3Laboratorio de Astrofísica Molecular. Centro de Astrobiología. CSIC-INTA. Carretera de Ajalvir, Km 4. Torrejón de Ardoz, 28850, Madrid, Spain. e-mail: goicoechea@damir.iem.csic.es
1. Introduction
In this symposium, we have learned how the progresses in detector technologies, with the development of Schottky mixers, InSb hot electron bolometers and finally SIS mixers led to spectacular discoveries on the chemical diversity and physical properties of the interstellar medium. The role of the interstellar medium in the life cycle of baryonic matter has been gradually uncovered in the last century. Following the discovery of the metallic lines in the spectra of reddened stars, the first molecules were recognized in the late 1930’s. As these spectral features were extremely narrow, with velocity dispersions of a few kms-1 at most, the perspectives of radioastronomy and heterodyne spectroscopy for studying the interstellar medium, and especially its coldest and densest regions was quickly recognized. Molecular lines offer a wealth of diagnostics of the physical conditions, the chemical composition and the gas dynamics from the regions where they are formed. Molecular clouds themselves play a special role in the life cycle of interstellar matter, as the birth places of the new generation of stars but also as the main sites for interaction of stars with their environment. Stars affect their environment through their radiative (through their X and UV radiation), mechanical (winds, shocks) and chemical (nucleosynthesis) feedback. The understanding of the properties of molecular clouds, their structure and their relation to the formation of stars has triggered the development of millimeter and submillimeter astronomy. Measuring the cooling radiation from molecular clouds is a key issue that determines our ability to detect the interstellar matter and understand how it can collapse and form stars. T. Phillips and his co-workers have brought a decisive contribution to this field, by making pioneering detections of the submillimeter lines of CO, atomic carbon and hydrides. His prediction of the spectrum of a typical interstellar cloud Phillips (1987) has been vastly cited and reproduced to illustrate the scientific discovery potential of submillimeter astronomy.
The neutral interstellar gas cools through line emission, the most intense lines being the fine structure lines of ionized carbon, atomic oxygen and carbon, together with the rotational lines of CO and water. Molecular hydrogen (H2) itself can be an important coolant, especially in dense photon-dissociation regions (PDRs) and shocks. Averaged over the whole interstellar medium of a galaxy, this line cooling radiation from PDRs makes a significant contribution to the total line emission at large scales (Phillips & Huggins 1981; Phillips 1987; Wolfire et al. 2008; Cubik et al. 2008). Keene et al. (1985) have pioneered this field by mapping the atomic carbon line across the edge of two well known PDRs, S 140 and M 17. They showed that the atomic carbon line emission is very extended, and does not show the expected spatial pattern for a uniform density, plane parallel cloud. They discussed how the knowledge of the source geometry and spatial structure are particularly important for understanding their line emission.
2. Physical structure of the Horsehead nebula
2.1. Summary of physical properties
The Horsehead nebula is one of the most well known example of a molecular cloud. It appears as a dark patch against the bright emission from the HII region IC 434 at visible wavelengths, and as a bright line and continuum emission source at IR and (sub)millimeter wavelengths. Following the mapping of the CO(3–2) line emission with the CSO111see the CSO www page at www.submm.caltech.edu/, we have started investigating the physical and chemical structure of the Horsehead nebula. The source was chosen as it is a good template of photon dissociation region (PDR), where molecular gas is heated and photodissociated by Far UV (FUV; eV eV) radiation from nearby massive stars. The Horsehead nebula is particularly interesting as its geometry is simple. The illuminated edge is viewed very close to edge-on and the illuminating star ( Ori) lies at the same distance. The properties of the Horsehead nebula are summarized in Table 1.
| Name | Barnard 33 (Horsehead nebula) |
|---|---|
| RA, DEC (2000) | 05h40m54.27s, |
| Distance from Earth | pc (1” = 0.002 pc) |
| Illuminating Star | Ori (O9.5V) at 0.5∘ (3.5 pc), PA 76∘ |
| FUV Radiation field | 60 (Draine unit) |
| Depth along the line of sight | pc |
| Inclination of the line of sight | |
| Density profile | Steep gradient |
| from cm-3 to 103 cm-3 in 10” | |
| and lower density halo cm-3 | |
| Kinetic temperature | from TK K in the cold core |
| up to TK K at the edge | |
| Thermal pressure | Kcm-3 |
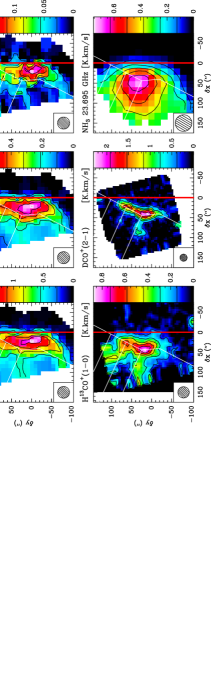
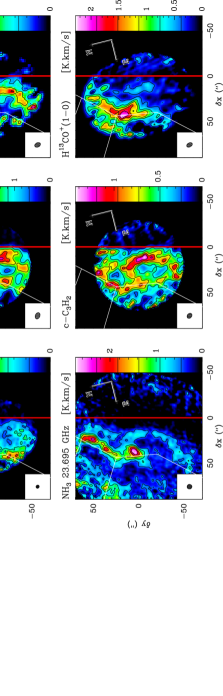
Figures 1 and 2 present the line integrated intensities of the interstellar molecules we have observed so far (Teyssier et al. (2004); Pety et al. (2005, 2007); Goicoechea et al. (2006, 2009); Gerin et al. (2009)), together with the excited vibrational line of H2 at 2.1m from Habart et al. (2005), and the ISOCAM 7.7m map from Abergel et al. (2003).
2.2. Electron abundance
The electron abundance ([e-] = ) plays a fundamental role in the chemistry and dynamics of interstellar gas. It can not be directly measured in FUV shielded gas but can be derived from abundances and abundance ratios of key molecular species, which are sensitive to the presence of electrons. Stable molecular ions such as DCO+ and HCO+ have been traditionally used to estimate the electron abundance in cold cores because (i) they are abundant and easily observable (ii) dissociative recombination is their main destruction route, and thus their abundances are roughly inversely proportional to the electron abundance (e.g. Guélin et al. (1982); Wootten et al. (1982); Maret & Bergin (2007); Hezareh et al. (2008)). On the other hand, the presence of reactive ions (species such as HOC+ or CO+ that react rapidly with H2) indicates high electron abundance regions, e.g., the UV irradiated cloud surfaces (e.g., Smith et al. (2002); Fuente et al. (2003)). The electron abundance is predicted to steeply decrease in a PDR from at the cloud edge where the FUV radiation field is intense, down to in the cold and well shielded gas. The magnitude and shape of this gradient is sensitive to the elemental abundances, especially sulfur, to the cosmic ray ionization rate, and to the efficiency of recombination reactions and electron attachment processes with PAHs and grains (Flower et al. 2007; Wakelam & Herbst 2008; Goicoechea et al. 2009).
By combining pointed observations and maps of H13CO+, DCO+, HOC+ and CO+, Goicoechea et al. (2009) have investigated the electron abundance gradient across the edge of the Horsehead nebula. They showed that a consistent fit of both the PDR edge and the adjacent cold core can be obtained with a cosmic ray ionization rate of s-1, assuming a low metal abundance of . The electron abundance in the Horsehead edge follows a steep gradient, with a scale length of 0.05 pc (or 25′′), from [e-]10-4 times 10-9 in the core. Low metal abundances are required in the core, namely (with respect to H nuclei), to enable a significant deuterium fractionation of HCO+. This implies a very significant depletion of metals onto dust grains as the solar abundance of metals is ; (Anders & Grevesse 1989). The inclusion of PAHs in the chemical model modifies the electron abundance gradient and decreases the metal depletion required in pure gas-phase models as a good agreement is obtained with metal abundance for a standard PAH abundance of 10-7. Indeed, PAH- anions acquire large abundances, being more efficient in neutralizing atomic ions than electrons. PAHs have a significant impact on the negative charge budget of cold gas if their abundance is significant ([PAH]10-8).
3. Chemical gradients
3.1. Determination of chemical abundances
Molecular line emission does not directly probe the abundances of a given species, even when several lines of the same species are detected. A minimum treatment of the molecular excitation and line radiative transfer is often needed to distinguish “excitation gradients” from true “chemical variations”. Our strategy is always to observe several rotational lines of the same species (sometimes with line maps, sometimes using high signal to noise ratio spectra at representative positions). In addition, we also try to observe molecular isotopologues, if possible, when the main line opacities can complicate the interpretation and lead to large errors on the derived abundance. Molecular excitation in PDRs is always far from LTE and different collisional and radiative effects compete at rates that depend on the physical conditions and on the molecule under study. In the last years, we have always tried to consistently link the observed line intensities with the abundances predicted by our chemical models by detailed non-LTE excitation and radiative transfer modeling adapted to the Horsehead geometry (see Appendix in Goicoechea et al. (2006)).
3.2. Observed chemical abundances
It is obvious, when comparing the maps of various molecules shown in Fig. 1 and 2 that the molecular abundances are not uniform across the Horsehead nebula. Molecular species like HCO and CCH closely delineate the western illuminated edge of the nebula. On the contrary, H13CO+ and the deuterated species DCO+ and DNC are mostly located in the dense cold core. Finally the dust continuum emission, as well as C18O trace the bulk of the core, but do not show a sharp peak associated with the dense core. These maps have been discussed in detailed, and molecular abundances in our previous papers.
| Species | HPBW | Column density | Abundance | Reference | Offsets |
|---|---|---|---|---|---|
| [arcsec] | [cm-2] | [arcsec] | |||
| H2 | 12 | 0.5 | 3,4,5,6 | (-5,0) | |
| C18O | 2 | (-6,-4) | |||
| CCH | 2 | (-6,-4) | |||
| c-C3H2 | 2 | (-6,-4) | |||
| c-C3H2 | 29 | 1 | (-10,0) | ||
| l-C3H2 | 27 | 1,7 | (-10,0) | ||
| c-C3H | 28 | 1 | (-10,0) | ||
| l-C3H | 28 | 1 | (-10,0 | ||
| C4H | 2 | (-6,-4) | |||
| C6H | 28 | 8 | (-6,4) | ||
| CS | 10 | 3 | (+4,0) | ||
| C34S | 16 | 3 | (+4,0) | ||
| HCS+ | 29 | 3 | (+4,0) | ||
| H13CO+ | 14 | 5, 6 | (-5,0) | ||
| HOC+ | 27.5 | 6 | (-5,0) | ||
| CO+ | 10.4 | 6 | (-5,0) | ||
| HCO | 14 | 5 | (-5,0) |
| Species | HPBW | Column density | Abundance | Reference | Offsets |
|---|---|---|---|---|---|
| [arcsec] | [cm-2] | [arcsec] | |||
| H2 | 12 | 0.5 | 6 | (+20,+22) | |
| CS | 10 | 3 | (+21,+15) | ||
| C34S | 16 | 3 | (+21,+15) | ||
| HCS+ | 29 | 3 | (+21,+15) | ||
| H13CO+ | 4,6 | (+20,+22) | |||
| DCO+ | 12 | 4,6 | (+20,+22) | ||
| HCO | 14 | 5 | (+20,+22) |
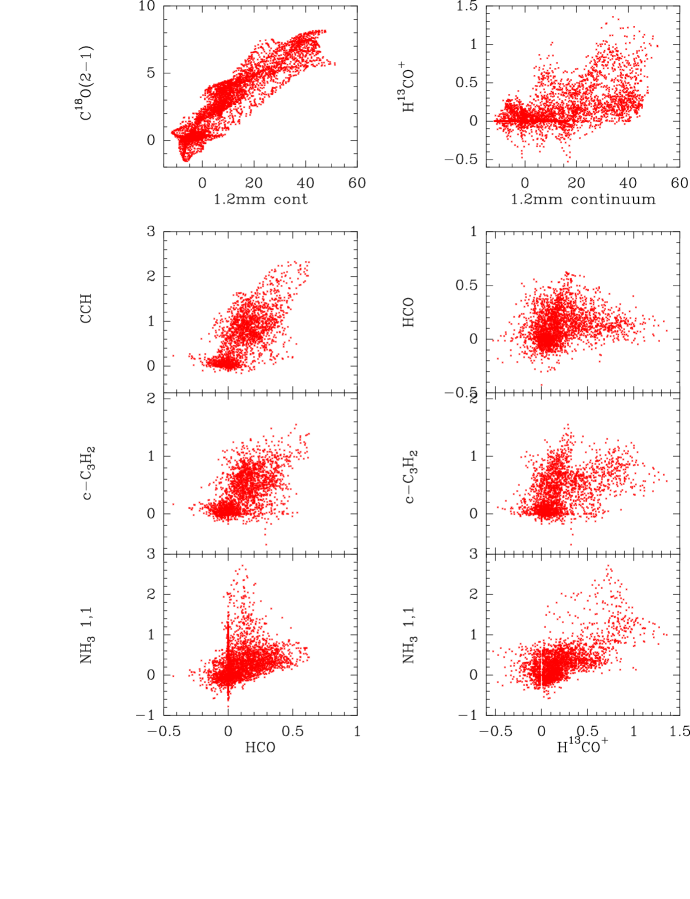
In order to demonstrate quantitatively how these various species are spatially related, we show in Figure 3 a selection of scatter diagrams. The 1.2mm dust continuum and C18O emissions are well correlated, while the correlation is less strong for H13CO+. The correlation between HCO and CCH is good as well, as both species trace the UV illuminated matter in the PDR. C4H and CCH are equally well correlated, as shown by Teyssier et al. (2004); Pety et al. (2005). The recent confirmation of the detection of C6H in the Horsehead edge by Agundez et al. (2008) confirms the high abundance of unsaturated hydrocarbons and radicals in this source. By contrast, the H13CO+ (1-0) emission is tracing the dense cold core. It is loosely correlated with the dust continuum emission. The correlation of H13CO+ with NH3 is quite good.
The situation can be more complicated for other molecules. For instance, the c-C3H2 maps shows two emission regions, the PDR and the cold dense core. The presence of abundant c-C3H2 in the PDR is confirmed by the good correlation with HCO. The additional emission source shows up in the same plot as an upper envelope of points with strong c-C3H2 and relatively low HCO emission. This is confirmed in the c-C3H2 vs H13CO+ scatter plot, that shows two clouds of points with two different slopes. Although most of the NH3(1,1) emission is produced in the dense and shielded region, some faint emission is detected in the PDR. This behavior shows up in the NH3 vs HCO and NH3 vs H13CO+ scatter plots as clouds of points deviating from the general trends. The ammonia data will be further discussed and analyzed in a forthcoming paper (Pety et al. 2009, in prep.).
3.3. Chemical models of the Horsehead nebula
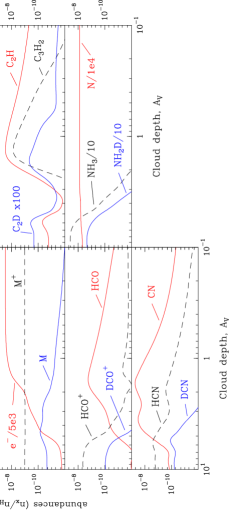
Photo-dissociation models have been used to compute the physical and chemical structure of geometrically simple interstellar clouds, exposed to FUV radiations. Because of its well known geometry and FUV radiation field, the Horsehead nebula is a good template source for comparing model predictions with actual data. These comparisons have been extremely interesting in identifying the strong points of the present generation of models, and their remaining weaknesses, and in triggering new improvements. Figure 4 shows PDR model predictions adapted to the Horsehead nebula, made with the Meudon PDR model (Le Petit et al. 2006; Goicoechea & Le Bourlot 2007; Gonzalez Garcia et al. 2008). Predictions are shown for the CO/C/C+ transition (Habart et al. 2005), the sulfur chemistry (Goicoechea et al. 2006), the electron abundance (Goicoechea et al. 2009), the deuterium fractionation (Pety et al. 2007), the HCO and CCH radicals (Pety et al. 2005; Gerin et al. 2009) as well as for the main tracers of the nitrogen chemistry, CN, HCN, HNC and NH3. While the physical structure, and the transition from a FUV dominated chemistry in the PDR, to a cosmic ray dominated chemistry in the dense core, is well reproduced by the models, significant discrepancies remain. The HCO, CCH and C4H radicals are much more abundant in the PDR than steady state model predictions. Pety et al. (2005) and Gerin et al. (2009) have suggested directions for improvements. They include i) the need to include more neutral-neutral reactions in the chemical networks, that may have a significant impact on the chemistry (e.g. the O + CH2 reaction in the HCO case), and ii) the need for considering the coupling of gas phase and solid phase chemistry as the photodesorption of molecular ices and/or the erosion of carbon grains may release significant amounts of radicals in the gas phase, that can modify current model predictions.
4. Future prospects with Herschel, NOEMA, and ALMA
Because of the steep gradients in the physical parameters and chemical abundances in PDRs such as the Horsehead nebula, an accurate comparison of observations with models cannot be performed without information on the spatial variation of the molecular line intensities. Due to the small spatial scales involved, a combination of (sub)millimeter interferometer maps with short spacings from single dishes appears to be the best method for obtaining this spatial information at the required physical resolution. However, many interesting species show relatively weak lines, which are bearly detectable with the IRAM PdBI in a strong and nearby source like the Horsehead nebula (for instance the C4H lines). To access a more complete sample of molecular tracers, a more sensitive instrument is needed. With its larger number of antennas (12 vs 6), and wide instantaneous bandwidth (16GHz), the NOEMA project (NOrthern Extended Millimeter Array) for the IRAM Plateau de Bure Interferometer, will be able to produce high quality images of a much larger sample of molecules and sources, enabling the possibility to study the FUV chemistry in a wide diversity of physical conditions. These data will complement the information on the dust spectral energy distribution and gas thermal balance, which will be provided at unprecedented sensitivity and spatial distribution by ALMA. This will allow to probe for the first time the steep gradients in temperature and densities at PDR edges, as well as the gradients in elemental abundances induced by freeze-out on grains.
Furthermore, hydrides play a key role in most chemical networks, as they are at the root of the formation pathways of most interstellar molecules (see the discussion by Lis et al. in this proceeding), but are however not accessible from the ground due to the large opacity of the Earth atmosphere at THz frequencies. With the full opening of the far infrared and submillimeter wavelength domain by the Herschel satellite, the spatial distribution of important hydrides such as water vapor H2O, OH, CH, CH+, NH, HF and many others including the isotopologues will be investigated. Although lacking spatial resolution, and sensitivity, the pioneering detections of water by the ISO, SWAS and ODIN satellite have demonstrated the added value of detecting hydrides for improving the PDR models (Cernicharo et al. 2006; Bergin et al. 2003; Persson et al. 2009; Gonzalez Garcia et al. 2008). The launch of the Herschel Space Observatory in May 2009 has concretized many decades of efforts for proposing a spatial submillimeter and far infrared telescope with direct detection detectors and heterodyne receivers. T. Phillips has been among the strongest advocates for such a space mission. The Herschel community warmly thanks him for this major achievement.
Acknowledgments.
M.G. and J.P. are indebted to T. Phillips for welcoming them in his group at CalTech. We enjoyed working in the CSO group, the stimulating atmosphere and Tom’s insightful and enthusiastic comments on new ideas. The CSO is a wonderful telescope, where we learned many subtleties of performing heterodyne observations, from the behavior of local oscillators and mixers, to the pointing of the antenna …
References
- Abergel et al. (2003) Abergel, A., Teyssier, D., Bernard, J. P et al. 2003, A&A, 410, 577.
- Agundez et al. (2008) Agùndez M., Cernicharo J., Guélin M., et al., 2008, A&A 478, L19.
- Anders & Grevesse (1989) Anders, E., & Grevesse, N. 1989, Geochimica et Cosmochimica Acta, 53, 197-214.
- Bergin et al. (2003) Bergin, E. A.; Kaufman, M. J.; Melnick, G. J.; Snell, R. L.; Howe, J. E., 2003, ApJ 582, 830.
- Cernicharo et al. (2006) Cernicharo, J.; Goicoechea, J. R.; Pardo, J. R.; Asensio-Ramos, A.; 2006, ApJ 642, 940.
- Cubik et al. (2008) Cubick, M., Stutzki, J., Ossenkopf, V., Kramer, C., Röllig, M., 2008, A&A 488, 623.
- Flower et al. (2007) Flower, D.R., Pineau des Forêts, G. & Walmsley, C. M. 2007, A&A, 474, 923.
- Fuente et al. (2003) Fuente, A., Rodríguez-Franco, A., García-Burillo, S., Martín-Pintado, J., & Black, J. H. 2003, A&A, 406, 899.
- Fuente et al. (2008) Fuente, A., García-Burillo, S., Usero, A. et al. 2008, A&A, 492, 675.
- Gerin et al. (2009) Gerin, M., Goicoechea, J.R., Pety, J. & Hily-Blant, P. 2009, A&A 494, 977.
- Goicoechea et al. (2006) Goicoechea, J. R., Pety, J., Gerin, M., Teyssier, D., Roueff, E., Hily-Blant, P. & Baek, S. 2006, A&A, 456, 565.
- Goicoechea & Le Bourlot (2007) Goicoechea, J. R. & Le Bourlot, J. 2007, A&A, 467, 1.
- Goicoechea et al. (2009) Goicoechea, J. R., Pety J., Gerin, M., Hily-Blant P., Le Bourlot, J., 2009, A&A 498, 771.
- Gonzalez Garcia et al. (2008) Gonzalez Garcia, M.; Le Bourlot, J.; Le Petit, F.; Roueff, E., 2008, A&A 485, 127.
- Guélin et al. (1982) Guélin, M., Langer, W. D. & Wilson, R. W. 1982, A&A, 1982, 107, 107.
- Habart et al. (2005) Habart, E., Abergel, A., Walmsley, C. M., Teyssier, D. & Pety, J. 2005, A&A, 437, 177
- Hezareh et al. (2008) Hezareh, T. Houde, M., McCoey, C., Vastel, C. & Peng, R. 2008, ApJ, 684, 1221.
- Hily-Blant et al. (2005) Hily-Blant, P., Teyssier, D., Philipp, S. & Güsten, R. 2005, A&A, 440, 909.
- Keene et al. (1985) Keene, J., Blake, G. A., Phillips, T. G.; Huggins, P. J.; Beichman, C. A., 1985, ApJ 299, 967.
- Le Petit et al. (2006) Le Petit, Franck; Nehmé, Cyrine; Le Bourlot, Jacques; Roueff, Evelyne, 2006, ApJ suppl. 164, 506.
- Lis et al. (2009) Lis, D. C., Goldsmith P.F., Bergin E.A., 2009, this proceeding.
- Maret & Bergin (2007) Maret, S. & Bergin, E.A. 2007, ApJ, 664, 956.
- Persson et al. (2009) Persson, C. M.; Olberg, M.; . Hjalmarson, Å.; Spaans, M.; Black, J. H.; Frisk, U.; Liljeström, T.; Olofsson, A. O. H.; Poelman, D. R.; Sandqvist, Aa., 2009, A&A 494, 637.
- Pety et al. (2005) Pety, J., Teyssier, D., Fossé, D., Gerin, M., Roueff, E., Abergel, A., Habart, E. & Cernicharo, J. 2005, A&A, 435, 885.
- Pety et al. (2007) Pety, J., Goicoechea, J. R., Hily-Blant, P., Gerin, M. Teyssier, D. 2007, A&A, 464, L41
- Pety et al. (2009) Pety, J., Teyssier, D. Goicoechea, J. R.., Liszt H., Gerin, 2009, A&A, in preparation.
- Phillips (1987) Phillips, T.G., 1987, Interstellar processes Dordrecht, D. Reidel Publishing Co., 1987, p. 707.
- Phillips & Huggins (1981) Phillips T.G. and Huggins, 1981, ApJ 251, 533.
- Smith et al. (2002) Smith, M. A., Schlemmer, S., von Richthofen, J. & Gerlich, D. 2002, ApJ, 578, L87.
- Teyssier et al. (2004) Teyssier, D., Fossé, D., Gerin, M., Pety, J., Abergel, A. & Roueff, E. 2004, A&A, 417, 135.
- Teyssier et al. (2005) Teyssier, D., Hily-Blant, P., Gerin, M., Cernicharo, J., Roueff, E. & Pety, J. 2005, In: Proceedings of the dusty and molecular universe: a prelude to Herschel and ALMA, Ed. by A. Wilson. ESA SP-577, Noordwijk, Netherlands: ESA Publications Division, ISBN 92-9092-855-7, 423.
- Wakelam & Herbst (2008) Wakelam, V. & Herbst, E. 2008, ApJ, 680, 371
- Wolfire et al. (2008) Wolfire, M.G., Tielens, A.G.G.M., Hollenbach, D. & Kaufman, M.J. 2008, ApJ, 680, 384.
- Wootten et al. (1982) Wootten, A., Loren, R. B. & Snell, R. L. 1982, ApJ, 255, 160