X-ray Spectroscopy of the Radiation-Driven Winds of Massive Stars: Line Profile and Line Ratio Diagnostics
Abstract
Massive stars drive powerful, supersonic winds via the radiative momentum associated with the thermal UV emission from their photospheres. Shock phenomena are ubiquitous in these winds, heating them to millions, and sometimes tens of millions, of degrees. The emission line spectra from the shock-heated plasma provide powerful diagnostics of the winds’ physical conditions, which in turn provide constraints on models of wind shock heating. Here I show how x-ray line transfer is affected by photoelectric absorption in the partially ionized component of the wind and how it can be modeled to determine the astrophysically important mass-loss rates of these stellar winds. I also discuss how photoexcitation out of metastable excited levels of helium-like ions can provide critical information about the location of the hot plasma in magnetically channeled massive star winds.
Keywords:
x-ray astronomy – massive stars – stellar winds – spectroscopy – hydrodynamics:
1 Introduction
Massive stars are rare but due to their tremendous power output, they contribute a significant fraction of the starlight in our galaxy and dominate its energetics. The intense ultraviolet radiation emitted from their surfaces drives strong, steady outflows, referred to as radiation-driven winds. These winds are a hallmark of massive stars, and are the sites of atomic and plasma processes that shape their dynamics, their physical conditions, and their emitted spectra from which we can diagnose their properties Puls et al. (2008).
Massive stars were presumed not to be x-ray emitters by virtue of their lack of significant subsurface convection and the absence of an associated magnetic dynamo. Such magnetic activity generates the x-ray emission seen in the Sun and other low-mass stars. It was not until the launch of the first x-ray telescopes in the 1970s that massive stars were realized to be ubiquitous sources of strong, soft x-ray emission Harnden et al. (1979). Because of the presumed lack of a dynamo and because no correlation is seen between x-ray properties and rotation speeds in massive stars (unlike in low-mass stars, where a positive correlation is seen) Pallavicini et al. (1981), some other mechanism was assumed to be responsible for the x-ray emission observed in these massive and luminous stars.
Today, at least three distinct mechanisms are thought to contribute to the x-ray emission of massive stars. All three are associated with these stars’ powerful radiation-driven stellar winds. And all tap the prodigious kinetic energy of these winds, via shock heating, to produce the observed x-rays. All massive stars with radiation-driven winds are subject to an instability related to the nature of the coupling of the photospheric UV radiation field to the wind ions via scattering in resonance lines. This instability is quite robust, and has been shown to grow very rapidly once the wind material is several tenths of a stellar radius above the star’s surface Owocki et al. (1988). Briefly, the instability, referred to as the Line-Driven Instability (LDI), is due to the Doppler de-shadowing of ions that are perturbed to move slightly faster (slower) than their neighbors. This exposes them to more (less) photospheric radiation, which increases (decreases) the radiation force, increasing (decreasing) their velocities and so on. Rapidly accelerated streams then plow into slower moving upstream material, generating strong reverse shocks. Numerical simulations of radiation driven winds indicate that the instability leads to shocks with strengths of several hundred km s-1, which heat a small fraction of the wind to temperatures of several million K Feldmeier et al. (1997).
While the line-driven instability should exist in all massive stars with strong winds, under certain circumstances one of two other wind-shock mechanisms can occur in some massive stars and can dominate over the instability-driven shock heating. In very close binary star systems in which both components are massive stars with strong winds, the two wind flows can interact with each other directly, leading to strong shock-heating, with shock velocities well in excess of 1000 km s-1, and shock temperatures approaching 100 million K. In the interests of using the limited space allocated to this paper, I do not discuss this wind-wind collision mechanism any further. The third wind-shock mechanism also involves the head-on collision of two fast wind flows and the associated strong shocks and high shock temperatures. But in this case, the two wind flows arise from a single star and are directed toward each other – and their head-on collision – by strong, large-scale magnetic fields that have been recently discovered on a handful of massive stars. This Magnetically Channeled Wind Shock (MCWS) scenario seems to explain the harder x-ray emission in some massive stars, especially very young stars that harbor what are likely fossil fields remaining from their formation from collapsing, magnetized interstellar clouds Babel and Montmerle (1997).
The rest of this paper describes how atomic processes in the winds of massive stars can be modeled to place constraints on the LDI and MCWS x-ray production scenarios for non-magnetic and magnetic hot stars, respectively. The next section describes the Doppler-broadened emission lines from the hot plasma generated by the LDI and shows how photoelectric absorption by the bulk, cool wind component in which the hot, x-ray emitting plasma is embedded leads to a characteristic blue-shifted and asymmetric shape for these emission lines. These characteristic profile shapes can be used as a diagnostic of the star’s wind mass-loss rate, which is the key parameter describing the winds of massive stars. The third section discusses the use of the forbidden-to-intercombination line ratios in helium-like species as a diagnostic of the location of the x-ray emitting plasma relative to the star’s surface. This is a non-traditional use of this particular line ratio diagnostic, and, as shown below, it can provide very important constraints on the MCWS mechanism, as applied to magnetic massive stars.
2 X-ray Emission Line Profile Diagnostics of Massive Star Wind Mass-Loss Rates
Because the x-ray emitting plasma in the unstable winds of massive stars is embedded in the bulk, cool wind that is being driven by the radiative momentum of the photospheric UV emission, it is expected to have the same kinematic profile as the rest of the wind. The thermal line emission from this plasma – which consists primarily of resonance lines of He-like and H-like species of abundant low-Z elements (C, N, O, Ne, Mg, Si, S) and of L-shell lines of Fe – is Doppler broadened by the bulk motion of the flow. We note that the typical wind velocities of several 1000 km s-1 far exceed the sound and thermal speeds in these winds (few 10s of km s-1 in the bulk, cold wind and 100 km s-1 for low-Z ions in the shock-heated component of the wind). Massive star winds accelerate relatively rapidly from the stellar surface to a terminal velocity of typically km s-1 in a few stellar radii, with a velocity profile given by , where is the stellar radius and the parameter typically has a value close to unity. But because the line emission in the hot plasma is driven by collisional excitation, and thus scales as the square of the wind density, the denser – and slower moving – base of the wind dominates the line profile. This leads to intrinsic emission line profiles that have half-widths of about 1000 km s-1.
It was only in the last ten years, since the launch of high-resolution x-ray spectrographs aboard the Chandra and XMM-Newton satellite telescopes, that resolved x-ray line profiles have been measured in massive stars. The observed x-ray line profiles have the expected widths of roughly half the wind terminal velocities (which are known quite accurately from measurements of ultraviolet absorption line profiles that arise in the cold portion of these massive star winds). These x-ray profiles, in addition to being broad, have a characteristic blue-shifted and skewed shape that can be understood as the effect of photoelectric absorption of the emitted x-rays in the bulk, cool wind component. The opacity associated with the photoelectric absorption is relatively constant across a given line profile, although it does vary significantly over the spectral range of the Chandra grating spectrometers (effectively 5 to 25 Å). Despite the opacity’s relative constancy over each emission line, its effect on the line is far from wavelength-independent. This is because the absorption column density associated with the red wing of the line, whose photons are generated in the receding, rear hemisphere of the stellar wind, is quite large, as the photons’ paths traverse most of the wind, including the dense, inner regions of the wind. On the other hand, the photons on the blue wing of the emission line are subject to much less absorption, by a much smaller wind column density, as they traverse only part of the front hemisphere of the wind. Thus, the red portion of each emission line is much weaker (more attenuated) than the blue portion, leading to the characteristic blue-shifted and skewed profile shapes seen in the high-resolution Chandra and XMM-Newton spectra of massive stars.
Owocki & Cohen Owocki and Cohen (2001) have developed a simple model of such skewed and blue-shifted x-ray line profiles, assuming a -velocity law, as defined above, for the kinematics of both the cold and hot portions of the wind, which are assumed to be smoothly mixed together with a constant filling factor of hot gas above some onset radius, , below which there is assumed to be no shock heating of the wind. Aside from the overall normalization, the parameters that govern the profile shapes in this model are and , which is a fiducial optical depth (and which appears as a constant in the detailed expression for the optical depth of the wind from an observer to any arbitrary point in the stellar wind; here, is the atomic opacity of the unshocked wind expressed as a cross-section per unit mass, is the wind mass-loss rate, is the radius of the star, and is the wind terminal velocity). By fitting the line profile model to individual emission lines in the x-ray spectra of massive stars, we can derive values of and for each line. The former values confirm the predictions of the LDI scenario of a shock-onset radius about half a stellar radius above the star’s surface, while the latter values enable us to determine the mass-loss rate of a given star’s wind, if we are able to make reasonable assumptions about the other parameters, most importantly the atomic opacity of the wind, .
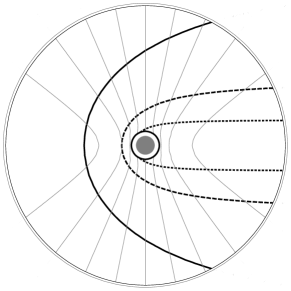

In Fig. 1 is a schematic model of the Doppler-shifted emission and the geometry-dependent attenuation that leads to the characteristic broad, shifted, and asymmetric x-ray emission line profiles seen in the high-resolution x-ray spectra of massive stars. Also shown in this figure is a detailed model of the opacity of the bulk, unshocked portion of the wind. The superposition of photoelectric absorption cross sections from multiple, abundant elements gives the wind opacity a characteristic form that includes K- and L-shell edges and a generally decreasing (but not monotonically decreasing) cross section with decreasing wavelength. Because the atomic opacity of the wind is a function of wavelength, the optical depth to which each emission line is subject should also be a function of wavelength. This is, indeed, the case. In Fig. 2 are shown three representative emission lines from the Chandra spectrum of the massive star Puppis. I fit the line profile model to each emission line, deriving values of and for each line. The best-fit profile models for each line are shown along with the best-fit parameter values and their confidence limits, listed in the caption of the figure. As can be seen qualitatively in the figure, the longer the wavelength of the emission line, the more shifted and asymmetric the line is. This is borne out from the quantitative fitting, where higher values of are seen in the longer wavelength lines.
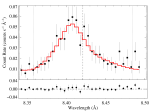
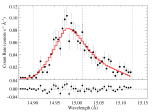
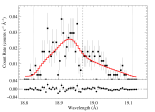
The results shown for the three emission lines in Fig. 2 are representative of what is found from fits to 16 lines in the Chandra grating spectrum of Puppis – the trend of derived values with wavelength is consistent with the wavelength dependence of the opacity. So, with estimates of the wind opacity, , as well as values of the star’s radius and the wind terminal velocity, an estimate of the wind mass-loss rate of Puppis can be made by fitting the ensemble of 16 values.
The results of this mass-loss rate fitting are shown in Fig. 3, where the 16 values derived from the emission lines in the Chandra spectrum of Puppis are shown along with the model of that best fits these derived values. The best-fit value of the mass-loss rate is M⊙ yr-1. This estimate of the mass-loss rate of Puppis is nearly three times lower than the traditional estimate of M⊙ yr-1, which was derived from modeling the optical hydrogen Balmer- emission line strength of the star Repolust et al. (2004). The traditional method of using hydrogen Balmer- emission as a mass-loss rate diagnostic is problematic, however, because the strength of that emission line scales as the square of the density of the wind (as the upper level is populated by two-body recombination). Thus, if density inhomogeneities are present (i.e. “clumping”), but not modeled, the mass-loss rate will be overestimated. The new method described in this paper, using x-ray line profiles and photoelectric absorption, which scales as the column density rather than the density-squared, is not susceptible to this problem. Quite recently, the Balmer- mass-loss rate has been re-evaluated, this time taking clumping into account, and a value is found that is much more consistent with the value we report here (an upper limit of M⊙ yr-1; as the modeling can only place a lower-limit on the amount of clumping, and thus puts an upper limit on the mass-loss rate) Puls et al. (2006). So, this new technique based on modeling the effect of photoelectric absorption in the winds of massive stars on the x-ray line profiles from shock-heated material embedded in these winds will provide a valuable complementary approach to determining the mass-loss rates of massive star winds.

3 X-ray Emission Line Ratio Diagnostics of the Location of Hot Plasma in Magnetically Channeled Wind Shocks
Large scale magnetic fields are being found in massive stars with increasing frequency as techniques for making sensitive Zeeman splitting measurements advance Wade et al. (2008). The canonical magnetic massive star is Orionis C; the brightest star in the Orion Nebula and the primary source of far UV radiation that ionizes and illuminates the nebula. Its magnetic field is consistent with a tilted dipole with a field strength somewhat in excess of 1 kG Donati et al. (2002). An integrated picture of this star and its magnetosphere has emerged, based on the steady-state Magnetically Channeled Wind Shock (MCWS) model of Babel & Montmerle Babel and Montmerle (1997) that explains the strength, hardness, and modulation of the x-ray emission.
The broadband x-ray properties are explained in the context of the MCWS scenario by the magnetic channeling of the wind, which causes wind streams from the two hemispheres of the star to collide in the magnetic equator at significantly higher velocities than the embedded wind shocks in the LDI model discussed in the previous section. The confinement of the shock heated wind plasma by the strong magnetic field of the star explains the high levels of x-ray emission in the MCWS scenario, as the post-shock plasma in a magnetosphere with approximately toroidal geometry maintains a relatively high density despite its large thermal pressure. The rotation of the star causes part of the magnetosphere to be periodically occulted by the star itself. The magnetohydrodynamics simulations presented in Gagné et al. (2005) explain the hardness and strength of the x-rays and make a prediction about the location of the x-ray emitting plasma, which explains the timing of the observed x-ray dimming from the occultation of the magnetosphere induced by the star’s rotation. However, although the timing is well reproduced, the magnitude of the observed x-ray dimming is somewhat more substantial than the MHD simulations predict Gagné et al. (2005).
One possible solution to this discrepancy involves having the x-ray emitting plasma closer to the star’s surface than the MHD simulations predict. To test this, we have used the helium-like forbidden-to-intercombination line ratio [, or more colloquially, ] to diagnose the distance of the shock-heated plasma from the photosphere of Orionis C. This line ratio, as manifest in abundant low-Z elements, traditionally has been used as a density diagnostic, as the collisional excitation out of the metastable upper level of the forbidden line can dominate spontaneous emission if the density is high enough Gabriel and Jordan (1969). However, in environments with strong UV radiation, photoexcitation out of the upper level of the forbidden line can be more important than collisional excitation. And if one knows or can model the emergent UV flux from the photosphere of a massive star, then the ratio can be used as a diagnostic of the distance the X-ray emitting plasma is from the photosphere.
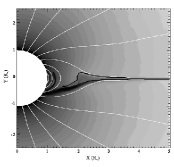
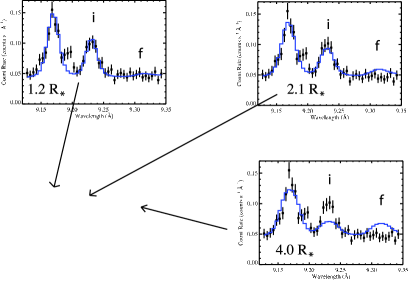
The photoexcitation mode of the diagnostic can be applied to the Chandra spectrum of Orionis C. The formalism of the line ratio modeling is from Blumenthal et al. (1972), where the photoexcitation parameter, , is determined from the photospheric surface flux given by a TLUSTY model atmosphere Lanz and Hubeny (2006) and the geometrical dilution factor, assuming optically thin radiation transport. The best constraints are provided by the Mg xi emission line complex near 9.2 Å, for which the forbidden line is nearly completely suppressed by the photoexcitation effect. As can be seen in Fig. 4, which shows a representative MHD simulation snapshot, the hot, x-ray emitting plasma in these simulations is located near . However, the line ratio modeling indicates that at that distance from the photosphere, there should be a measurable forbidden line flux in the Mg xi complex. The forbidden line does not appear to be present in the Chandra data, however. Formally, an upper limit to the forbidden line flux is found that is marginally consistent with the location of the hot plasma in the simulations. However, smaller radii are preferred. These smaller radii are also more consistent with the dimming of the x-rays at rotation phases where the magnetosphere is expected to be occulted by the star. Perhaps future refinements to the MHD modeling – including extension from 2-D to 3-D – will lead to the bulk of the hot plasma being closer to the star’s surface in the simulations.
4 Conclusions
Stellar x-ray emission is generally from optically thin thermal equilibrium coronal plasmas and, at high spectral resolution, consists of strong lines from high ionization stages of low- and mid-Z elements superimposed on a weak bremsstrahlung continuum. Traditional x-ray spectral diagnostics applied to stars include temperature determinations from line ratios and from global spectral synthesis, elemental abundance determinations from line ratios and line-to-continuum ratios, and overall x-ray flux levels from the strength of the observed x-ray emission. In this paper I have described two additional spectral diagnostics based on different atomic processes and shown how they can each be applied to high-resolution x-ray spectra of massive stars, where the x-ray emission is produced in shock-heated stellar winds.
Photoelectric absorption causes a distinctive asymmetric and blue shifted line shape, which arises from a purely geometric effect in a radially expanding optically thick wind. By quantitatively modeling individual emission lines in the x-ray spectra of single, unmagnetized massive stars, the continuum optical depth of the wind, due to photoelectric absorption, can be determined. By combining multiple measurements at different wavelengths, a single model of the wind optical depth, incorporating the effect of the wavelength dependence of the continuum opacity, can be fit to the ensemble of line optical depth values and a single wind mass-loss rate can be determined. I reported here on the first application of this technique to a massive star and find, from this analysis, a lower mass-loss rate for Puppis than is found from traditional mass-loss rate diagnostics. This result is consistent with other recent and independent reassessments of the mass-loss rate of this particular massive star. The x-ray profile fitting mass-loss rate diagnostic is attractive compared to other methods because it is sensitive to the column density of the wind rather than the square of the wind density, and so it is not subject to uncertainties due to wind clumping.
Helium-like forbidden-to-intercombination line ratios have also been shown in this paper to be useful diagnostics of massive star winds and the x-ray production that takes place within them. This line ratio is affected by photoexcitation and thus can be used as a diagnostic of the distance that the x-ray emitting plasma is from the surface of the star. I have briefly shown one application of this diagnostic to a magnetic massive star, Orionis C. The line ratio diagnostic applied to this particular star indicates that the MHD models of its magnetically channeled wind may predict a location for the x-ray producing plasma that is too far from the star’s surface.
In summary, with the advent of high-resolution stellar x-ray spectroscopy, our understanding of atomic processes as applied to the plasma found in massive star winds enables us to diagnose important properties of these objects and to test models of x-ray production in them.
References
- Puls et al. (2008) J. Puls, J. S. Vink, and F. Najarro, Astronomy & Astrophysics Review 16, 209 (2008).
- Harnden et al. (1979) F. R. Harnden, G. Branduardi, M. Elvis, P. Gorenstein, J. Grindlay, J. P. Pye, R. Rosner, K. Topka, and G. S. Vaiana, Astrophysical Journal 234, L51 (1979).
- Pallavicini et al. (1981) R. Pallavicini, L. Golub, R. Rosner, G. S. Vaiana, T. Ayres, and J. L. Linsky, Astrophysical Journal 248, 279 (1981).
- Owocki et al. (1988) S. P. Owocki, J. I. Castor, and G. B. Rybicki, Astrophysical Journal 335, 914 (1988).
- Feldmeier et al. (1997) A. Feldmeier, J. Puls, and A. W. A. Pauldrach, Astronomy & Astrophysics 322, 878 (1997).
- Babel and Montmerle (1997) J. Babel, and T. Montmerle, Astrophysical Journal 485, 29 (1997).
- Owocki and Cohen (2001) S. P. Owocki, and D. H. Cohen, Astrophysical Journal 559, 1108 (2001).
- Bouret et al. (2009) J.-C. Bouret, T. Lanz, D. J. Hillier, and C. Foellmi, in preparation (2009).
- Repolust et al. (2004) T. Repolust, J. Puls, and A. Herrero, Astronomy & Astrophysics 415, 394 (2004).
- Puls et al. (2006) J. Puls, N. Markova, S. Scuderi, C. Stanghellini, O. G. Taranova, A. W. Burnley, and I. D. Howarth, Astronomy & Astrophysics 454, 625 (2006).
- Wade et al. (2008) G. A. Wade, E. Alecian, D. A. Bohlender, J.-C. Bouret, J. H. Grunhut, H. Henrichs, C. Neiner, V. Petit, N. S. Louis, M. Auriere, O. Kochukhov, J. Silvester, and A. ud Doula, “IAUS 259: Cosmic Magnetic Fields,” 2008.
- Donati et al. (2002) J.-F. Donati, J. Babel, T. J. Harries, I. D. Howarth, P. Petit, and M. Semel, Monthly Notices of the Royal Astronomical Society 333, 55 (2002).
- Gagné et al. (2005) M. Gagné, M. E. Oksala, D. H. Cohen, S. K. Tonnesen, A. ud Doula, S. P. Owocki, R. H. D. Townsend, and J. J. MacFarlane, Astrophysical Journal 628, 986 (2005).
- Gabriel and Jordan (1969) A. H. Gabriel, and C. Jordan, Monthly Notices of the Royal Astronomical Society 145, 241 (1969).
- Blumenthal et al. (1972) G. R. Blumenthal, G. W. F. Drake, and W. H. Tucker, Astrophysical Journal 172, 205 (1972).
- Lanz and Hubeny (2006) T. Lanz, and I. Hubeny, Astrophysical Journal Supplement 146, 417 (2006).