The Origin of Extended Disk Galaxies at z=2
Abstract
Galaxy formation models typically assume that the size and rotation speed of galaxy disks are largely dictated by the mass, concentration, and spin of their surrounding dark matter haloes. Equally important, however, are the fraction of baryons in the halo that collect into the central galaxy, as well as the net angular momentum that they are able to retain during its assembly process. We explore the latter using a set of four large cosmological N-body/gasdynamical simulations drawn from the OWLS (OverWhelmingly Large Simulations) project. These runs differ only in their implementation of feedback from supernovae. We find that, when expressed as fractions of their virial values, galaxy mass and net angular momentum are tightly correlated. Galaxy mass fractions, , depend strongly on feedback, but only weakly on halo mass or spin over the halo mass range explored here (). The angular momentum of a galaxy, expressed in units of that of its surrounding halo, , correlates with in a manner that is insensitive to feedback and that deviates strongly from the simple assumption often adopted in semi-analytic models of galaxy formation. The - correlation implies that, in a given halo, galaxy disk size is maximal when the central galaxy makes up a substantial fraction (-) of all baryons within the virial radius (i.e., -). At , such systems may host gaseous disks with radial scale lengths as large as those reported for star-forming disks by the SINS survey, even in moderately massive haloes of average spin. Extended disks at may thus signal the presence of systems where galaxy formation has been particularly efficient, rather than the existence of haloes with unusually high spin parameter.
1 Introduction
Galaxy disks are widely assumed to form as gas cools and flows hydrodynamically to the center of dark matter haloes. There, baryons settle into thin, rotationally-supported structures whose size and rotation speed are determined by the detailed mass profile of the system and the net angular momentum of the cooled baryons. In this formation scenario, first laid out by Fall & Efstathiou (1980) and worked out in detail by Mo et al. (1998, hereafter MMW98), the tight correlations observed to link the mass, size, and rotation speed of galaxy disks are thought to reflect analogous correlations between the mass, size and spin of their surrounding dark haloes (see, e.g., Navarro & Steinmetz, 2000).
For dark haloes, these scaling laws have been extensively studied through cosmological N-body simulations, and are now fairly well understood. Mass and radius scale so that galaxy haloes are all systems of roughly similar overdensity that, when properly scaled, follow a mass profile well approximated by a simple “universal” fitting formula (Navarro et al., 1996, 1997). Similarly, the net spin of dark haloes, when expressed in dimensionless form (), appears on average to be independent of mass and/or redshift (see, e.g., Bett et al., 2007).
One important and robust corollary of these results is that the characteristic density of haloes should broadly track the mean density of the universe and, therefore, increase rapidly with redshift. On dimensional grounds, since circular velocity scales like , an increase in density, , implies also an increase in the ratio with . Therefore, if the size and rotation speed of galaxy disks simply reflect the radius and circular velocity of their surrounding haloes, the size of disks of given rotation speed is expected to decrease steadily with increasing .
The recent discovery of a population of extended disk galaxies at by the SINS survey has confounded this simple expectation (Genzel et al., 2006; Förster Schreiber et al., 2006). In some cases, these galaxies have rotation speeds comparable to those of disks today and are as extended as their counterparts, a result that has led Bouché et al. (2007) to argue that haloes with unusually large spin—much greater than expected in the prevailing CDM paradigm—may be required to explain disks as large as observed in the SINS survey.
We note, however, that disk size depends not only on the properties of dark haloes, but also on the fraction of baryons that collapse to form the disk, and on the net angular momentum that these baryons retain during the disk assembly process. These parameters are difficult to estimate, as they likely depend in a complex manner on the intricate process of mass accretion, star formation, and the regulating effects of energetic feedback that accompany the formation of a galaxy. A further complication stems from the fact that SINS observations measure the size of the star-forming gaseous disk through its redshifted emission. This may differ from the true spatial extension of all the baryons in the disk, which is what theoretical models predict most accurately.
We address these issues here using a set of large cosmological N-body/gasdynamical simulations from the OWLS (OverWhelmingly Large Simulations) project (Schaye et al, in preparation). In this Letter we study the dependence of galaxy disk size on supernova feedback and its consequence for the interpretation of galaxy sizes reported by the SINS collaboration. A more general analysis of the relation between galaxy mass, angular momentum, feedback, and accretion history will be presented in a companion paper (Sales et al, in preparation).
2 The Numerical Simulations
The OWLS project is a collection of over N-body/gasdynamical cosmological simulations with varying numerical resolution and various choices for the implementation of star formation, cooling, feedback, and other sub-grid physics. All simulations use a substantially modified version of the smoothed particle hydrodynamics code GADGET-3 (Springel, 2005).
We select for this study four OWLS runs that differ from each other only in the way energetic feedback from massive stars is implemented. All these runs assume a standard CDM cosmology consistent with the WMAP-3 results (, , , , , , ) and follow the evolution of dark matter and gas particles in a Mpc box to . The mass per baryonic particle is and times higher for the dark matter component. The runs adopt a gravitational softening that never exceeds kpc (physical).
Gas is allowed to cool radiatively using the element-by-element implementation of Wiersma et al. (2009a). Gas with densities exceeding is allowed to form stars at a pressure-dependent rate consistent with the Schmidt-Kennicutt relation (Schaye & Dalla Vecchia, 2008). The timed release of 11 chemical elements by evolving stellar populations is implemented as described in Wiersma et al. (2009b). Feedback energy from supernovae is incorporated assuming that a fixed fraction of the available energy ( of the total energy released by supernovae for the adopted Chabrier IMF) is channeled into “winds” outflowing from regions of active star formation. All four runs assume that the total energy (per solar mass of stars formed) invested in the outflow is the same, but differ in their numerical implementation, which is controlled by two parameters: the wind velocity () and the mass loading () factor. The parameter specifies the number of gas particles among which the feedback energy from a single star particle is split, whereas characterizes the outflow velocity of particles in the wind (see Dalla Vecchia & Schaye 2008 for details).
For massive galaxies, the overall effect of feedback, as measured by how effectively it regulates star formation and/or removes gas from star-forming galaxies, increases with for fixed . We refer to each of the 4 runs, in order of increasing feedback efficiency, as: WF4 ( and km/s), WF2 ( and km/s), WF1 ( and km/s) and WF2Dec. The latter is equivalent to WF2 but “wind” particles are temporarily decoupled from the hydrodynamical equations, allowing them to freely escape the interstellar medium.
We focus on all simulated galaxies at the centers of haloes in the virial mass range . We define the virial radius, , of a system as that of a sphere enclosing a mean overdensity 178 times the critical value at that redshift. All “virial” quantities are measured at or within that radius. Our galaxy sample contains objects with between and particles within the virial radius. The center is given by the position of the most-bound particle and the center of mass velocity corresponds to the average velocity of the 1000 innermost particles. Central “galaxies” are identified in each halo with the baryonic component of the system defined to be contained within from the halo center. We have explicitly checked that this definition includes all of the stars and cold, star-forming gas obviously associated with the central object. Since the four simulations have identical initial conditions, any difference in the galaxy population can be traced directly to the different feedback implementation in each run.
3 Results
3.1 Galaxy mass and angular momentum
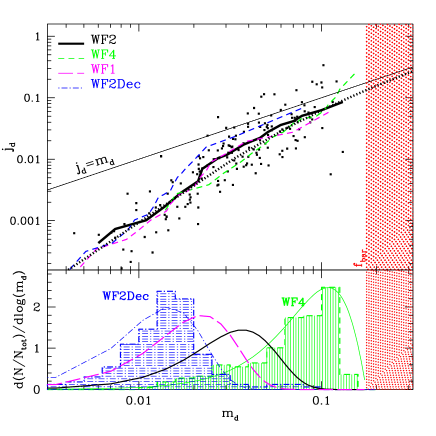
The baryonic mass of central galaxies depends strongly on the details of the feedback implementation. This is shown in the bottom panel of Fig. 1, where we plot the distribution of galaxy masses (gas and stars within ), expressed in units of the virial mass of the surrounding halo, , for our four OWLS runs at . When feedback effects are weak, such as in WF4, most of the baryons flow unimpeded to the center of the halo. As a result, is on average quite large and approaches in some systems the theoretical maximum posed by the universal baryon fraction, . At the other extreme, when feedback is strong, as in WF2Dec, a large fraction of baryons are pushed out of the central galaxy by feedback-driven winds. This leads to low values of (), implying that fewer than of all available baryons are retained by the central galaxy in a typical halo. Intermediate feedback choices (as in WF1 and WF2) lead to distributions that straddle those two extremes. In all cases, however, the distribution is quite broad and insensitive to halo spin and mass, at least over the range of masses included in our sample.
One surprise, given the sensitive dependence of on feedback discussed above, is the fact that the net angular momentum of the central galaxy, when expressed in units of the virial value (), correlates with , in a manner that is approximately independent of feedback. This is shown in the top panel of Fig. 1, where the thick line track the median as a function of . Points show individual values only for WF2, others are omitted for clarity. (The same relation is found in a simulation identical to WF2 but with lower mass resolution, indicating that this result is not compromised by numerical resolution.) All four runs follow the same - trend, which is well approximated by the relation
| (1) |
where the last factor ensures that asymptotically approaches for large values (see dotted line in Figure 1). Our simulations only sample the region . Care should therefore be taken when extrapolating eq. (1) beyond these limits. The scatter about this relation is not negligible, with an rms of order about the median trend. Note that this relation implies that the specific angular momentum of a galaxy, , is quite different from the specific angular momentum of its surrounding halo, , unlike what is often assumed in semi-analytic models of galaxy formation ( is equivalent to setting ). Indeed, and are very poorly correlated in our simulations (see also van den Bosch et al., 2002; Dutton & van den Bosch, 2009).
3.2 Galaxy sizes
According to the MMW98 formalism, once and are specified, the size of a galactic disk may be predicted in a halo of known virial radius , concentration , and spin parameter . The model assumes that baryons settle onto a thin, rotationally supported disk with an exponential radial density profile. The scale radius of such a disk is given by
| (2) |
where and are known functions that account for the effect of halo concentration as well as its adiabatic “contraction” in response to the assembly of the galaxy.
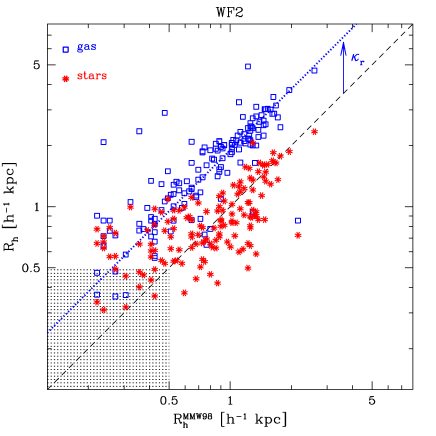
It is instructive to see how this simple prediction fares in comparison with simulated galaxies. This is shown in Fig. 2, where we compare half-mass radii measured for galaxies identified in the WF2 run with those computed using Eq. (2). We use half-mass radii instead of exponential scale lengths because it is a more robust size estimate, especially when profiles deviate from simple exponentials, typically as a result of the presence of a spheroid. Starred symbols correspond to the stellar component and open squares to the gaseous (star forming) disk component. Half-mass radii are computed in projection, after using the angular momentum of the galaxy to turn the system “face-on”. The shaded area indicates radii smaller than the gravitational softening.
On scales exceeding the softening radius, the agreement between the size of the stellar component and the MMW98 prediction is reasonable, especially considering the many simplifying assumptions in the model. For example, MMW98 assume that all of the mass is in an exponential disk, whereas many of the simulated galaxies show prominent spheroidal components.
Encouragingly, the gaseous disks show a much better correlation with MMW98 model, and seem to differ from by an approximately constant factor . This implies that the predictions of Eq. (2) may be simply corrected by to provide reasonably accurate estimates of the size of gaseous disks such as those observed in the SINS survey.
3.3 Disk size and rotation speed
The MMW98 formalism predicts not only the size of a disk but also its rotation speed, , once the halo parameters (, , and ) as well as the parameters characterizing the galaxy ( and ) are specified. As discussed in the previous section, although and are tightly linked, the distribution is very broad, so it is important to explore how much disk sizes may vary solely as a result of variations in .
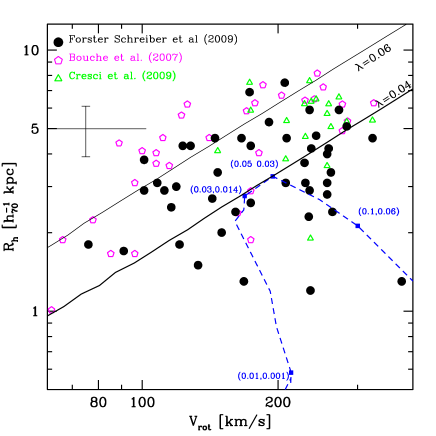
We illustrate this in Fig. 3 for the case of a halo with virial velocity , (the average concentration for that mass at ; Gao et al., 2008; Duffy et al., 2008), and (roughly the median spin parameter of CDM haloes; see, e.g., Bett et al., 2007). We use the MMW98 formalism to compute the size and rotation speed of a gaseous disk galaxy in this halo as a function of , assuming that follows the median relation for run WF2 (thick solid line in Fig. 1) and including the correction. The result is shown by the dashed curve in Fig. 3, which spans a very wide range, from at the bottom left endpoint to at the upper right.
A few points are highlighted by this exercise. The first is the very wide range in disk size expected from a broad distribution: the disk size changes by a factor of roughly , from pc to almost kpc (physical), when increases from to . This implies that the size of galactic disks is as sensitive to as to the spin parameter.
The second point is that disk size is maximized for , and declines when increases further. This is because when exceeds a certain value, the disk becomes so massive that it begins to significantly steepen the central potential, which in turn implies that higher rotation speeds are required to achieve centrifugal equilibrium. As a result, disks rotate faster but actually become smaller, leading the dashed curve in Fig. 3 to decline for . Accurate predictions of the size of galactic disks clearly require that and be very tightly constrained.
The pentagons, triangles, and circles in Fig. 3 show SINS data from the compilations of Bouché et al. (2007), Cresci et al. (2009), and Förster Schreiber et al. (2009). Galaxy radii from Bouché et al. (2007) are half-light radii (taken from their Fig. 1) whereas for Cresci et al (2009) the radii plotted are the “disk scale lengths” derived from their dynamical modeling (taken from their Table 2). Radii for the Förster Schreiber et al galaxies are also half-light radii, as given in their Fig.18.
Although we show predicted half-mass gas radii in Fig. 3, we have also estimated in our simulated galaxies half-light radii by weighting each gas particle by its star formation rate and by applying an extinction correction based on the metal column through the star-forming gas. This procedure gives results which are similar to the simple half-mass radii of the gaseous disks measured directly from the simulations, suggesting that the comparison of SINS disk sizes with the half-mass gas radii of simulated galaxies is fair.
The dashed-curve in Fig. 3 thus makes clear that even a moderately massive halo of average concentration and spin may host a disk as large as some of those reported in the SINS survey (- kpc if -). Of course, larger disks may also exist; for example, in more massive haloes, or in haloes with larger-than-average spin, or in systems that scatter above the mean - relation shown in Fig. 1. For example, the curves in Fig. 3 labelled and indicate where disks would lie if is fixed at and the halo mass is varied. Disks as large as kpc are clearly allowed for the right combination of and .
We conclude that the presence of some extended gaseous disks at is not necessarily in conflict with the CDM scenario (see also Dekel et al., 2009). However, without strong and tight constraints on the distribution at it is quite difficult to assess whether the existence of extended disks in the SINS survey presents a real challenge to the CDM paradigm. Constraining the distribution is, unfortunately, a non trivial task where direct simulations offer little guidance, given the strong sensitivity of to the uncertain implementation of feedback highlighted above.
On the other hand, semi-analytic models suggest that a fairly low galaxy formation efficiency is required in order to account for the galaxy stellar mass function and its evolution with redshift. Conroy & Wechsler (2009), for example, argue that fewer than of baryons should be transformed into stars in galaxy-sized haloes. This implies . Should this constraint hold true, it would imply that very few systems may, on average, reach the needed to maximize their disk size. Figure 1 shows that many of our galaxies are more massive relative to their haloes than inferred by Conroy & Wechsler (2009), particularly if the SN feedback is weak. Unless star formation is quenched in these objects, these simulations would therefore overestimate the abundance of massive galaxies if they were continued to lower redshifts.
We can make some progress by assuming that the distribution, , is independent of halo mass and spin (which approximately holds over the mass range considered here) and by parametrizing it with a simple function,
| (3) |
where and is a normalization factor. We note, however, that does depend on mass when extending this analysis to lower mass halos. Eq. (3) provides an adequate fit to the distribution in all our simulations, as shown by the thin lines in the bottom panel of Fig. 1. The single parameter fully specifies the distribution; the location of the peak varies monotonically with , shifting from () for WF4 to () for WF2Dec.
Adopting Eq. (3) to describe the distribution, and Eq. (1) for the dependence (including scatter, ), we can compute the abundance of extended disks expected in the CDM scenario by populating the dark haloes in the simulations with disks of size consistent with these distributions. For each halo we assign, at random, a concentration taken from a log-normal distribution centered on (Gao et al., 2008) with width (Neto et al., 2007), and a spin parameter drawn from the actual distribution of the sample. The latter has median and dispersion , roughly consistent with Bett et al (2007).
Fig. 4 shows, as a function of (median of the distribution), the number density of gaseous disks with kms and half-mass radii exceeding , , and kpc (physical) at . For , which corresponds to the case where of baryons in a galaxy-sized halo have been assembled into galaxies, we expect of order extended disk per cubic comoving Mpc. Even for a as low as , one would still expect of order one such system per cubic Mpc. Comparing these numbers to the abundance of disks at from the SINS survey would help to confirm whether the presence of extended disks is indeed in conflict with CDM.

4 Conclusions
We have analyzed the baryonic mass and angular momentum content of galaxies identified in four different runs selected from the OWLS set of cosmological N-body/gasdynamical simulations. We focus on galaxies forming at the centers of haloes with virial mass between and at . The four runs analyzed differ only in the way the supernova feedback is implemented numerically in the simulations. Our main conclusions may be summarized as follows.
-
•
The efficiency of feedback, as measured by the fraction of baryons that assemble into a central galaxy in each halo, varies strongly in our four simulations. In the least efficient feedback run, WF4, typically about of the baryons in a halo get assembled into the central galaxy. At the other extreme, in run WF2Dec, where feedback efficiency is highest, central galaxies are able to retain less that of all available baryons.
-
•
Despite these differences in feedback efficiency, galaxies identified in all four simulations follow the same tight relation between mass (expressed in units of the halo virial mass, ) and angular momentum (also expressed as a fraction of the virial value, ). This relation deviates strongly from the simple = assumption often used in semi-analytic models of galaxy formation and is well approximated by , with rms dispersion .
-
•
The galaxy mass fraction parameter, , shows a broad distribution, with a mean and dispersion that are insensitive to halo spin and mass (over the range spanned by our sample). Together with the tight - relation, this implies that the size of galactic disks will vary widely, even for galaxies formed in haloes of similar mass, concentration, and spin. The size of galactic disks is maximized when -. Such disks can easily match the observed size of gaseous disks in the SINS survey, even in moderately massive haloes of average spin.
-
•
The abundance of extended disk systems expected at for CDM depends critically on the distribution. Assuming that the form of this distribution may be approximated by Eq. (3), we have computed the expected abundance of gaseous disks with half-mass radii exceeding , , and kpc (physical). If the average is such that of baryons collect into galaxies, we would expect of order system with kpc in a Mpc3 (comoving) volume. This predicted abundance could be compared with observational estimates, once they become available.
We conclude that galaxy formation efficiency, through the tight - relation found in our simulations, plays a crucial role in setting the size and rotation speed of galaxy disks. This should be taken into account carefully in galaxy formation models. Extended disks are expected to exist at in the CDM scenario, but in small numbers. The large disks found by the SINS survey should not be “typical” galaxies at , but rather some of the largest. The selection of SINS galaxies favors large disks in order to enhance the probability of obtaining resolved velocity maps, so cannot be considered “typical’ either. It seems likely that a number of large disks at could be accommodated in the CDM scenario without resorting to unexpectedly high halo spins or other unusual formation mechanism.
We acknowledge the anonymous referee for useful suggestions and comments that helped to improve the manuscript. We also thank Natascha Förster Schreiber for providing SINS data in electronic format. This work was supported by NWO, NOVA, NSF grant PHY05-51164, and a Marie Curie Excellence Grant.
References
- Bett et al. (2007) Bett P., Eke V., Frenk C. S., Jenkins A., Helly J., Navarro J., 2007, MNRAS, 376, 215
- Bouché et al. (2007) Bouché N., Cresci G., Davies R., Eisenhauer F., Förster Schreiber N. M., Genzel R., Gillessen S., and 13 coauthors 2007, ApJ, 671, 303
- Conroy & Wechsler (2009) Conroy C., Wechsler R. H., 2009, ApJ, 696, 620
- Cresci et al. (2009) Cresci G., Hicks E. K. S., Genzel R., Förster Schreiber N. M., Davies R., Bouche’ N., Buschkamp P., Genel S., and 18 coauthors 2009, ArXiv e-prints
- Dalla Vecchia & Schaye (2008) Dalla Vecchia C., Schaye J., 2008, MNRAS, 387, 1431
- Dekel et al. (2009) Dekel A., Sari R., Ceverino D., 2009, ArXiv e-prints, 0901.2458
- Duffy et al. (2008) Duffy A. R., Schaye J., Kay S. T., Dalla Vecchia C., 2008, MNRAS, 390, L64
- Dutton & van den Bosch (2009) Dutton A. A., van den Bosch F. C., 2009, MNRAS, pp 608–+
- Fall & Efstathiou (1980) Fall S. M., Efstathiou G., 1980, MNRAS, 193, 189
- Förster Schreiber et al. (2009) Förster Schreiber N. M., Genzel R., Bouche N., Cresci G., Davies R., Buschkamp P., Shapiro K., and 23 coauthors 2009, ArXiv e-prints
- Förster Schreiber et al. (2006) Förster Schreiber N. M., Genzel R., Lehnert M. D., Bouché N., Verma A., Erb D. K., Shapley A. E., and 10 coauthors 2006, ApJ, 645, 1062
- Gao et al. (2008) Gao L., Navarro J. F., Cole S., Frenk C. S., White S. D. M., Springel V., Jenkins A., Neto A. F., 2008, MNRAS, 387, 536
- Genzel et al. (2006) Genzel R., Tacconi L. J., Eisenhauer F., Förster Schreiber N. M., Cimatti A., Daddi E., Bouché N., and 12 coauthors 2006, Nature, 442, 786
- Mo et al. (1998) Mo H. J., Mao S., White S. D. M., 1998, MNRAS, 295, 319
- Navarro et al. (1996) Navarro J. F., Frenk C. S., White S. D. M., 1996, ApJ, 462, 563
- Navarro et al. (1997) Navarro J. F., Frenk C. S., White S. D. M., 1997, ApJ, 490, 493
- Navarro & Steinmetz (2000) Navarro J. F., Steinmetz M., 2000, ApJ, 538, 477
- Neto et al. (2007) Neto A. F., Gao L., Bett P., Cole S., Navarro J. F., Frenk C. S., White S. D. M., Springel V., Jenkins A., 2007, MNRAS, 381, 1450
- Schaye & Dalla Vecchia (2008) Schaye J., Dalla Vecchia C., 2008, MNRAS, 383, 1210
- Springel (2005) Springel V., 2005, MNRAS, 364, 1105
- van den Bosch et al. (2002) van den Bosch F. C., Abel T., Croft R. A. C., Hernquist L., White S. D. M., 2002, ApJ, 576, 21
- Wiersma et al. (2009) Wiersma R. P. C., Schaye J., Smith B. D., 2009, MNRAS, 393, 99
- Wiersma et al. (2009) Wiersma R. P. C., Schaye J., Theuns T., Dalla Vecchia C., Tornatore L., 2009, arXiv:0902.1535