22institutetext: INAF, Istituto di Radioastronomia, via Gobetti 101, I-40129 Bologna, Italy
33institutetext: INAF, Osservatorio Astronomico di Cagliari, Strada 54, Loc. Poggio dei Pini, I-09012 Capoterra (Ca), Italy
44institutetext: Department of Physics and Astronomy, University of New Mexico, Albuquerque, NM 87131, USA & Adjunct Astronomer at the National Radio Astronomy Observatory
55institutetext: Institute for Astronomy, University of Hawaii, 2680 Woodlawn Drive, Honolulu, HI 96822, USA
66institutetext: Kavli Institute for Particle Astrophysics and Cosmology, Stanford University, 382 Via Pueblo Mall, Stanford, CA 94305-4060, USA
77institutetext: Institut d’Astronomie et d’Astrophysique, Faculté des Sciences, Université Libre de Bruxelles, CP 226, Bvd du Triomphe, B-1050, Bruxelles, Belgium
88institutetext: Sterrenkundig Observatorium, Universiteit Gent, Krijgslaan 281, B-9000 Gent, Belgium.
Revealing the magnetic field in a distant galaxy cluster: discovery of the complex radio emission from MACS J0717.5 +3745
Abstract
Aims. To study at multiple frequencies the radio emission arising from the massive galaxy cluster MACS J0717.5+3745 (z=0.55). Known to be an extremely complex cluster merger, the system is uniquely suited for an investigation of the phenomena at work in the intra-cluster medium (ICM) during cluster collisions.
Methods. We use multi-frequency and multi-resolution data obtained with the Very Large Array radio telescope, and X-ray features revealed by Chandra, to probe the non-thermal and thermal components of the ICM, their relations and interactions.
Results. The cluster shows highly complex radio emission. A bright, giant radio halo is detected at frequencies as high as 4.8 GHz. MACS J0717.5+3745 is the most distant cluster currently known to host a radio halo. This radio halo is also the most powerful ever observed, and the second case for which polarized radio emission has been detected, indicating that the magnetic field is ordered on large scales.
Key Words.:
Galaxies:clusters:general - Galaxies:clusters:individual: MACS J0717+3745 - Radiation mechanism:non-thermal - Polarization - Magnetic field1 Introduction
A detailed description of the physical conditions and energetics of the intra-cluster medium (ICM) in galaxy clusters requires adequate knowledge of the role of the non-thermal components: relativistic particles and magnetic fields. In recent years, non-thermal ICM emission and its connection with highly energetic events occurring during cluster mergers has become a much researched and discussed topic. Radio halos and radio relics are suspected to be the signature of mergers, although their origin and evolution is still the subject of considerable debate. Radio halos have now been observed in the central region of several clusters of galaxies. With the exception of the radio halo in Abell 2255 (Govoni et al. 2005), they are not polarized, and their spectrum111We define the radio spectrum as , where is the spectral index and S the observed flux density at frequency is steep ( 1). Radio halo emission is likely due to the re-acceleration of electrons permeating the cluster volume (see e.g. Brunetti et al. 2008). By contrast, radio relics are usually observed at the periphery of galaxy clusters. They vary widely in morphology and size and are polarized at a level of 20-30% at 1.4 GHz. They also exhibit steep radio spectra and are thought to be generated by shocks occurring in the ICM during merger events (see e.g. Roettiger et al. 1999; Hoeft & Brueggen 2007). Both radio-halo and radio-relic emission indicate the presence of a G magnetic field in the ICM.
In recent years, the presence of magnetic fields in galaxy clusters has been unambiguously established, and their importance for our understanding of the physical processes at work in the ICM has been recognized (see e.g. the reviews by Carilli & Taylor 2002; Govoni & Feretti 2004; Ferrari et al. 2008; Dolag et al. 2008). Magnetic fields are able to inhibit transport processes like heat conduction, spatial mixing of gas, and the propagation of cosmic rays. Values of the Faraday Rotation Measure (RM) have been determined both for radio galaxies within and behind the cluster, using statistical samples (e.g. Kim et al. 1991; Clarke 2004, Johnston-Hollitt et al. 2004) as well as individual clusters by analyzing high-resolution images (e. g. Taylor & Perley 1993, Feretti et al. 1995, Govoni et al. 2006). The results are consistent with the presence of magnetic fields of a few G throughout the cluster, in agreement with predictions from cosmological MHD simulations (Dolag & Stasyszyn 2008, Donnert et al. 2009). These studies also indicate that the magnetic fields in the ICM are structured on scales as low as 10 kpc, and possibly even less. Work on magnetic fields in clusters has, so far, focused on relatively nearby systems (z0.4), with much less information being available for clusters at higher redshift. Extending the redshift range of such studies is crucial because of their importance to the subject of the formation and evolution cosmic magnetic fields, and to investigate how the strength and structure of magnetic fields in clusters is connected to the systems’ dynamic history.
MACS J0717.5+3745 (MACS J0717; ) was discovered in the Massive Cluster Survey (MACS; Ebeling, Edge & Henry 2001) and has since been found to be one of the most disturbed galaxy clusters known at any redshift. It is part of the statistically complete sample of the twelve most distant MACS clusters, all of which lie at (Ebeling et al. 2007). In-depth optical and X-ray studies of the galaxy population and the ICM of MACS J0717 identified it as one of the most promising targets for studies of the physical mechanisms governing merger events (Ebeling et al. 2004; Ma et al. 2008, 2009).
Our detailed study of the radio emission arising from both galaxies and the ICM of this cluster is prompted by the work of Edge et al. (2003) who discovered a radio relic in MACS J0717 when analyzing data from the Faint Images of the Radio Sky at Twenty-cm (FIRST, Becker et al. 1995 ) survey. Since radio emission is indicative of the presence of a magnetic field, such observations are the most direct way to obtain information of this fundamental ingredient in the physics of the ICM.
In Secs. 2 and 3 we summarize our present knowledge of this cluster based on previous optical and X-ray studies. Radio observations and data reduction techniques are described in Sec. 4. In Secs. 5 and 6 we discuss the total-intensity emission from the radio galaxies and from the ICM. In Sec. 7 we analyze the polarization properties of the radio emission, while in Sec. 8 results for the Faraday Rotation are presented and discussed. The spectral index and the magnetic field properties of this cluster are the subjects of Secs. 9 and 10. Finally, conclusions are presented in Sec. 11. We use the concordance cosmological model CDM, with H71 km/s/Mpc, 0.27, and 0.73. In this cosmology, at redshift z=0.55, 1 arcsecond corresponds to a scale of 6.394 kpc.
| Project | RA | DEC | Bandwidth | Configuration | Date | ToS | Restoring beam | rms noise | |
|---|---|---|---|---|---|---|---|---|---|
| Id | (J2000) | (J2000) | (GHz) | (MHz) | (Hours) | (mJy/beam) | |||
| AG761 | 07h17m35.0s | 37d45′07′′ | 1.365 - 1.435 | 25 | B | 16-DEC-07 | 2.2 | 54 | 0.030 |
| AG761 | 07h17m35.0s | 37d45′07′′ | 1.485 - 1.665 | 25 | B | 24-DEC-07 | 2.8 | 54 | 0.025 |
| AG761 | 07h17m35.0s | 37d45′07′′ | 4.885 - 4.535 | 50 | C | 24-MAR-08 | 2.4 | 54 | 0.015 |
| AG761 | 07h17m53.0s | 37d42′11′′ | 4.885 - 4.535 | 50 | C | 20-APR-08 | 2.2 | 54 | 0.016 |
| AT0358 | 07h17m30.9s | 37d45′30′′ | 1.425 | 50 | C | 15-MAR-08 | 1.8 | 1814 | 0.020 |
| AH748 | 07h17m33.8s | 37d45′20′′ | 4.860 | 50 | D | 27-NOV-01 | 1.5 | 1814 | 0.020 |
| AE0125 | 07h17m35.4s | 37d45′07′ | 8.460 | 50 | C | 22-NOV-1998 | 0.2 | 2.42 | 0.04 |
2 Optical observations
The complex optical morphology of MACS J0717 was first noted by Edge et al. (2003), based on imaging in the V, R, and I passbands obtained with the University of Hawaii 2.2m telescope. Much deeper observations conducted since with SuprimeCam, the wide-field imager at the prime focus of the Subaru 8m telescope, firmly established MACS J0717 as a highly disturbed merger and led to the discovery of a 6-Mpc long filament leading into the cluster from the South-East (Ebeling et al. 2004). Spectroscopic observations of over a thousand galaxies in the field of MACS J0717 have been performed in order to probe its spatial and kinematic structure along the line of sight, and to characterize the galaxy population as a function of cluster environment (Ma et al. 2008). Finally, space-based observations with the Advanced Camera for Surveys (ACS) aboard the Hubble Space Telescope (GO-09722, PI Ebeling) provided a high-resolution view of MACS J0717, including the interface region where the filament meets the dynamically most active central region of the cluster.
3 X-ray observations
With an X-ray luminosity of (2.74 0.03 )1045 erg/s in the 0.1-2.4 keV energy band (Ebeling et al. 2007) MACS J0717 is one of the most X-ray luminous clusters known at z0.5. The cluster was observed with the ACIS-I instrument aboard the Chandra X-ray Observatory for a total exposure time of 60 ks (ObsID 4200). A detailed study of the system’s X-ray properties was recently performed by Ma et al. (2008, 2009). Their spatial description of the gas distribution uses a -model (Cavaliere & Fusco-Femiano 1976):
| (1) |
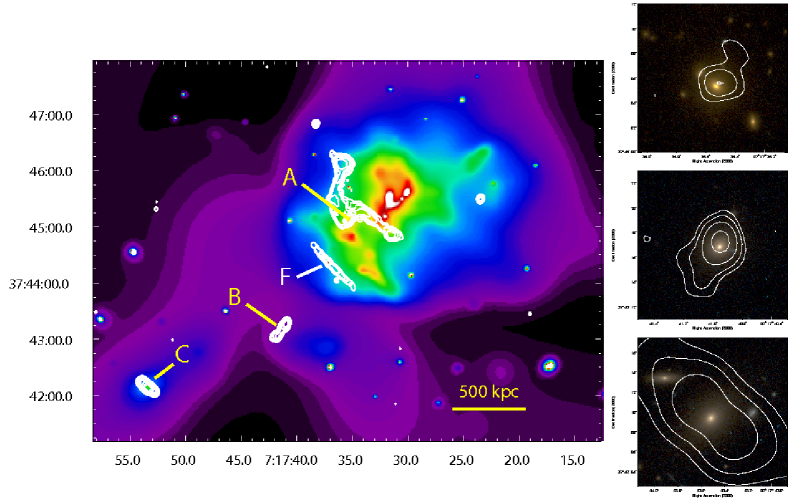
where is the gas density, is the radial distance from the cluster center, and is the cluster core radius. By fitting this model to the X-ray surface brightness data, they derived , and . Ma and co-workers report the detection of X-ray emission from the filament and, for the main cluster, a very complex X-ray morphology, including dramatic variations in the intra-cluster gas temperature, with extreme values of 5 and over 20 keV (the average gas temperature quoted by Ebeling et al. (2007) is 11 keV). The authors’ joint optical/X-ray analysis of all available data identifies the filament as the source of both continuous and discrete accretion of matter by the cluster from a south-easterly direction, and isolates four distinct subclusters participating in an ongoing triple merger. The X-ray emission from MACS J0717 and the cluster-filament interface is shown in Fig. 1.
4 Radio observations and data reduction
We investigate the radio emission from MACS J0717 with multi-frequency and multi-resolution VLA observations. Specifically, we performed new high-resolution observations in full-polarization mode. These observations focused on radio galaxies in the field, as well as on the relic, to study their Faraday Rotation Measure. In addition, new low-resolution observations were performed to study the diffuse emission of the cluster. We also used archival VLA observations, both of high and low resolution, as specified below.
4.1 High-resolution observations
MACS J0717 was observed with the B array at four frequencies within the 20-cm band (1.365 GHz, 1.435 GHz, 1.485 GHz, and 1.665 GHz), and with the C array at two frequencies within the 6-cm band (4.535 GHz, and 4.885 GHz). The targets of these observations were the relic, the radio galaxy embedded in the relic emission (labelled A in Fig. 1) and the radio galaxies labelled B and C in Fig. 1 detected at larger projected distance from the cluster center. Two separate pointings were necessary at 6 cm to avoid bandwidth and primary-beam attenuation. The source 0137+331 (3C48) was used as the primary flux-density calibrator, and the source 0521+166 (3C138) as an absolute reference for the electric vector polarization angle. The nearby source 0713+438 was observed at intervals of 20 min and used as phase calibrator. Calibration and imaging were performed with the NRAO Astronomical Image Processing System (AIPS), following standard procedures. Self-calibration was performed to refine antenna phase solutions, followed by a final gain and amplitude self-calibration cycle. Images of the total intensity (Stokes I), as well as of the Stokes parameters U and Q, were produced for each frequency separately. We then derived images of the polarized intensity and of the polarization angle . These images were restored with a Gaussian beam of FWHM54′′ which corresponds to a linear resolution of 32 kpc. In order to distinguish the relic emission from that of embedded radio sources we have retrieved from the NRAO archive a short ( 10 min) observation performed at 8.460 GHz (project ID AE125). Here the source 3C147 was used as primary flux-density calibrator, and the source 0741+312 was used as phase calibrator. Because of the smaller field of view, only the sources A and B are visible in the radio image. Observational details are reported in Table 1.
4.2 Low-resolution observations
MACS J0717 was observed with the C array at 1.425 GHz in order to properly image the extended emission. The source 1331+305 (3C286) was used as primary flux-density calibrator, and also as an absolute reference for the electric vector polarization angle. The source 0713+438 was used as phase calibrator. Calibration and imaging were performed with the NRAO Astronomical Image Processing System (AIPS), following standard procedures. In addition, we recovered from the VLA data archive an observation at 4.860 GHz (project ID AH748). Here the source 0714+335 was used as phase calibrator. At both frequencies total-intensity maps (Stokes I) were produced using natural weighting and restored with the same beam of FWHM 1814′′, corresponding to 100 kpc. In order to study the diffuse polarized emission, I, Q, and U images were also produced from 1.425 GHz observations at low resolution (FWHM 2118′′). Observational details are reported in Table 1.
| Name | RA | DEC | dist | Peak brightness | Flux density | Peak of pol. flux | |
|---|---|---|---|---|---|---|---|
| (J2000) | (J2000) | kpc | GHz | (mJy/beam) | (mJy) | (mJy/beam) | |
| Source A | 07h17m35.4s | +37d45’08′′ | 450 | 1.365 | 8.3 | 22.2 | 0.3 |
| 1.435 | 8.4 | 22.4 | 0.3 | ||||
| 1.485 | 7.7 | 20.0 | 0.2 | ||||
| 1.665 | 7.4 | 18.1 | 0.3 | ||||
| 4.535 | 2.3 | 4.7 | 0.2 | ||||
| 4.885 | 2.1 | 3.9 | 0.2 | ||||
| 8.460 | 0.5 | 0.7 | |||||
| Source B | 07h17m40.9s | +37d43’17′′ | 1150 | 1.365 | 9.2 | 19.9 | 0.2 |
| 1.435 | 9.3 | 18.8 | 0.3 | ||||
| 1.485 | 8.8 | 18.3 | 0.4 | ||||
| 1.665 | 8.8 | 18.3 | 0.4 | ||||
| 4.535 | 4.1 | 7.0 | 0.3 | ||||
| 4.885 | 3.8 | 6.4 | 0.2 | ||||
| 8.460 | 1.6 | 1.9 | |||||
| Source C | 07h17m53.7s | +37d42’11′′ | 2140 | 1.365 | 10.0 | 32.8 | 0.1 |
| 1.435 | 9.9 | 32.3 | 0.2 | ||||
| 1.485 | 9.6 | 30.5 | 0.2 | ||||
| 1.665 | 9.8 | 30.4 | 0.2 | ||||
| 4.535 | 5.4 | 17.2 | 0.5 | ||||
| 4.885 | 5.0 | 14.7 | 0.4 |
5 Radio emission: the relic-filament structure and the radio galaxies
The presence of non-thermal emission associated with the ICM in MACS J0717 was first reported by Edge et al. (2003) who classified the emission as a relic. The wealth of radio data described in the previous section allows a multi-resolution and multi-frequency study of the radio emission arising from this cluster. Fig. 1 shows the 1.365 GHz data from VLA B-array observations in contours, overlaid on the X-ray surface brightness in colors. The radio data reveal a bright, filamentary structure whose central part is coincident with the relic discovered by Edge et al. (2003). In addition, several radio sources are detected. Those related to the cluster and the large-scale optical and X-ray filament are labelled A, B, and C, whereas the source labelled F is a radio galaxy in the foreground (, Ma et al., in preparation).
A proper study of the extended emission associated with the ICM needs to take into account possible contamination from radio galaxies embedded in the diffuse emission. This can be done with the help of high-resolution and high-frequency observations in which the extended emission is resolved out and too faint to be detected. Using 8.460 GHz observations we have identified one such embedded radio galaxy, labelled A in Fig. 1 and shown in a close-up view in the side panel of the same figure. This source is 70′′ away from the cluster center in projection. It is consists of a bright region, likely the core of the radio galaxy, with a spectral index of 0.7 between 1.465 GHz and 4.885 GHz, and an extended, more diffuse region extending toward the NW. The spectral index steepens up to with increasing distance from the core. The optical counterpart coincides with the radio core (Fig. 1) .
Moving out from the cluster center, two additional radio galaxies, labeled B and C in Fig. 1, are visible at all the observed frequencies. Both are located to the SE of the cluster’s X-ray center, at projected distances of 180′′ and 335′′, respectively. We note their position along the X-ray and optical large-scale filament detected by Ebeling et al. (2004). Source C is the brightest cluster galaxy of the next cluster (also detected in the Chandra observation) that is going to merge with MACS J0717. In Table 2 we report the main radio properties of the identified radio galaxies at the observed frequencies. The optical counterparts of A, B, and C are all spectroscopically confirmed to lie at redshifts consistent with that of MACS J0717 proper.
6 The radio halo
Being sensitive to structure on larger angular scales, observations performed with the C array at 1.425 GHz and with D array at 4.860 GHz reveal the presence of an extended radio halo permeating the cluster volume around the filamentary structure visible at high resolution and discussed in the previous section. MACS J0717 is the most distant cluster in which a radio halo has been observed so far and its presence, together with the radio halo detected in the cluster CL0016 by Giovannini & Feretti (2000) at z=0.54, indicates that the ICM is already significantly magnetized at redshift z0.5. The detection of yet more extended emission around the filamentary structure detected at higher resolution raises some questions about the nature and origin of the latter. This structure could either be a radio relic located at the cluster periphery, but appearing close to the cluster center when viewed in projection, or it could be a filamentary feature that is in fact part of the radio halo. We will further investigate these hypotheses with the help of additional information on the polarization and spectral index of the radio emission (see Secs. 8 and 9). In the following analysis, we will refer to this feature as the relic-filament in order to stress its uncertain nature.
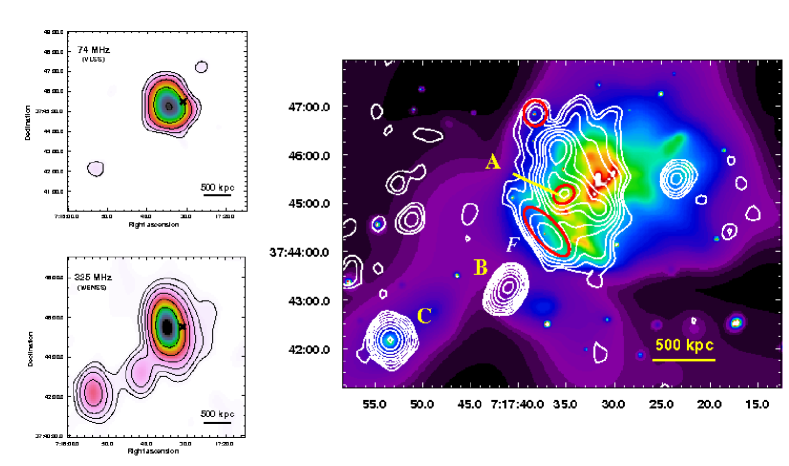
In Fig. 2 the halo emission at 1.425 GHz is shown overlaid onto the cluster X-ray emission. The maximal angular extent of the halo at 1.425 GHz is 240′′in the NS direction, corresponding to a linear size of 1.5 Mpc. At 4.860 GHz only the brightest regions of the halo are visible, and its angular extent is reduced to 160′′ (i. e. 1 Mpc ).
As shown in the panels on the left of Fig. 2, the radio halo in MACS J0717 is also detected at 74 MHz in the VLSS (VLA Low Sky Survey, Cohen et al. 2007), and at 325 MHz in the Westerbork Northern Sky Survey (WENSS, Rengelink et al. 1997). The VLSS was performed with the B array at a resolution of 8080′′ and with an rms noise level of 0.08 Jy/beam, while the WENSS has a resolution of 5454, which translates into 5484′′ for the declination of MACS J0717. The apparent angular extent of the halo in the WENSS image is 280′′, corresponding to 1.8 Mpc. Furthermore, faint radio emission that appears to connect the radio galaxies B and C with the central halo is detected at 325 MHz at 3 significance. We note that this region coincides with the large-scale filament funneling matter onto MACS J0717 that has been detected at optical and X-ray wavelengths by Ebeling et al. (2004) and Ma et al. (2009). The detection of radio emission in this area might indicate that the magnetic field is already present in the filament before the amplification due to the merger process has occurred. However, the feature is detected at 3 significance and could simply be the result of blending of the two radiosources B and C at the low resolution of the 325MHz data. Deeper observations would be required to clarify this issue.


7 Polarized emission from the ICM
High-resolution observations were performed in full-polarization mode, as well as 1.425 GHz observations at low resolution. We are thus able to study the polarized emission in a wide range of resolutions, and, at high resolution, in a wide range of frequencies.
7.1 High-resolution images
The relic-filament is located 40′′ ( 260 kpc in projection) SE of the main X-ray peak of the cluster. Its maximal angular extent is 130′′ at 1.4 GHz, corresponding to 830 kpc at the cluster redshift, and its orientation is 30∘. Its flux density (excluding the region covered by source A) is 83 mJy at 1.365 GHz, and 16 mJy at 4.885 GHz.
The relic-filament is polarized at all of the observed frequencies. Its mean fractional polarization is 8% at 1.365 GHz and increases to 17% at 4.885 GHz. These values are consistent with those found in other relics, as well as with the values found in the filament of the radio halo in Abell 2255 (Govoni et al. 2005). In Fig. 3 the E-vectors at 1.365 and 4.885 GHz are shown. We note that the polarization of the relic-filament is not uniform. Its northern part is strongly depolarized at 1.365 GHz. Its mean fractional polarization is a few percent at 1.365 GHz and increases to 20% at 4.885 GHz. Depolarization between 1.365 and 4.885 GHz also occurs in the southern part, as expected, but is less dramatic (the mean fractional polarization is 9% at 1.365 GHz and 16% at 4.885 GHz).
7.2 Low-resolution images
In order to reveal any extended emission from the radio halo, an image
was produced using a Gaussian taper to down weight long-baseline data
points in the UV plane. The image was then restored with a Gaussian
beam of FWHM 2118′′ (see Fig. 2).
In order to investigate the presence of polarized emission from the
radio halo we produced Stokes Q and U radio images following the same
technique. We then derived the polarization angle image and the
polarization intensity image without imposing any cut. From the
polarization intensity image we derived the fractional polarization
image by dividing the polarization intensity image to the total
intensity image, and we considered as valid pixels those whose
signal-to-noise ratio was 3, and 5 in the output image. The cut
on the final image, done on the basis of the signal-to-noise ratio, is
done to get rid of possible spurious polarization. The resulting
images are shown in Fig. 4. From them we can gather
that there is a detection of polarization in the halo, mostly
concentrated in one region in the center, and also strong at the
edges, though this becomes weaker when the cut on the fractional
polarization images are more severe.
From Fig. 4
we can also gather some indication that the radio emission detected at
high resolution and previously classified as relic is likely a
polarized filament belonging to the radio halo. We note, in fact that
the polarized structure as revealed from the polarization vectors does
not show any jump between the relic and the more extended part, but
instead the E-vectors trace with continuity the brightest part of the
radio halo. We refer, for comparison to the case of Abell 2256 (Clarke
& Ensslin 2006). Here the polarized emission image marks a clear and
sharp distinction between the radio halo and the radio relic. Thus, we
report the polarization percentage values of the whole ICM emission
(excluding only the contribution of source A). The mean polarization
percentage at 1.425 GHz is 2-7%, (3-5 detection) with
lower value in the central part of the halo, that is 0.01-0.6%
(3-5 detection) and higher values at the edges, where it
reaches a maximum value of 24-34% (3-5 detection).
We note that values reported here based on low-resolution
observations might be affected by beam depolarization. Indeed,
small-scale variations of the magnetic-field orientation are evident
from high-resolution images (see Fig. 3). At 20 cm we
get 1 radian of rotation for a RM of 25 rad (see
Eq. 2), thus for a 20′′ beam the RM gradient is about 1
rad to cause cancellation within the beam, and any
reasonable ICM model could produce this. Therefore the mean
polarization percentages should be considered lower limits.
8 Rotation Measures
Since synchrotron radiation is linearly polarized, its interaction with the magnetized ICM results in a rotation of the wave polarization plane, called Faraday Rotation. If the radiation passes through an external screen, the observed polarization angle at a wavelength is related to the intrinsic one by the relation
| (2) |
Here RM is the Rotation Measure, which is related to the gas density and to the magnetic field intensity along the line of sight according to:
| (3) |
The situation in this cluster could however be much more complicated
that the drawn picture. If radiation is strongly affected by beam
depolarization, or if the Faraday rotation is internal,
Eq. 2 is not applicable (see Burn 1966). The large
frequency range of our observations allows us to test whether a simple
linear fit of the polarization angle versus is consistent
with our data.
8.1 Rotation Measure fits
We performed a fit of the polarization angle images as a function of
for the relic-filament, and for the sources B and C. We
used the PACERMAN algorithm (Polarization Angle CorrEcting Rotation
Measure ANalysis) developed by Dolag et al. (2005). The algorithm
solves the n ambiguity in low signal-to-noise regions exploiting
the information of nearby reference pixels, under the assumption that
the reference pixel is connected to the nearby areas as far as the
polarization angle gradient is under a certain threshold in all of the
observed frequency maps simultaneously. We considered as reference
pixel those which have a polarization angle uncertainty smaller than 7
degrees, and fixed the gradient threshold to 15 degrees. 7 degree
error of the polarization angle corresponds to 3 level in both
U and Q polarization maps simultaneously.
We note that some regions
show a high polarized flux at 6cm while they are weakly polarized at
20cm. This could indicate that the Faraday rotation is higher in these
regions, leading to higher depolarization in lower frequency
observations. Excluding these regions would correspond to a bias
toward low RM regions. So we decided to allow PACERMAN to perform the
RM fit if at least in 3 frequency maps the above mentioned conditions
were satisfied.
Once the RM image is obtained, the galactic
contribution to the observed RM must be subtracted. We computed the
average RM for extragalactic sources from the catalog published by
Simard-Normandin et al. (1981). The cluster’s galactic coordinates
are: lon and lat. It results that in
a region of 1515∘ centered on the cluster the
Galactic contribution is . This value is also
consistent with the that we find in our
observations for the foreground galaxy F located at ,
(J2000). Its is
15, with values going from -3 to 28.
| Name | Fit error (average) | N of beams | ||
| rad/m2 | rad/m2 | rad/m2 | ||
| Source B | -130 | -312 | 1 | 3 |
| Source C | 85 | 204 | 1 | 3 |
| Col. 1: Source name ; Col 2: observed ; | ||||
| Col 3: in the cluster rest frame; | ||||
| Col. 4: fit error; Col 5: number of sampled beams | ||||
8.1.1 RM fit in the relic-filament region
From the existing data we can only derive the position of the relic-filament in projection, but not where it lies with respect to MACS J0717 along the line of sight. It could be a foreground structure (case 1), a background structure (case 2) seen in projection, or a bright part of the radio halo neither behind or in front of the cluster (case 3). The polarization properties and the trend of the polarization angle versus can help in distinguish among these three situations, and we will discuss them in the following.
-
•
Case 1:our galaxy acts like a Faraday screen, similarly to what we observe for the foreground source F, so we expect to obtain RM 10s rad/m2.
-
•
Case 2: the ICM acts like a Faraday screen and the polarization angle rotates following Eq. 2.
-
•
Case 3: in this case the situation is much more complicated. The trend of versus may result from complex geometries (see Burns 1966). In this case the rotation does not originate in an external Faraday screen, Eq. 2 does not hold anymore, and obtaining information about the magnetic field from Faraday rotation requires detailed knowledge of the ICM distribution and properties.
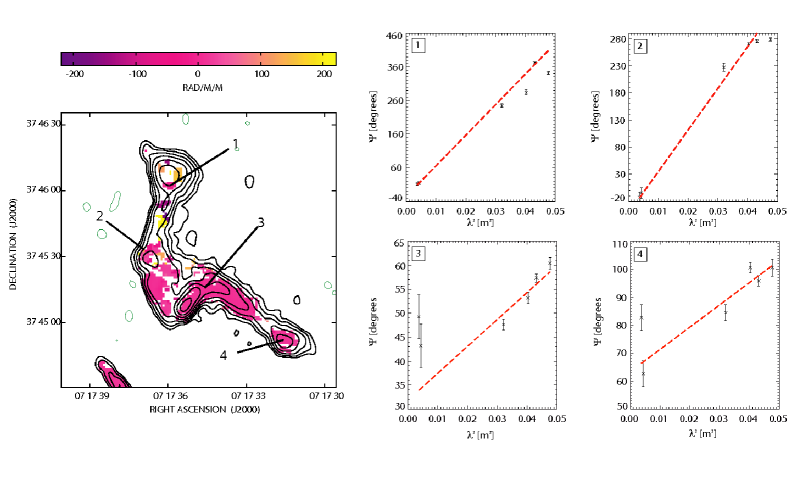
In Fig. 5 we show fits of versus obtained in the relic-filament region. The poor agreement between the data and the simple linear model suggests that the Faraday rotation is not occurring in a Faraday screen, thus favouring scenario (3) above. The observed trends of versus are also incompatible with internal Faraday rotation generated by a uniform slab (see Burn 1966). Although strong beam depolarization could affect the trend of versus , present data favour the third scenario and suggest that the relic-filament is actually a polarized filament belonging to the radio halo and not a radio relic connected to a peripheral merging shock.
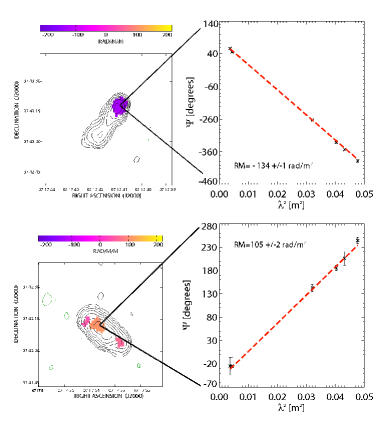
8.1.2 RM fit for the sources B and C
In Fig. 6 we show the RM image and plots of versus obtained with PACERMAN for the two radio sources B and C. The fits shown confirm that, as expected, the RM observed here is due to an external Faraday screen. In Table 3 we report the observed RM for these sources () and the RM in the cluster rest frame (), that is given by . Once the Galactic contribution is subtracted, we obtain values of –3121 rad/m2 and 2041 rad/m2 for sources B and C, respectively. As source C is associated with the BCG of a satellite cluster embedded in the large-scale filament and visible in the X-ray image, its RM is representative of the properties of that cluster. There is no obvious concentration of X-ray emission around source B, which is also located along the optical and X-ray large-scale filament, but still within the virial radius of MACS J0717 proper. A crude estimate of the gas density here is 71 10-4 cm-3. Deriving the magnetic field from RM using Eq. 3 requires knowledge of the correlation-length scale () of the magnetic field (see Murgia et al. 2004). The expectation value of the RM is in fact:
| (4) |
We have then to make some assumptions on , and to fix the limits of the integral in eq. 4. If we assume that both gas and magnetic field are uniform on a scale 1 Mpc (i.e. the projected distance from B to the center of the main cluster), and that Mpc as well, we derive 0.5G. This value should be considered a lower limit to the magnetic field strength. In fact, if we assume kpc (the aproximate linear extent of source B), we obtain 1.2 G. Although these estimates rely on several assumptions, the values of both the RM and of the magnetic field obtained are still higher than what has been observed previously in sources located at such large distances from the cluster center (see e.g. Clarke et al. 2004). Our findings thus indicate that the magnetic field has already been amplified in these regions, possibly by energetic phenomena associated with the complex merging history of this cluster.
9 Spectral index analysis
The analysis of the spectral index is useful to determine the
energetic spectrum of the emitting particles. In fact, it is well
known that if the emitting particle energy distribution follows a
power law the radio synchrotron spectrum
will result to be a power law as well ,
with .
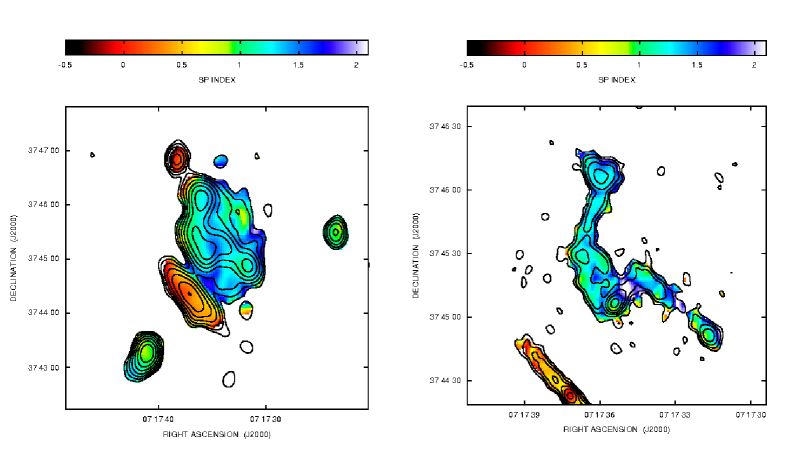
We derived the spectral index image by
comparing the high resolution images at 1.365 and 4.885 GHz and the
low resolution images at 1.425 and 4.860 GHz. Spectral index images
are shown in Fig. 7. They were obtained considering only
pixels whose brightness is 3 at both frequencies. Images
at the same resolution were obtained using the same UV-range in order
to avoid any effect due to their different sensitivity to the large
angular structure.
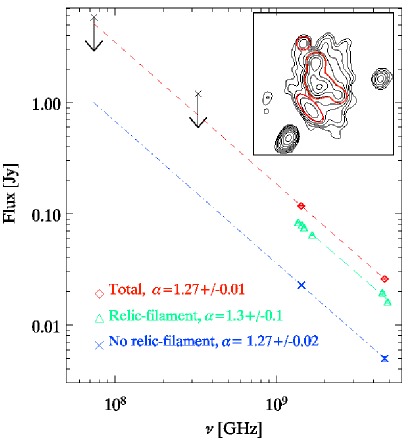
We computed the global spectral index of the
relic-filament by fitting the integrated brightness as a function of
the frequency as:
| (5) |
We obtained for the relic-filament, from high
resolution images, 1.270.02 for the radio halo once both the
relic-filament and the embedded sources are masked, and 1.270.01
for the entire diffuse radio emission (i. e. masking the embedded
sources only). The fits are shown in Fig. 8. We have
to consider here that the halo emission observed at 4.680 GHz is
likely affected by the Sunayev-Zeldovich effect, that causes a
decrement of the radio emission at 4.860 GHz and consequently a
steepening of the spectral index (see e. g. Liang et al. 2000).
The
analysis performed in the previous Secs. indicates that the high
resolution emission previously classified as relic is likely a bright
region connected with the radio halo itself, rather than a peripheral
radio relic. Also the spectral index analysis agrees with this
hypothesis since the spectral index of the relic-filament alone, of
the halo once the relic-filament is masked and of the entire ICM radio
emission has the same value.
The analysis of the spectral index
profile in the relic-filament offers another possibility to check this
hypothesis. The spectral index study of radio relics has been
performed so far on some clusters (see e. g. A2256, Clarke & Ensslin
2006; A3667, Roettgering et al. 1997; A2744, Orrú et al. 2007; A521,
Giacintucci et al. 2008; A2345 and A1240, Bonafede et al. 2009), and
all of the present theoretical models require the presence of a shock
wave that either accelerates the particles from the thermal pool to
relativistic energies (Ensslin et al. 1998; Roettiger et al. 1999;
Hoeft & Brueggen 2007) or compresses a region containing fossil radio
plasma amplifying the magnetic field and re-energizing the particles
so that they can emit radio wave again (Ensslin & Gopal-Krishna
2001). In both of these cases a spectral steepening across the relic
main axis is expected if the relic is seen edge-on. The particles
accelerated or energized by the shock wave lose rapidly their energy
because of the combined effect of synchrotron and Inverse-Compton
losses. Their particle energy spectrum will thus steepen rapidly
giving rise to a radio spectrum that progressively steepens with the
distance from the current location of the shock.
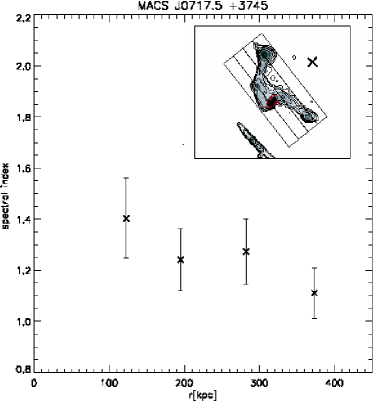
In order to
investigate the presence of such a systematic trend, we integrated the
radio brightness at each frequency () in boxes of
15′′ in width. The associated error is then given by
, with being
the rms noise of the radio image, and Nbeams the number of beams
sampled in each box. The boxes are parallel to the relic main axis,
and are shown in the inset of Fig. 9. The spectral
index in each box was computed by fitting Eq. 5.
The
value of goes from 1.40.2 in the inner box to
1.10.1 in the outer box, with values of 1.2 0.1 and
1.30.1 in the internal boxes. Its trend does not show a clear
progressive steepening as in the case of the other relics cited
above. Although we cannot exclude that this is due to ad-hoc
projection effects, this result agrees with the hypothesis that the
relic-filament is part of the more extended emission that is detected
with low resolution observations, i.e. it is a bright filament
belonging to the radio halo itself.
Thus, in the following analysis we
will consider the flux emitted by the whole extended structure (low
resolution emission +relic-filament), excluding only the contribution
of the embedded sources. We will refer to this whole emission as
halo.
| Freq | Beam | Flux | LLS |
|---|---|---|---|
| GHz | mJy | Mpc | |
| 1.425 | 2118 | 1185 | 1.5 |
| 4.860 | 1814 | 261 | 1.0 |
| 0.325 | 8454 | 1.20.5103 | 1.8 |
| 0.740 | 8080 | 5.80.6103 | 1.3 |
9.1 Spectral index of the radio halo
The total flux of the radio halo at 1.425 GHz and at 4.680 GHz are
118 mJy and 26 mJy respectively. This makes MACS J0717
the most powerful radio halo ever observed. Its radio luminosity at
1.425 GHz, once the k-correction is accounted for, is in fact
1.61026 W.
The total flux have
been computed over the same area, excluding the regions where the
embedded sources are present, so that these values underestimate the
total flux of the radio halo and should be regarded as indicative
estimates. Due to the low resolution of both the VLSS and the WENSS
radio images, it is not possible to resolve the halo and the embedded
sources as different radio components, so that the radio flux measured
in those images can just be considered as upper limits to the halo
spectrum. In Fig. 8 the flux density at the different
frequencies are shown. 74 MHz and 325 MHz limits are consistent with
the spectral index derived from the 1.425 and 4.680 GHz images.
The
distribution of the spectral index is an important observable in
a radio halo, since it depends on the shape of the electron spectrum
and on the magnetic field in which they emit. Regions of flatter
spectra indicate the presence of more energetic particles and/or
higher value of the magnetic field strength. A systematic variation of
the radio halo spectral index with radial distance from the cluster
center is predicted by re-acceleration models (see e. g. Brunetti et
al. 2001). In the re-acceleration scenario, in fact, particles are
accelerated up to a maximum energy that is given by the balance
between acceleration efficiency and energy losses. This results in a
break in the spectrum emitted by these electrons. The break frequency
depends on the acceleration efficiency and on the magnetic field
strength, so that allowing for a decrease of the magnetic field
strength with the radius, (see Sec. 10) a radial
steepening of the radio spectrum is expected, even in the case of a
radial constant acceleration efficiency (see Brunetti et al. 2001,
Brunetti 2003, Feretti et al. 2003 and references therein). This
radial steepening has been observed in some cases (see e. g. Feretti
et al. 2004), while no steepening has been found in Abell 2744 (Orrù
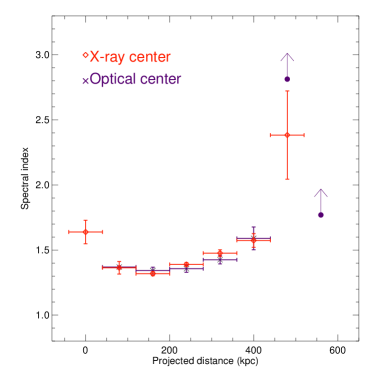
et al. 2006). Here it is tricky to derive such a trend since the
cluster is in a very complex dynamical state. Ma et al. (2009) suggest
that the most massive structure is located at
RA07h17m35′′, DEC37d45′00′′, that is not
coincident with the X-ray brightest region. The halo at 1.425 GHz is
more extended than at 4.680 GHz. In order to take this properly into
account in the spectral index analysis, we integrated the brightness
at 1.425 GHz and at 4.860 GHz in radial shells of 10′′ in
width wherever the 1.4 GHz brightness is . The associated
error is then . In those shells where the
brightness is 3 in the 1.4 GHz image but 3 in
the 4.680 GHz image only lower limits on the mean spectral index can
be derived. We centered these shells on the X-ray cluster center and
on the optical condensation peak. The spectral index profile is shown
in Fig. 10. The flattest spectral index value is
in the shell that is 150 projected kpc from either the X-ray and the
optical center. Higher values of are found in the shells with
radial distances 150 kpc and 200 kpc. A radial steepening is
thus detected centered on this point.
9.1.1 Spectral index - X-ray emission
Radio properties of radio halos are linked to the properties of the
host cluster. This is directly demonstrated by several correlations
that have been found between the radio power and the cluster X-ray
luminosity (Bacchi et al. 2003), between the radio power and the
thermal gas temperature (Liang et al. 2000), between the radio power
and the total cluster mass (Govoni et al. 2001) and between the radio
spectral index and the thermal gas temperature (Feretti et al. 2004;
Orrù et al. 2006). Recently, Giovannini et al. (in prep) have
obtained a correlation between the radio halo integrated spectral
index and the average X-ray gas temperature for a large sample of
nearby radio halos. According to this correlation cold clusters (T
8 KeV) show steep radio spectra (average spectral index = 1.7), while
hot clusters (T 10 KeV) show an average spectral index = 1.1
1.2. The radio spectrum of present radio halo with 1.27
confirms that flatter spectra are present in high temperature merging
clusters.
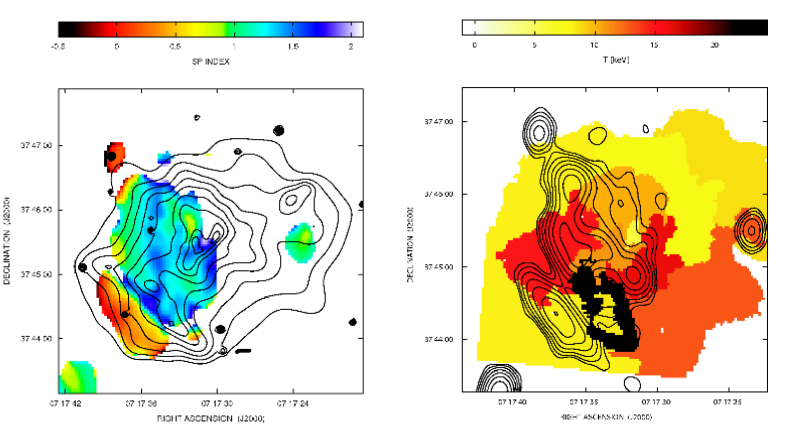
A spatial comparison of the spectral index image and the
X-ray brightness image is shown in the left panel of
Fig. 11. There is no clear correlation between the radio
halo spectral index and the X-ray emission. We note however that a
quite flat spectral feature is present in the NW region of the radio
halo, close to one of the X-ray peaks. With the help of the
temperature map (kindly supplied by C.J. Ma), we further investigate
the anti-correlation between the spectral index of the radio halo and
the ICM temperature. It is expected that flat spectrum regions have
higher temperature, since a fraction of the gravitational energy,
dissipated during mergers in heating thermal plasma, is converted into
re-acceleration of relativistic particles and amplification of the
magnetic field. In the right panel of Fig. 11 the
temperature map is shown (Ma et al. 2009). A flatter region is
detected in the NW part of the radio halo, where the mean temperature
is 10.22.4 keV (Ma et al. 2009). However, in general, it is
difficult to match the patchiness morphology of the temperature map
with the spectral index map.
We also investigate the
anti-correlation between the ICM temperature and the radio spectral
index by computing the spectral index value in regions selected on the
basis of their temperature. We used the temperature map obtained after
the re-binning process (bottom panel of Fig. 2 in Ma et al, 2009). In
Fig. 12 the temperature versus the spectral index is
shown. We note that the coldest region is also characterized by the
most steep spectrum, but in general from this plot we can gather that
a correlation, if present, is weak in this cluster. We argue that it is
due to projection effects.

10 ICM magnetic field
The radio analysis performed so far can give important information
about the magnetic field in this cluster.
Under the assumption that
a radio source is in a minimum energy condition it is possible to
derive an average estimate of the magnetic field strength in the
emitting volume. We indicate with the emitting particle
Lorentz factor. The synchrotron luminosity is calculated from a
low-energy cut-off of and
is assumed. We assume that the emitting
particle energy distribution is well represented by a power-law
with in this energy
range. The volume of the halo is represented by an ellipsoid having
the major and minor axis equal to the maximum and minimum linear
extension of the relic, i. e. 1500 kpc and 1200 kpc
respectively, and the third axis is assumed to be the mean between
the major and the minor one. Under the assumption that magnetic field
and relativistic particles fill the whole volume of the source and
that the energy content in protons is the same as the one in electrons
we find that the equipartition magnetic field is 1.2 G, in
agreement with other values found in the literature.222Standard
equipartition estimate, i. e. obtained computing the radio
synchrotron luminosity in a fixed range of frequency (10 MHz - 10
GHz) would give 0.6G. We report this value to
compare this estimate with other given in the literature for other
radio-sources. However it has been pointed out by Brunetti et
al. (1997) that this approach is not self-consistent since electron
energy corresponding to a fixed frequency depends on the magnetic
field value.
Under equipartition conditions, if we assume that
is constant with cluster radius we obtain that
| (6) |
where is the synchrotron emissivity at the frequency ,
B is the magnetic field modulus and is the slope of the
particle energy distribution.
We used the deprojected brightness
profile of the radio halo at 1.425 GHz and computed the equipartition
magnetic field radial profile. This is shown in
Fig.13. The deprojected brightness profile was
computed assuming spherical symmetry with respect to the radio peak
brightness. The equipartition magnetic field decreases by a factor
2.5 from the center to the periphery of the cluster. If the
cluster magnetic field decreases with radius as:
| (7) |
it is possible to reproduce the equipartition magnetic field profile
assuming , i.e. assuming that the magnetic field profile
scales as the gas density profile. Once is fixed, it is
possible to derive the value of necessary to reproduce the
magnetic field equipartition estimate. We obtain that 3 G
averaged over the halo emitting volume ( 1.1 Mpc3) can
reproduce the equipartition magnetic field estimate.
The detection
of polarized emission reveals important information about the magnetic
field structure in this cluster. Radio halos are intrinsically
polarized, since the synchrotron process generates linearly polarized
emission. However, in the ICM the emitting plasma is mixed with the
thermal one, so due to the Faraday Rotation significant depolarization
may occur. Moreover, radio halos have a low surface brightness, and
high resolution observations are often unable to detect them; if the
magnetic field is tangled on scales smaller than the beam size, the
observed emission will be further depolarized (beam
depolarization). These two effects can explain why polarized emission
from radio halos is usually non-detected.
The presence of polarized
emission here indicates that the magnetic field fluctuates on scales
as large as the beam, that is 130 kpc. Murgia et al. (2004) have
demonstrated that if the magnetic field power spectrum333The
magnetic field power spectrum is modelled as
, where is the
fluctuation scale in the real space and n is the power spectrum
spectral index is steep enough (n3) and the outer scale of the
magnetic field fluctuation is larger than few hundreds kpc, it is
possible to detect polarized emission from radio halos.
Radio halos
are expected to be generated by re-acceleration of particles by Fermi
II processes that occur in the ICM after merger events (see
e. g. Cassano & Brunetti, 2005; Cassano, Brunetti & Setti, 2006).
The energy is injected at large spatial scales and then a turbulent
cascade is generated. This cascade converts the energy into motions at
smaller and smaller scales until the dissipation scale is reached. The
analysis performed on this cluster suggests that it could be in a
young phase after the merger. The magnetic field is thus still ordered
on sufficient large scale and its polarized emission can be detected
even with low resolution observations.

11 Conclusions
The main result of this work is the discovery of a giant radio halo in a massive galaxy cluster at z0.55. The radio halo of MACS J0717 is the most distant radio halo ever observed and the most powerful one. Moreover, it is only the second halo for which polarized emission has been detected. We here summarize the results of our analysis:
-
•
The cluster MACS J0717+3745 shows a complex radio morphology that reflects the complex dynamical state revealed by X-rays and optical studies.
-
•
A powerful radio halo has been observed, emission from which is detected here for the first time at 1.425 and 4.680 GHz. With a radio power of 1.61026 W at 1.4 GHz, it is the most powerful radio halo ever observed. Its spectral index is steep (1.27), in agreement with results obtained for other radio halos found at lower redshifts. Our detection of diffuse radio emission from MACS J0717 at indicates that the ICM is already magnetized at this redshift.
-
•
We argue that the bright radio emission visible in high-resolution images and previously classified as relic is more likely a bright, polarized filament connected with the radio halo. This feature, in fat, lies at the center of the cluster and of the radio halo. The trend of the polarization angle versus indicates that the Faraday rotation originates in a region where a morphologically complex mix of thermal and non-thermal gas is present, resulting in a poor match both with the law expected in the case of a Faraday screen and with the simplified model expected in the case of a uniform slab. Although the effects of depolarization cannot be taken into account trivially, we find the most plausible scenario to be one in which this filamentary emission is embedded in the central cluster region. The radio emission from this filamentarye structure is polarized at 8% at 1.365 GHz and 17% at 4.885 GHz, and the polarization image does not show any discontinuity between the radio halo and this relic-filament structure. The spectral-index profile further reinforces our interpretation since no clear steepening is observed across the main axis, as would be expected if the emission were caused by a peripheral shock wave. We also note that the mean spectral index of the relic-filament and of the radio halo are fully compatible within the small errors.
-
•
Low-resolution polarization observations at 1.425 GHz have shown that the polarized emission is not confined to the bright relic-filament observed at high resolution but extends to the innermost regions of the radio halo and to some regions in the outskirts. Following Murgia et al. (2004), this indicates that the power spectrum of the magnetic field is steep in this cluster, with a spectral index n3, and that it must fluctuate on scales as large as 130 kpc.
-
•
Under the equipartition assumption, we derived the magnetic-field profile of the radio halo and found it consistent with predictions based on the assumption that the magnetic-field profile scales as the gas-density profile. Once the radial decline is fixed, a central value of 3G can also account for the magnetic-field equipartition estimate.
Acknowledgements We thank C.J. Ma for providing the ICM temperature map for MACS J0717, and A. Mantz for helpful comments. We thank the anonymous referee for useful comments. GG is a postdoctoral researcher of the FWO-Vlaanderen (Belgium). HE gratefully acknowledges financial support from SAO and STScI under grants GO3-4168X and GO-09722/GO-10420, respectively. NRAO is a facility of the National Science Foundation, operated under cooperative agreement by Associated Universities, Inc. This work was partly supported by the Italian Space Agency (ASI), contract I/088/06/0, by the Italian Ministry for University and Research (MIUR) and by the Italian National Institute for Astrophysics (INAF). This research has made use of the NASA/IPAC Extragalactic Data Base (NED) which is operated by the JPL, California Institute of Technology, under contract with the National Aeronautics and Space Administration. We acknowledge the WENSS team (http://www.astron.nl/wow/testcode.php)
References
- Bacchi et al. (2003) Bacchi M., Feretti L., Giovannini G., Govoni F., 2003, A&A, 400, 465
- Becker, White, & Helfand (1995) Becker R. H., White R. L., Helfand D. J., 1995, ApJ, 450, 559
- Bonafede et al. (2009) Bonafede A., Giovannini G., Feretti L., Govoni F., Murgia M., 2009, A&A, 494, 429
- Brunetti, Setti, & Comastri (1997) Brunetti G., Setti G., Comastri A., 1997, A&A, 325, 898
- Brunetti et al. (2001) Brunetti G., Setti G., Feretti L., Giovannini G., 2001, MNRAS, 320, 365
- Brunetti (2003) Brunetti G., 2003, ASPC, 301, 349
- Brunetti et al. (2008) Brunetti G., et al., 2008, Natur, 455, 944
- Burn (1966) Burn B. J., 1966, MNRAS, 133, 67
- Carilli & Taylor (2002) Carilli C. L., Taylor G. B., 2002, ARA&A, 40, 319
- Cassano & Brunetti (2005) Cassano R., Brunetti G., 2005, MNRAS, 357, 1313
- Cassano, Brunetti, & Setti (2006) Cassano R., Brunetti G., Setti G., 2006, MNRAS, 369, 1577
- Cavaliere & Fusco-Femiano (1976) Cavaliere A., Fusco-Femiano R., 1976, A&A, 49, 137
- Clarke & Ensslin (2006) Clarke T. E., Ensslin T. A., 2006, AJ, 131, 2900
- Clarke (2004) Clarke T. E., 2004, JKAS, 37, 337
- Cohen et al. (2007) Cohen A. S., Lane W. M., Cotton W. D., Kassim N. E., Lazio T. J. W., Perley R. A., Condon J. J., Erickson W. C., 2007, AJ, 134, 1245
- Dolag, Vogt, & Enßlin (2005) Dolag K., Vogt C., Enßlin T. A., 2005, MNRAS, 358, 726
- Dolag, Bykov, & Diaferio (2008) Dolag K., Bykov A. M., Diaferio A., 2008, SSRv, 134, 311
- Dolag & Stasyszyn (2008) Dolag K., Stasyszyn F. A., 2008, arXiv, arXiv:0807.3553
- Donnert et al. (2009) Donnert J., Dolag K., Lesch H., Müller E., 2009, MNRAS, 392, 1008
- Ebeling, Edge, & Henry (2001) Ebeling H., Edge A. C., Henry J. P., 2001, ApJ, 553, 668
- Ebeling, Barrett, & Donovan (2004) Ebeling H., Barrett E., Donovan D., 2004, ApJ, 609, L49
- Ebeling, White, & Rangarajan (2006) Ebeling H., White D. A., Rangarajan F. V. N., 2006, MNRAS, 368, 65
- Ebeling et al. (2007) Ebeling H., Barrett E., Donovan D., Ma C.-J., Edge A. C., van Speybroeck L., 2007, ApJ, 661, L33
- Edge et al. (2003) Edge A. C., Ebeling H., Bremer M., Röttgering H., van Haarlem M. P., Rengelink R., Courtney N. J. D., 2003, MNRAS, 339, 913
- Ensslin et al. (1998) Ensslin T. A., Biermann P. L., Klein U., Kohle S., 1998, A&A, 332, 395
- Enßlin & Gopal-Krishna (2001) Enßlin T. A., Gopal-Krishna, 2001, A&A, 366, 26
- Feretti et al. (1995) Feretti L., Dallacasa D., Giovannini G., Tagliani A., 1995, A&A, 302, 680
- Feretti (2003) Feretti L., 2003, ASPC, 301, 143
- Feretti et al. (2004) Feretti L., Orrù E., Brunetti G., Giovannini G., Kassim N., Setti G., 2004, A&A, 423, 111
- Ferrari et al. (2008) Ferrari C., Govoni F., Schindler S., Bykov A. M., Rephaeli Y., 2008, SSRv, 134, 93
- Giacintucci et al. (2008) Giacintucci S., et al., 2008, A&A, 486, 347
- Giovannini & Feretti (2000) Giovannini G., Feretti L., 2000, NewA, 5, 335
- Govoni et al. (2001) Govoni F., Feretti L., Giovannini G., Böhringer H., Reiprich T. H., Murgia M., 2001, A&A, 376, 803
- Govoni & Feretti (2004) Govoni F., Feretti L., 2004, IJMPD, 13, 1549 ]
- Govoni et al. (2005) Govoni F., Murgia M., Feretti L., Giovannini G., Dallacasa D., Taylor G. B., 2005, A&A, 430, L5
- Govoni et al. (2006) Govoni F., Murgia M., Feretti L., Giovannini G., Dolag K., Taylor G. B., 2006, A&A, 460, 425
- Hoeft & Brüggen (2007) Hoeft M., Brüggen M., 2007, MNRAS, 375, 77
- Johnston-Hollitt & Ekers (2004) Johnston-Hollitt M., Ekers R. D., 2004, astro, arXiv:astro-ph/0411045
- Kim, Kronberg, & Tribble (1991) Kim K.-T., Kronberg P. P., Tribble P. C., 1991, ApJ, 379, 80
- Liang et al. (2000) Liang H., Hunstead R. W., Birkinshaw M., Andreani P., 2000, ApJ, 544, 686
- Ma et al. (2008) Ma C.-J., Ebeling H., Donovan D., Barrett E., 2008, ApJ, 684, 160
- Ma, Ebeling, & Barrett (2009) Ma C.-J., Ebeling H., Barrett E., 2009, ApJ, 693, L56
- Murgia et al. (2004) Murgia M., Govoni F., Feretti L., Giovannini G., Dallacasa D., Fanti R., Taylor G. B., Dolag K., 2004, A&A, 424, 429
- Orrú et al. (2007) Orrú E., Murgia M., Feretti L., Govoni F., Brunetti G., Giovannini G., Girardi M., Setti G., 2007, A&A, 467, 943
- Rengelink et al. (1997) Rengelink R. B., Tang Y., de Bruyn A. G., Miley G. K., Bremer M. N., Roettgering H. J. A., Bremer M. A. R., 1997, A&AS, 124, 259
- Rottgering et al. (1997) Rottgering H. J. A., Wieringa M. H., Hunstead R. W., Ekers R. D., 1997, MNRAS, 290, 577
- Roettiger, Burns, & Stone (1999) Roettiger K., Burns J. O., Stone J. M., 1999, ApJ, 518, 603
- Simard-Normandin, Kronberg, & Button (1981) Simard-Normandin M., Kronberg P. P., Button S., 1981, ApJS, 45, 97
- Taylor & Perley (1993) Taylor G. B., Perley R. A., 1993, ApJ, 416, 554
- Taylor, Fabian, & Allen (2002) Taylor G. B., Fabian A. C., Allen S. W., 2002, MNRAS, 334, 769
- Werner et al. (2008) Werner N., Finoguenov A., Kaastra J. S., Simionescu A., Dietrich J. P., Vink J., Böhringer H., 2008, A&A, 482, L29