Mid-UV Narrow-Band Indices of Evolved Simple Stellar Populations
Abstract
We explore the properties of selected mid-ultraviolet (1900–3200 Å) spectroscopic indices of simple stellar populations (SSPs). We incorporate the high resolution UVBLUE stellar spectral library into an evolutionary population synthesis code, based on the most recent Padova isochrones. We analyze the trends of UV indices with respect to age and chemical composition. As a first test against observations, we compare our results with the empirical mid-UV spectral indices of Galactic globular clusters, observed with the International Ultraviolet Explorer (IUE).
We find that synthetic indices exhibit a variety of properties, the main one being the slight age sensitivity of most of them for ages 2 Gyr. However, for high metallicity, two indices, Fe ii 2332 and Fe ii 2402, display a remarkably different pattern, with a sharp increase within the first two Gyr and, thereafter, a rapid decline. These indices clearly mark the presence of young (1 Gyr) metal rich () stellar populations.
We complement existing UV indices of Galactic globular clusters with new measurements, and carefully identify a sub-sample of ten indices suitable for comparison with theoretical models. The comparison shows a fair agreement and, in particular, the strong trend of the indices with metallicity is well reproduced.
We also discuss the main improvements that should be considered in future modelling concerning, among others, the effects of -enhancement in the spectral energy distributions.
1 Introduction
This is the third paper of a series devoted to the analysis of the ultraviolet (UV) morphology of intermediate and late type stars and evolved stellar populations. In the first paper (Rodríguez-Merino et al., 2005, hereafter Paper I), we presented the UVBLUE library of synthetic stellar spectra at high resolution and provided its potential usefulness and limitations, when applied to complement empirical data in the analysis of stellar spectra. In a second paper (Chavez et al., 2007, hereafter Paper II), we applied UVBLUE to the detailed analysis of a set of 17 mid-UV spectroscopic indices in terms of the main atmospheric parameters: effective temperature, surface gravity, and metallicity. This study also included the comparison of synthetic indices with those measured in IUE spectra of a sample of main sequence stars. The global result was that, with UVBLUE properly degraded to match the resolution of IUE (6 Å), eleven synthetic indices (absorption or continuum) either well reproduced the observations or could be easily transformed to the IUE system. In this work, we further extend the investigation to the simplest aged stellar aggregates: the globular clusters.
Globular clusters represent the classical test bench for any population synthesis approach of the analysis of larger stellar aggregates in the local as well as the distant universe (Schiavon, 2007). They are commonly considered the prototypes of a coeval, chemically homogeneous stellar population, and are used to build up the properties of elliptical galaxies. Although the integrated ultraviolet light of globulars has been extensively analyzed, the study of their UV morphology has not yet been fully exploited spectroscopically through the analysis of their absorption indices (Fanelli et al., 1990, 1992). This analysis provides numerous advantages over the full UV spectral energy distribution (SED), since indices are easily calculated and generally defined in narrow bands, diminishing substantially the effects of interstellar reddening and flux calibration. Chemical species can be examined separatedly, at least on those indices dominated by a single atom (i.e., no blends).
Over the past decade Fanelli’s et al. absorption indices have been incorporated in a variety of analyses. Ponder et al. (1998), for instance, analyzed a sample of four globular clusters in M31 and six elliptical galaxies observed with the Faint Object Spectrograph on board the Hubble Space Telescope. They compare these data, in the form of colors and line indices, with a sample of Galactic stars, Milky Way globular clusters, and the integrated UV spectrum of M32. They found that Milky Way systems, clusters in M31, and elliptical galaxies conform three distinct stellar populations. Almost contemporarily, Rose & Deng (1999) carried out a detailed comparative analysis of M32 and NGC 104 (47 Tuc) aimed at constraining the stellar content of M32. In view of the chemical similarities (both nearly solar) they modelled the UV spectral indices of M32 on the basis of the better studied Galactic stellar system, in terms of its leading parameters (age and metallicity). In spite of their compatible chemical composition, they found that, while spectroscopic indices of NGC 104 can be interpreted in terms of a dominant main sequence (turn-off) and various contributions of other stellar types, in particular red objects in the horizontal branch (HB), M32 requires a significantly more metal rich turn-off (TO) and a more important contribution of stars of type A, likely consistent with the observed paucity of post-asymptotic giant branch stars (Bertola et al., 1995; Brown et al., 2008). More recently, Lotz et al. (2000) conducted an analysis of the effects of age and chemical composition on the integrated spectra of simple populations modelled with population synthesis techniques. They tested and used as ingredients the library of theoretical fluxes by Kurucz (1993) and a modified set of the isochrones of Bertelli et al. (1994); they found that, within the limitations of Kurucz’s low resolution SEDs (see Paper II), which appeared to faithfully reproduce the stellar indices BL 2538 and S2850, simple population models adequately match the mid-UV morphology of mean globular groups (Bonatto et al., 1995). However, they failed to match the mid-UV indices of galaxies, ascribing the discrepancies, among other possible agents, to the presence of a hot stellar component [e.g., blue straggler stars (BS)] and a mixture of metal-poor objects (and a metal-rich young population, as in the case of M32).
It is fair to mention that the above cited papers provide some of the main drivers of the analysis presented in this paper: a)- Galactic globular clusters (GGCs) has represented, with a few exceptions, the best reliable set of single generation populations, therefore, any stellar population modelling should be tested against the observed integrated properties of globulars; b)- current empirical stellar libraries still present a marked paucity in the parameter space, particularly in chemical composition. Such a deficiency has been managed with the use of either grids of theoretical spectra (Lotz et al., 2000) or by extending the stellar database with a set of stellar spectra of metal-rich stars with fiducial chemical compositions (Rose & Deng, 1999). Nonetheless, it was until recently that theoretical databases at the appropiate resolution to handle, for instance, IUE spectroscopic data became available. Additionally, it has been suggested that the mid-UV properties of Milky Way systems might not be applicable to the study of extragalactic evolved populations (Ponder et al., 1998). It is therefore imperative that we test theoretical predictions with local globular clusters and establish the necessary corrections, before we can rely on synthetic populations for studying non-local or more complex stellar systems.
Preliminary results on the application of synthesis techniques to the study of the UV morphology of old populations have been already presented in Rodríguez-Merino (2004), Bertone et al. (2007), and Chavez (2009). More recently Maraston et al. (2009) have made use of our previous results to investigate the far-UV and mid-UV indices in young populations with the goal of providing the tools for the study of distant post-starburst galaxies (age 1 Gyr). Being based on the same theoretical and empirical framework, it turns mandatory to at least briefly explain the “added value” of the present analysis. First, this paper extends their analyses to older populations, including the age interval (1–3 Gyr), which incorporates the so far determined (but apparently still rather inconclusive) ages of red galaxies at redshifts around (see, for instance, Spinrad et al., 1997). Second, we provide a comparison with Galactic globular clusters as a tool for quantifying the required corrective factors for the theoretical indices. Third, eventhough we concentrate in “canonical” evolution, we provide, for the first time, hints of the effects of non-solar partitions on the integrated ultraviolet energy distributions of evolved populations. Fourth, we include more indices, some of which appear to more clearly segregate the effects of age and metallicity in old populations.
Aimed at complementing the necessary tools for the study of old populations at UV wavelengths, we present in this paper the calculation of the integrated SEDs of SSPs in the UV spectral interval. We first theoretically explore, in § 2, the properties of integrated spectral features (in the form of spectroscopic and continuum indices) in terms of the main population parameters: metallicity and age. We then look, in § 3, into the empirical correlations between indices and chemical composition in a sample of Galactic globular clusters observed by IUE. In this section we also show the comparison between synthetic and empirical indices. A brief discussion on the agents that could explain discrepancies (and their corrections) is provided in § 4. In § 5 we demonstrate the importance of adopting the suitable element partition in particular in low resolution theoretical fluxes. A summary and conclusions are given in § 6.
2 Synthetic Single Stellar Populations at UV Wavelengths
We have computed new integrated spectra of SSPs following the prescriptions outlined in Bressan et al. (1994) and the later revision by Bressan et al. (1998). The main differences with respect to Bressan et al. (1998) SSPs are summarized below.
In the present paper we incorporate the new Padova isochrones (Bertelli et al., 2008). These isochrones allow the calculation of SSPs with arbitrary chemical compositions, metallicities that range from 0.0001 to 0.07 in the assumption of a solar partition for the heavy elements, and He abundance within reasonable ranges for each metallicity. The asymptotic giant branch (AGB) phase is treated according to Marigo et al. (2008). The new isochrones do not include the post AGB phase and, since this phase is relevant for the UV properties of SSPs, we have added it following Bertelli et al. (1994).
In our calculations we have considered ages from 100 Myr to 16 Gyr and the following chemical compositions: Z=0.05, Y=0.28; Z=0.02, Y=0.28; Z=0.008, Y=0.25; Z=0.004, Y=0.25; Z=0.0004, Y=0.25; Z=0.0001, Y=0.25. The red giant branch (RGB) mass-loss parameter is very relevant for the present paper, because it fixes the stellar masses on the horizontal branch (HB) and, in turn, its hot blue tail. It has been set to =0.50 independently from the metallicity as suggested by Carraro et al. (1996) and, more recently, by van Loon et al. (2008). The same RGB mass-loss parameter has been used to reproduce the mid infrared colours of 47 Tuc and of selected old metal rich ellipticals in the Coma cluster (Clemens et al., 2009).
The youngest populations will not be of any use in the analysis of globular clusters presented in what follows. Nevertheless, their calculation will allow to probe the behavior of metallic features since their very onset, and will certainly be an important ingredient in the planned analysis of composite systems, such as M32, in which a young stellar generation (including A-type stars) might be present.
In computing the integrated SEDs111The full sample of SEDs are available upon request from the author. we have made use of the UVBLUE high-resolution synthetic stellar library222http://www.inaoep.mx/modelos/uvblue.html (Paper I). We have linearly interpolated within the spectral library in order to match the parameters considered for the mass bins along the isochrones.
Four sequences of integrated SEDs of SSPs are shown in panels of Fig. 1. In the upper panels, the sequences illustrate the effects of age in two synthetic populations of [M/H]= and 0.0 dex, whose ages range from 0.1 to 16 Gyr as indicated by the labels on the right. In the lower panels, we portray the effects of chemical composition for two representative old populations of 4 and 12 Gyr. A simple examination of the figure allows us to easily identify changes in many spectral features including faint ones, variations that would have been hidden if we had used a low resolution spectral grid (at, say, 10 Å resolution, as the commonly used Kurucz low resolution database of stellar fluxes). For instance, most of the spectral features (including the Mg ii doublet at 2800 Å) at the metal-poor regime display a slight increase over the age interval 2–14 Gyr, with an apparent turnover at the oldest populations. In contrast, at solar metallicity we clearly see that some features sharply increase up to relatively young ages and then show a shallow decline with age, disappearing at about 12 Gyr. An example of this behaviour is the series of features in the interval 2400–2500 Å (mainly due to Fe i, Fe ii, Ni i, Co i, and Mg i) which are evident all the way to 16 Gyr at low metallicities, but absent in the more metal-rich counterparts. The quantitative measurement of these variations in terms of the leading population parameters (age and chemical composition) is given in the following section.

2.1 The Absorption Spectroscopic Indices
With the set of synthetic SEDs, we have calculated 17 spectroscopic indices, whose definition is given in Paper II; most of them were introduced by Fanelli et al. (1990). The indices measure the absorption of the most prominent features in the mid-UV spectra of intermediate and late-type stars. Briefly, an index is defined through three wavelength bands, with the two side bands defining a pseudo-continuum, which is compared to the flux in the central band pass, very much like the popular Lick indices defined in the optical (e.g., Worthey et al., 1994). For the calculation, we have broadened the synthetic spectra with a Gaussian kernel of FWHM=6 Å to simulate the resolution of IUE in low resolution mode, which has been (an still is) the work horse for comparison with empirical data. This step is important, since we have demostrated that resolution might have non-negligible effects on indices defined with the narrower bands (Paper II).
Another important aspect is that we have, in the purely theoretical approach presented in this section, included also some of the bluer indices. Unlike previous investigations, we opted to include them foreseeing a potential use in the analysis of higher quality data collected by either large optical telescopes (for high redshift objects) or planned spaceborn instruments (Gómez de Castro et al., 2009).
On what follows we present the effects of age and metallicity on each of the 17 indices. Partial results have been already presented in Rodríguez-Merino (2004) and Bertone et al. (2007).
2.1.1 The Effects of Metallicity and Age
Amongst the most important properties of theoretical stellar libraries, such as UVBLUE, is that synthetic stellar SEDs can be computed for just about any combination of stellar parameters, allowing, in turn, the calculation of SSPs for a wide variety of combinations of age and chemical composition. Empirically, previous analyses have coped with incompleteness in the metallicity space, particularly at the metal-rich end, by complementing available data sets with archival UV data and a homogeneous set of chemical compositions (Rose & Deng, 1999). Another possibility, which however will also require a metal-rich stellar library, is to assemble an empirical sequence of more metallic populations. Perhaps, a way to do this task is to extend the chemical composition with the integrated spectra of old open clusters, but, hosting a significantly smaller number of stars, the results would be subject to stocastic processes.

The combined effects of age and chemical composition are displayed in Fig. 2. Taking into account that at ages less than 1 Gyr all the absorption features are diluted by the strong continuum, we may summarize the following behavior:
i) There are indices that sharply increase to their maximum value within the first two Gyr and, thereafter, remain almost constant up to 10 Gyr.
ii) At ages above about 11 Gyr some of the indices in the most metal-rich populations show a more or less pronounced decline. This is particularly evident in the case of and likely reflects a combination of age, metallicity, helium content, and mass-loss parameter that favour the rapid development of a hot horizontal branch. In some cases (e.g., Mg ii 2800, S2850) the index value is comparable to that of very low metallicity populations.
iii) At solar and super-solar metallicities, the two bluer indices, Fe ii 2332 and Fe ii 2402, behave quite differently with respect to the other indices: after a rapid rise (1 Gyr), there is a relatively fast decline, which is steeper for the highest . The distinctive behavior of these two indices can be understood by examining their behavior in stellar data displayed in Fig. 3 of Paper II (see also Fig. 2 of that paper). The stellar patterns are directly reflected in the composite spectra of metal-rich SSPs, whose mid-UV emission is dominated by turn-off stars. In stars, Fe ii 2332 and Fe ii 2402 are the mid-UV indices that reach the maximum at the highest effective temperature. Since they peak at about 7000 K at super-solar metallicity, in a stellar populations the maxima of these indices are expected to take place in systems where turn-off stars are less than 2 Gyr old. A similar reasoning is applicable to the solar chemical composition case. The index peak is decreasing with decreasing metal abundance, therefore in the less metallic populations the maxima are reached at older ages. We have furthermore analyzed the effect of the dominant species in the band passes of the three indices Fe ii 2332, Fe ii 2402, and Fe ii 2609: we found that, whilst in fact ionized Fe has a dominant role in their central band passes, at the same time it also significantly depresses the blue band of Fe ii 2609, making this index to be less sensitive than the bluest two to Fe ii abundance and to effective temperature.
These indices mark the presence of a young metal-rich population, teherfore, might be relevant for the study of high-redshift galaxies and/or to trace rejuvenation episodes in the local old systems.
iv) Finally, another remarkable feature is that, with the exception of the indices mentioned in (iii), the metallicity, not the age, appears to be the main agent regulating the strength of most of the indices, at least in the age interval 2–10 Gyr.
3 UV Indices of Galactic Globular Clusters
In this section, we present the comparison of synthetic indices with those measured in a sample of globular clusters observed by the IUE. The goal of the comparison is two-fold. On the one hand, we want to explore the sensitivity of the indices to metallicity from an empirical point of view, complementing the results of Rose & Deng (1999). On the other hand, we want to test and discuss the capabilities of synthetic SSPs to reproduce what is actually measured in observational data and, therefore, identify fiducial features that can be modelled for the analysis of more complex systems, which, due to the limitations of observed data sets, cannot be studied from a purely empirical perspective.
We have extracted from the IUE-Newly Extracted Spectra (INES) database the images of 27 globular clusters observed with the longwave prime and redundant cameras, large aperture and in low dispersion mode. The sample represents the full set of GGCs observed with IUE, available in the INES data base. The working sample does not consider the cluster NGC 5139 (Omega Cen) and includes four more clusters than in the work of Rose & Deng (1999). The analysis of NGC 5139333There are other GGC in our sample for which a composite main sequence has been identified (e.g. NGC 2808), nevertheless the abundance spread of iron peak elements turns out to be less pronounced that in Omega Cen. will be deferred to an on-going mid-UV study of the sample of early-type galaxies observed by IUE being developed by our group. The unusual (as compared to other globulars) composite nature in age and metallicity (see, e.g., Sollima et al., 2005; Stanford et al., 2006) of NGC 5139 will in fact serve as template for testing combinations of SSPs. The four additional clusters have spectra with a much lower quality than the rest, however, they are still useful in some spectral intervals.
The sample is described in Table 1, where we list the cluster identification, the iron abundance [Fe/H] from Harris (1996), the age mainly from Salaris & Weiss (2002), the horizontal branch ratio444This quantity is defined as HBR = (B-R)/(B+V+R), where B, V, and R are the numbers of blue HB, RR-Lyrae, and red HB stars (Lee, 1990). compiled by Harris (1996), the horizontal branch type according to Dickens (1972), and, in the last column, the additional references for the age not included in Salaris & Weiss (2002). For two clusters, NGC 6388 and NGC 6441, which have been of particular interest, because they represent a typical second parameter case, we were not able to find in the literature age determinations. Based on the evident similarities between NGC 6388 and NGC 104, Catelan et al. (2006) point out that these clusters should be of similar age. Similarly, Caloi & D’Antona (2007) assumed a reference age of 11 Gyr for NGC 6441.
It is worth to mention that sixteen objects have IUE images for which the quality code (ECC) is four, five or six in the first digit. This, in principle, would indicate bonafide data. This quality designation does not guarantee, however, that the full wavelength range is useful. We have to keep in mind that most globulars are instrinsically faint at the shortest wavelengths and that the sensitivity curves for both the LWP and LWR cameras peak at about 2750 Å and significantly degrade in the bluest region as well as in the red, although in this latter region (say at 3000 Å) the instrinsic flux is much larger. These facts have imposed some limitations, which have prevented in most analyses the use of the complete set of indices. For these reasons, we have restricted our study to a subsample of ten indices. The criteria for such a selection is somewhat complicated due to the mixed instrumental effects and stellar theory limitations. However, within the goals of this pioneering comparison between synthetic and empirical integrated indices, we decided to start with indices that accomplish the following criterion: we include narrow line indices, whose full bands are defined in the interval 2400–2950 Å, and broader line and continuum indices in the range 2400–3130 Å, hence excluding the indices Fe ii 2402, Fe i 3000, BL 3096, and 2110/2570. Additionally, we have also excluded the two indices BL 2720 and BL 2740 for which in Paper II we found, respectively, that indices are largely overestimated by UVBLUE-based measurements and that the saturation of empirical indices is not reproduced by UVBLUE. Regarding this latter point, it should be noted that there are other indices that also get saturated (those displaying a hook-like behavior in Fig. 6 of Paper II), nevertheless they differ from BL 2740 in an important aspect: the deviation from the linear correlation in this index takes place at values that would correspond to much younger ages than those expected for GGCs; therefore, age effects will blur any existing correlation with chemical composition and any potential compatibility with synthetic SSPs based on UVBLUE.
Note that we have also left the index Fe ii 2332 in spite of not fulfilling the selection criteria. Though unavoidably affected by the IUE sensitivity constraints, we considered this feature important essentially because the synthetic analysis has shown that the index displays remarkable different behavior with respect to the other indices, turning it into potential tool for breaking the age-metallicity degeneracy (Buzzoni et al., 2009). This index was measured in a restricted sub-sample of objects (15 out of 27), whose images are labelled with high quality codes.
In Table 2, we report the ten selected indices that have been measured after correcting globular spectra for extinction, using the Cardelli et al. (1989) extinction curve, and for radial velocity. The error figures for five indices; namely 2600-3000, 2609/2660, 2828/2923, Mg ii 2800, and Mg i 2852 have been given by Rose & Deng (1999), based upon several images of individual clusters. We have independently estimated through an iterative process the typical error associated with each index. The process consists of randomly adding artificial noise to each original spectrum and computing the index for each iteration. The standard deviation of the resulting (Gaussian) distribution of indices was taken as the error. Our estimates are in agreement with the typical values of Rose & Deng (1999) of 0.03 (and 0.06 for Mg ii 2800), except for Mg Wide and Fe ii 2332 for which we derived 0.01 and 0.05 mag, respectively. Empty entries in Table 2 are index values (mainly negative ones) that have been dropped after a detailed visual evaluation of the quality of spectra in the bands defining each index.
We would like to point out an additional comment on the interstellar extiction. Eventhough we have mentioned that spectroscopic indices do not significantly depend on reddening, some of the indices cover up to 660 Å and, bearing in mind that interstellar extinction dramatically increases at mid-UV and shorter wavelengths, we consider it necessary to correct IUE spectra for the effects of extinction. In fact, we conducted a test in which we measured the set of indices, whose bands are defined at Å in the coadded spectrum (extracted from four IUE images) of the slightly reddened cluster NGC 104. After correcting the spectrum, assuming color excesses in the interval 0.0 to 0.8 mag (at a step of 0.1 mag), which roughly correspond to the values comprised in our cluster sample, we found that effects of interstellar reddening are far from negligible for the indices covering the widest wavelength intervals, in particular Mg Wide. Index variations turned out to be of the order of 10% for an E(B-V) difference of 0.1 mag.
3.1 Globular Cluster Indices vs. Chemical Composition

In Fig. 3, we show the trends of the ten selected indices vs. metallicity for our sample of 27 GGCs. Among the main features are:
a)- All indices steadily increase with increasing chemical composition and display remarkable good correlations, most of them increasing a factor of 5–6 with [Fe/H] increasing from about to dex. In the work of Rose & Deng (1999) the correlation was explored aimed at assessing the adequacy of metal-rich clusters for studying the populations of M32. In addition to their five indices, we found that five more also display a monotonic behavior up to the metal-rich edge of our sample. From the analysis of synthetic populations, we found that this monotonic tendency is, general, continued at super-solar regimes. An exception to this trend is, for instance, the Mg ii 2800), for which the oldest populations present an inflexion and indices decrease towards high metallicities.
b)- It is interesting to note that, while the spread in age to some extent increases the vertical dispersion of the points, age is not the main agent, and the dispersion should be abscribed to other reasons, in particular the UV bright population (stars at the turn-off, hot horizontal branch stars, and blue stragglers). In this line, from an analysis of the Mg ii 2800 index, Rose & Deng (1999) concluded that the observed metallicity-index correlation can be explained by the dependence of the temperature of the TO on metallicity. They also examined the effects of the HB morphology and found no correlation between the dispersion and HB morphology. Such results are confirmed by scrutiny of the panels in Fig. 3 only for low metallicity systems, where no clear tendency is evident. As we shall see in what follows, the presence of extended HBs severely affects some of the indices.
As a supplemental piece of the puzzle, it is noteworthy to mention that there is evidence that enhancement of elements formed by capture of particles is present in globular clusters, reflecting the overall chemical evolution of the Milky Way (Lee & Worthey, 2005; Mendel et al., 2007). In principle, such effects should be taken into account in both the available stellar data sets that include spectra with -enhancement (e.g., Munari et al., 2005) and in the opacities used to construct evolutionary tracks. Whilst the detailed study of the imprints of -element enrichment in mid-UV indices is beyond the scope of this paper, we consider it convenient to present in § 5 a brief analysis.
3.2 Synthetic vs. Empirical Indices
In order to quantitatively compare empirical indices with results from population synthesis techniques, we have initially considered to apply, whenever possible, the transformation coefficients needed to match theoretical and empirical indices of stars as described in Paper II. However, in composite energy distributions, the discussed limitations of the theoretical atmospheric data are hauled together with additional potential drawbacks of their own. Instead, we have conducted a direct comparison of results of the synthesis codes after matching the IUE nominal resolution in low dispersion mode of 6 Å.
In Fig. 3, we have superimposed to the data of globular clusters the synthetic integrated indices for the ages of 10 Gyr (solid line), 12 Gyr (dashed line), and 13 Gyr (dot-dashed line). Only indices for Z=0.0001, Z=0.0004, and Z=0.004 are plotted here, because they span the range of the observed values. It is worth stressing that models are plotted in this diagram with the [Fe/H] values corresponding to the metallicity of the isochrones, derived from the abundances of the atmosphere models. Finally, we remind that the solid circle represents the NGC 6388 and the solid square indicates NGC 6441. These two clusters display quite extended horizontal branches as compared to the other three metal rich clusters (characterized by the presence of a red clump), indicating the possibility of a higher than normal helium content (e.g., Bressan et al., 1994).
Synthetic indices fairly well reproduce the trends of the empirical data. However, in some cases, especially for the lower metallicity clusters, the models tend to overestimate the data. This is particularly evident in the case of BL 2538, Fe ii 2609, 2609/2660, and 2828/2921. We also notice that age differences, at fixed metallicity, are visible only for the highest metallicity bin. In what follows, we give some remarks on groups of indices, while a more global discussion is deferred to § 4.
a)- Fe ii 2332: The overall trend is faithfully reproduced by the synthetic indices. This index is the only case where there is a slight theoretical underestimation of about 0.05 mag.
b)- BL 2538, Fe ii 2609, and 2609/2660: These indices show general offsets, which are about 0.2 mag at the lower metallicities. However, at the highest metallicity, almost all the data are well bracketed by the 10 Gyr and 13.5 Gyr models. In these indices, NGC 6388 is always consistent with a large age, while NGC 6441 is compatible with different ages depending on the adopted index. This fact likely reflects the different stellar mixture, in particular the presence of a more or less prominent (with respect to the metallicity) ensemble of hot He-burning stars.
According to the correlations seen in stars, the differences between theoretical and IUE indices (obtained from the least square fit presented in Paper II or estimated by inspection of Fig. 6 in that paper), for the largest measured IUE indices, are approximately 0.34, 0.5, and 0.5 mag. Therefore the overestimation of these three indices can be amply explained by stellar discrepancies.
c)- Mg ii 2800: The models match the data fairly well. All clusters follow a line of constant age around 10–12 Gyr. Interestingly, the clusters NGC 6388 and NGC 6441 are both well separated from the other three metal-rich clusters, reflecting the presence of the hot HB population.
d)- Mg i 2852: It also shows a quite fair match, apart from the lowest metallicity case, where the models sligthly overestimate the empirical data. At high metallicity, the age differences are more pronounced than in the case of Mg ii 2800. This index indicates ages around 12 Gyr for the high metallicity clusters, apart from the two outliers already discussed above.
e)- Mg Wide and 2828/2921: These are amongst the best reproduced indices, as was the case for the stellar indices. It is important to note that Mg Wide displays the least dispersion, most probably reflecting the dilution of discrepancies due to its broader bands. Paradoxically, the features that are expected to modulate this index are not very well reproduced individually.Note that for these two indices the clusters NGC 6388 and NGC 6441 are close to those of the other clusters of similar metallicity, and consistent with an age of about 12 Gyr.
f)- 2600-3000 and S2850L: These two continuum indices are formed by widely separated bands. The match with the data is fairly good and, similarly to indices mentioned in the previous point, metal-rich clusters display consistent indices, with NGC 6441 attaining the highest values.
The behavior depicted by the indices in the last two points above is interesting and may be due to a certain independence of the indices from the extension of the HB. This will be investigated in a forthcoming paper (see also section 4.2).
4 Theoretical Stellar Data Bases: a Need for an Update
4.1 Shortcomings of the theoretical spectra
We have extensively discussed the caveats associated with the UVBLUE spectral library in Paper I and their implications in the synthetic stellar indices in Paper II. In order to decrease the observed discrepancies in stars, it would be important to re-calculate the grid following a two step process (in addition to the calculation of the grid itself). We first need to incorporate up-dated solar abundances, since the parent model atmospheres of UVBLUE spectra adopted the chemical composition of Anders & Grevesse (1989), while new Kurucz model atmospheres are now available with the Grevesse & Sauval (1998) abundances. The differences in these two databases result in a change of the global metallicity of the order of 0.002. We actually conducted a series of tests by comparing entries in UVBLUE with those of Munari et al. (2005), which incorporates Grevesse & Sauval (1998) abundances, and the effects on the overall energy distribution are negligible. More recently, however, 3-D hydrodynamic calculations by Grevesse et al. (2007) have shown that a major update of solar composition might be required. These latest results indicate a solar metallicity about one half () of the value reported in the papers cited above. It is therefore of fundamental importance that these new values are tested and included in the synthetic atmospheres and interiors. Once the reference abundances have been anchored, the second step, perhaps as important as the first one, consists on the evaluation of the atomic line parameters. The fact that theoretical spectra predict too deep absorption lines (Bell et al., 1994; Bertone et al., 2008) can be, in some cases, solely ascribed to the uncertain line parameters (mainly oscillator strengths and Van der Waals damping constants). A comparison with high-quality and high-resolution observational data, as in Peterson et al. (2005), will certainly bring the solution to this problem.
4.2 Theoretical Incompleteness of the Hot Evolutionary Stages
We have mentioned that hot stars play an important role in modulating (decreasing) the index strength. Evolutionary tracks should, in principle, include evolutionary prescriptions that allow the formation of objects that populate extensions of the main sequence and the horizontal branch in the color-magnitude diagram of stellar clusters (such as BSs, blue HB stars, and components of the so-called blue tail and blue hook of the HB). As far as BSs are concerned, it has been demostrated that their presence in old open clusters severely affects the integrated energy distributions, particularly at ultraviolet wavelengths (Xin et al., 2007). More pronounced effects are expected from He-burning objects that attain high luminosities and temperatures (higher than those expected from metallicity effects alone) as those present in some GGCs (see Busso et al., 2007, for the cases of NGC 6441 and NGC 6388). It is clear that a more appropiate way to carry out the comparisons presented in § 3.2 would preferably have to include in the synthesis code the observed star counts and distributions (extracted from CM diagrams) of these hot components for each cluster. However, even if we are able to include the effects of these hot stars, such effects should be modelled on the basis of an integrated property of the population in order to be applicable to the analysis of non-resolved stellar aggregates, which is the main scope of this paper. Perhaps an interesting suggestion has emerged from the magnesium indices depicted in Fig. 3, which appear to segregate clusters with blue HBs.
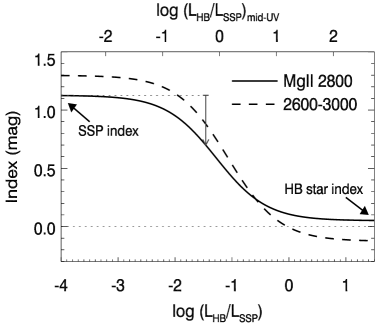
In Fig. 4, we show the results of a simple but illustrative exercise in which we analyze the effects of the presence of hot stars on two of the indices included in Fig. 3. For this purpose, we have artificially added a hot stellar component to a set of synthetic populations of 10 Gyr and =0.004. The stellar model flux that we have added in different amounts, corresponds to the parameters of the hottest HB star present in the stellar isochrones of Fig. 3 (Age///[Fe/H])=(13 Gyr/10490/3.72/). At any rate, the qualitative behavior of the results does not depend of the exact value of the stellar parameters. In the figure, we plot the index strength as a function of the bolometric luminosity fraction of the added hot stars with respect to the total luminosity of the original population: . The figure shows that indices preserve their starting value (that of the SSP without any additional hot star) almost constant until the HB luminosity accounts for approximately 1% of that of the parent population. At about the trends asymptotically approach the values of the HB stars alone. It is important to remark that we have actually computed the HB effects for the remaining eight indices and they all display a quite similar behavior. This analysis indicates, as anticipated, that the presence of hot objects in a stellar population is reflected in a reduction of their mid-UV indices, and, consequently, could provide an explanation for the low values of the line indices, in particular for the cluster NGC 6441.
In order to quantitatively establish a dilution vector for each index, we have taken the index Mg ii 2800 as a reference. We assumed that the low values of this index in NGC 6388 and NGC 6441 are solely due to hot HB stars. Then, we have calculated the difference between the averaged empirical values of the clusters NGC 6388 and NGC 6441 and that of an 10 Gyr population (0.42mag, indicated with an vertical arrow in Fig. 4) and searched for the luminosity fraction that accounts for this difference; . With this luminosity ratio we obtained the vectors for the rest of the indices and are indicated with arrows in Fig. 3 on the right of each panel. Note that these dilution vectors allow also an explanation for the low index values for BL 2538, Fe ii 2609, Mg i 2852, and 2609/2660 of the cluster NGC 6388 and for Mg i 2852 of NGC 6441. To within the uncertainties associated with the empirical indices Mg Wide and 2828/2921 and considering the their rather small vectors, these last two indices are also appropriately reproduced for both clusters.
The above analysis, however, demands an interpretation of the inconsistent values of NGC 6441 for the indices Fe ii 2609, 2609/2660 and S2850L. We have double checked the only available IUE image of NGC 6441 and found that the flux errors associated with the blue bands defining these indices translate into significantly larger uncertainties on the indices of NGC 6441 than those of NGC 6388.
Somewhat intriguing is the behavior of the 2600–3000 slope index. The two metal-rich clusters with hot HBs are about in the same loci as the red HB clusters, eventhough the above analysis indicates that the vector for this index is large (0.42 mag). One can speculate on a number of reasons that potentially affect the overall mid-UV energy distribution (such as color excess), nevertheless, from an empirical point of view it appears that this index is, to some extent, insensitive to the dilution by hot stars. We want to stress that a more profound examination is required. This has to include, as mentioned earlier, the appropiate numbers and distributions of the hot stellar component. Nevertheless, it is clear that the exclusion of hot objects could lead to wrong predictions for metal rich systems.
5 Effects of Alpha Enhancement on the Mid-UV Morphology
Closely related to the brief discussion in § 4.1 is the evidence that the elemental abundances in globular clusters show significant variations with respect to solar partition values. It has been a common practice to incorporate, within population synthesis techniques, adjustments to optical indices (in both theoretical and empirical) that account, for example, for the enhancement of the -elements (O, Na, Ti, Ca, Mg, etc.) (Mendel et al., 2007). In the mid-UV, the effects of -enhancement have never been explored and in this section we present some preliminary results.
In what follows, we made use of the theoretical database of stellar fluxes available at Fiorella Castelli’s website555http://wwwuser.oat.ts.astro.it/castelli/grids/ (Castelli & Kurucz, 2003). In view of the low resolution of these grids and within the exploratory nature of this investigation, we decided to concentrate on showing the effects of -enhancement on the theoretical stellar and population SEDs, defering the detailed analysis of the impact of these effects on continuum and line indices for a future investigation in which we also partially cover the points mentioned in the previous section. An important note is that the grid of Castelli’s stellar fluxes has been calculated by adopting the Grevesse & Sauval (1998) solar abundances and consider a set of updated opacity distribution functions (NEWODFs).
In Fig. 5, we show the residuals for a series of theoretical fluxes for three chemical compositions ( = 0.0004, 0.02, 0.05), five different temperatures, and a surface gravity of =4.0 dex. In the lower left corner in each panel on the left we indicate the effective temperature for that row. The vertical axes are the flux residuals , where is the difference between the flux with an -enhancement of [/Fe]=+0.4 dex and those considering [/Fe]=+0.0 dex. The residuals for temperatures K have been scaled with offsets of 1, 2, 3, and 4 with respect to that for 5000 K. The thick lines illustrate the relative residuals for the cases in which has been fixed. A significant -enhancement, keeping the total metallicity fixed, implies that the abundances of the non-enhanced metals (in particular Fe) have to be rescaled downwards (see, for example, Annibali et al., 2007; Mendel et al., 2007, for the case of Lick indices). Since oxygen is the most abundant metal, the decrease on the non- metals turns out to be significant. Particularly important for the stellar atmospheres is the decrease of Fe because of its large contribution to line blanketing. As an example, in the case of , the atmosphere models have [Fe/H]= for non-enhanced abundances and [Fe/H]= if [/Fe]=+0.4 dex. To perform this rescaling we have simply interpolated the needed stellar atmospheres.
Note that the residuals heavily depend on temperature and chemical composition, with the -enhanced fluxes being on average larger in the mid-UV and hence delivering positive residuals. The residuals can reach values in excess of 60%, particularly at the solar and super solar regimes.
The thin lines in Fig. 5 show the residuals when we compare theoretical fluxes with the same nominal parameters (//[M/H]) of the parent model, i.e. is not fixed. In this case the residuals are generally negative, reflecting the overestimation of the blanketing.

For the calculation of the composite -enhanced spectra of SSPs, we remind that the new Padova models do not account yet for variations of elements partition. Thus, in the calculation of present SSP spectra, the -enhancement is only taken into account for the effect it has in the stellar atmospheres. The stellar fluxes used in the synthesis code were those with a renormalized heavy element abundance to a fixed metallicity (). The effects on the stellar evolutionary tracks should not be significant for the low metallicities of GGCs.
In Fig. 6, we show the relative differences between integrated spectra of SSP with and without accounting for -enhancement. The panels refer to the combinations of three ages (rows) and four chemical compositions (columns). An examination of the figure allows to point out some remarkable behaviors. First, the effects of -enhancement heavily depend on , with the most pronounced differences at the metal-rich end, even in the relatively young populations of 1 Gyr. For the most metal-poor SSPs (), the flux differences never exceed 10%. Second, concerning the age effects, the notable differences seen in the mid-UV residual spectrum of the 1 Gyr metal-rich population appear gradually shifted to longer wavelengths. Globally, -enhancement is notoriously more important in the mid-UV than in the near-UV, at ages and abundances compatible with those of GGCs, and certainly far more important than in the optical, where it has been extensively studied. This UV sensitivity suggests, among many other possible options, to conduct an analysis of mid-UV indices of intermediate and late-type stars in the context of the chemical evolution scenarios for the Milky Way.

6 Summary
In this work we have studied the ultraviolet properties of evolved stellar populations, with the purpose of analyzing the behavior of mid-UV indices in terms of the leading population parameters (chemical composition and age) and checking the current status of the theoretical models. With these results we trace the next more important advances to perform. The results can be summarized as follows:
-
•
This is, to our knowledge, the first theoretical analysis of integrated mid-UV indices of old populations. They display a variety of behaviors, with the main one being the low index insensitivity to age in a wide age interval (age 2 Gyr). Two indices, Fe ii 2332 and Fe ii 2402, show, however, a remarkable distinct behavior with respect to other indices at the metal rich regime. This result is of particular importance, since our work is aimed at providing predictive tools for the analysis of elliptical galaxies of high metallicity.
-
•
We also present a test of the ability of SSP fluxes to reproduce 10 spectroscopic indices measured in the IUE spectra of a sample of 27 GGCs. Theoretical indices well reproduce the overall trends but show slight discrepancies in which synthetic indices are sistematically higher. In this respect, we conclude that SSPs well represent the observational prototypes of simple populations, after the appropiate scaling of SSPs synthetic indices to the IUE system. Therefore, one can be confident that the approach presented here serves as the basis for studies of metal-rich populations, which cannot be modelled with existing empirical data bases, due to their poor coverage of the metallicity space.
-
•
We provide a brief diagnostics on how the theoretical ingredients should be improved. We suggest the following three main roads: a)- improvement of the solar reference abundances in the calculation of theoretical atmospheres and evolutionary tracks; b)- semi-empirically up-dating of the atomic line parameters to reduce the too strong absorption lines in synthetic spectra; and c)- check with the new isochrones the importance of hot evolved evolutionary phases.
-
•
Together with the above points, it is important to incorporate the effects of -enhancement in adequate resolution stellar atmosphere models. In fact, the tests we have illustrated here, though performed with low resolution models, have shown that an enhancement of +0.4 dex may result in dramatic differences for the integrated spectra of the same metallicity and age. In parallel, -enhancement should also be considered for the computation of the evolutionary tracks, though this effect is expected to be important only at high metallicity.
All the above issues will be the subjects of our future investigations.
References
- Anders & Grevesse (1989) Anders, E., & Grevesse, N. 1989, Geochim. Cosmochim. Acta, 53, 197
- Annibali et al. (2007) Annibali, F., Bressan, A., Rampazzo, R., Zeilinger, W. W., & Danese, L. 2007, A&A, 463, 455
- Bell et al. (1994) Bell, R. A., Paltoglou, G., & Tripicco, M. J. 1994, MNRAS, 268, 771
- Bertelli et al. (1994) Bertelli, G., Bressan, A., Chiosi, C., Fagotto, F., & Nasi, E. 1994, A&A, 106, 275
- Bertelli et al. (2008) Bertelli, G., Girardi, L., Marigo, P., & Nasi, E. 2008, A&A, 484, 815
- Bertola et al. (1995) Bertola, F., Bressan, A., Burstein, D., Buson, L. M., Chiosi, C., & di Serego Alighieri, S. 1995, ApJ, 438, 680
- Bertone et al. (2007) Bertone, E., Buzzoni, A. Chavez, M., & Rodriguez-Merino, L. H. 2007, in ASP Conf. Ser. 374, From Stars to Galaxies: Building the pieces to build up the Universe, ed. A. Vallenari, R. Tantalo, L. Portinari, & A. Moretti (San Francisco, CA: ASP) p. 399
- Bertone et al. (2008) Bertone, E., Buzzoni, A., Chavez, M., & Rodriguez-Merino, L. H. 2008, A&A, 485, 823
- Bonatto et al. (1995) Bonatto, C., Bica, A., & Alloin, D. 1995, A&A, 112, 71
- Bressan et al. (1994) Bressan, A., Chiosi, C., & Fagotto, F. 1994, ApJS, 94, 63
- Bressan et al. (1998) Bressan, A., Granato, G. & Silva, L. 1998, A&A, 332, 135
- Brown et al. (2008) Brown, T. M., Smith, E., Ferguson, H. C., Sweigart, A. V., Kimble, R. A., & Bowers, C. W. 2008, ApJ, 682, 319
- Busso et al. (2007) Busso, G., et al. 2007, A&A, 474, 105
- Buzzoni et al. (2009) Buzzoni, A., Bertone, E., Chavez, M. & Rodriguez-Merino, L. H. 2008, in New Quests in Stellar Astrophysics II: The Ultraviolet Properties of Evolved Stellar Populations, eds. M. Chavez, E. Bertone, L. H. Rodriguez-Merino & D. Rosa-Gonzalez (New York, NY: Springer), p. 263 (arXiv:0709.2711)
- Caloi & D’Antona (2007) Caloi, V., & D’Antona, F. D., 2007, A&A, 463, 949
- Cardelli et al. (1989) Cardelli, J. A., Clayton, G. C., & Mathis, J. S. 1989, ApJ, 345, 245
- Carraro et al. (1996) Carraro, G., Girardi, L., Bressan, A., & Chiosi, C. 1996, A&A, 305, 849
- Catelan et al. (2006) Catelan, M., Stetson, P. B., Pritzl, B. J., Smith, H. A., Kinemuchi, K., Layden, A. C., Sweigart, A. V., & Rich, R. M. 2006, ApJ, 651, 133
- Castelli & Kurucz (2003) Castelli, F., & Kurucz, R. L. 2003, in IAU Symp. 210, Modelling of Stellar Atmospheres, ed. N. Piskunov, W. W. Weiss & D. F. Gray (San Francisco, CA: ASP), A20
- Chavez et al. (2007) Chavez, M., Bertone, E., Buzzoni, A., Franchini, M., Malagnini, M. L., Morossi, C., & Rodriguez-Merino, L. H. 2007, ApJ, 657, 1046 (Paper II)
- Chavez (2009) Chávez, M. 2009, Ap&SS, 320, 45
- Clemens et al. (2009) Clemens, M. S., Bressan, A., Panuzzo, P., Rampazzo, R., Silva, L., Buson, L., & Granato, G. L. 2009, MNRAS, 392, 982
- Dickens (1972) Dickens, R. F. 1972, MNRAS, 157, 281
- Fanelli et al. (1990) Fanelli, M. N., O’Connell, R. W., Burstein, D., & Wu, C. 1990, ApJ, 364, 272
- Fanelli et al. (1992) Fanelli, M. N., O’Connell, R. W., Burstein, D., & Wu, C. 1992, ApJS, 82, 197
- Gómez de Castro et al. (2009) Gómez de Castro, A. I., et al. 2008, in New Quests in Stellar Astrophysics II: The Ultraviolet Properties of Evolved Stellar Populations, ed. M. Chavez, E. Bertone, L. H. Rodriguez-Merino & D. Rosa-Gonzalez (New York, NY: Springer), p. 319
- Grevesse & Sauval (1998) Grevesse, N., & Sauval, A. J. 1998, Space. Sci. Rev., 85, 161
- Grevesse et al. (2007) Grevesse, N., Asplund, M., & Sauval, A. J. 2007, Space Sci. Rev., 130, 105
- Harris (1996) Harris, W. E. 1996, AJ, 112, 1487
- Kurucz (1993) Kurucz, R. L. 1993, CD-ROM No. 13, ATLAS9 Stellar Atmosphere Programs and 2 km/s Grid
- Lee (1990) Lee, Y. W. 1990, ApJ, 363, 159
- Lee & Worthey (2005) Lee, H., & Worthey, G. 2005, ApJS, 160, 176
- Lotz et al. (2000) Lotz, J. M., Ferguson, H. C., & Bohlin, R. C. 2000, ApJ, 532, 830
- Maraston et al. (2009) Maraston, C., Nieves Colmenárez, L., Bender, R., & Thomas, D. 2009, A&A, 493, 425
- Marigo et al. (2008) Marigo, P., Girardi, L., Bressan, A., Groenewegen, M. A. T., Silva, L., & Granato, G. L. 2008, A&A, 482, 883
- Meissner & Weiss (2006) Meissner, F., & Weiss, A. 2006, A&A, 456, 1085
- Mendel et al. (2007) Mendel, J. T., Proctor, R. N., & Forbes, D. A. 2007, MNRAS, 379, 1618
- Munari et al. (2005) Munari, U., Sordo, R., Castelli, F., & Zwitter, T. 2005, A&A, 442, 1127
- Peterson et al. (2005) Peterson, R. C., et al. 2005, in Astrophysics & Space Science Library, Vol. 329, Starbursts: From 30 Doradus to Lyman Break Galaxies, ed. R. de Grijs & R. M. Gonzalez Delgado (Dordrecht: Springer), p. 61
- Ponder et al. (1998) Ponder, J. M., et al. 1998, AJ, 116, 2297
- Rakos & Schombert (2005) Rakos, K., & Schombert, J. 2005, PASP, 117, 245
- Rodríguez-Merino (2004) Rodríguez-Merino, L. H. 2004, PhD Thesis, INAOE, Mexico
- Rodríguez-Merino et al. (2005) Rodríguez-Merino, L. H., Chávez, M., Bertone, E., & Buzzoni, A. 2005, ApJ, 626, 411 (Paper I)
- Rose & Deng (1999) Rose, J., & Deng, S. 1999, AJ, 117, 2213
- Salaris & Weiss (2002) Salaris, M., & Weiss, A. 2002, A&A, 388, 492
- Schiavon (2007) Schiavon, R. 2007, ApJS, 171, 146
- Spinrad et al. (1997) Spinrad, H., Dey, A., Stern, D., Dunlop, J., Peacock, J., Jimenez, R., & Windhorst, R. 1997, ApJ, 484, 581
- Sollima et al. (2005) Sollima, A., Pancino, E., Ferraro, F. R., Bellazzini, M., Straniero, O., & Pasquini, L. 2005, ApJ, 634, 332
- Stanford et al. (2006) Stanford, L. M., Da Costa, G. S., Norris, J. E., & Cannon, R. D. 2006, ApJ, 647, 1075
- Testa et al. (2001) Testa, V., Corsi, C. E., Andreuzzi, G., Iannicola, G., Marconi, G., Piersimoni, A. M., & Buonanno, R. 2001, AJ, 121, 916
- van Loon et al. (2008) van Loon, J. T., Boyer, M. L., & McDonald, I. 2008, ApJ, 680, L49
- Worthey et al. (1994) Worthey, G., Faber, S. M., Gonzalez, J. J., & Burstein, D. 1994, ApJS, 94, 687
- Xin et al. (2007) Xin, Y., Deng, L., & Han, Z. W. 2007, ApJ, 660, 319
| Cluster | [Fe/H] | age | E(B-V) | HBR | hbt | notes | |
|---|---|---|---|---|---|---|---|
| (dex) | (Gyr) | (km s-1) | (mag) | ||||
| NGC 104 | -0.76 | 10.7 | -18.7 | 0.04 | -0.99 | 7 | |
| NGC 362 | -1.16 | 8.7 | 223.5 | 0.05 | -0.87 | 6 | |
| NGC 1851 | -1.22 | 9.2 | 320.5 | 0.02 | -0.36 | 1 | |
| NGC 1904 | -1.57 | 11.7 | 207.5 | 0.01 | 0.89 | 0 | |
| NGC 2808 | -1.15 | 9.3 | 99.7 | 0.22 | -0.49 | 0 | |
| NGC 5272 | -1.57 | 11.3 | -147.1 | 0.01 | 0.08 | 4 | |
| NGC 5824 | -1.85 | 9.2-10.4 | -27.5 | 0.13 | 0.79 | 2 | (a) |
| NGC 5904 | -1.29 | 10.9 | 51.8 | 0.03 | 0.31 | 3 | |
| NGC 6093 | -1.75 | 12.4 | 7.3 | 0.18 | 0.93 | 0 | |
| NGC 6205 | -1.54 | 11.9 | -246.6 | 0.02 | 0.97 | 0 | |
| NGC 6266 | -1.29 | 11.0-12.1 | -68.0 | 0.47 | 0.32 | 4 | (a) |
| NGC 6284 | -1.32 | 11.0 | 29.7 | 0.28 | 9.99 | 1 | |
| NGC 6293 | -1.92 | 7.9-8.8 | -98.9 | 0.41 | 0.90 | 1 | (a) |
| NGC 6341 | -2.28 | 12.3 | -120.5 | 0.02 | 0.91 | 2 | |
| NGC 6388 | -0.60 | 10.7 | 81.2 | 0.37 | 9.99 | 5 | (b) |
| NGC 6397 | -1.95 | 12.1 | 18.9 | 0.18 | 0.98 | 1 | |
| NGC 6441 | -0.53 | 11.0 | 18.3 | 0.47 | 9.99 | 7 | (c) |
| NGC 6624 | -0.42 | 10.6 | 54.3 | 0.28 | -1.00 | 7 | |
| NGC 6626 | -1.45 | 12.6 | 17.0 | 0.40 | 0.90 | 2 | (d) |
| NGC 6637 | -0.71 | 10.6 | 39.1 | 0.16 | -1.00 | 7 | |
| NGC 6681 | -1.51 | 11.5 | 218.7 | 0.07 | 0.96 | 1 | |
| NGC 6715 | -1.58 | 12.2 | 141.9 | 0.15 | 0.75 | 3 | (e) |
| NGC 6752 | -1.56 | 12.2 | -27.4 | 0.04 | 1.00 | 0 | |
| NGC 6864 | -1.32 | 9.0 | -189.3 | 0.16 | -0.07 | 1 | (a) |
| NGC 7078 | -2.25 | 11.7 | -106.6 | 0.10 | 0.67 | 0 | |
| NGC 7089 | -1.62 | 11.8-13.7 | -6.7 | 0.06 | 0.96 | 1 | (a) |
| NGC 7099 | -2.20 | 11.9 | -184.3 | 0.03 | 0.89 | 1 |
Note. — (a) Ages from Case (A) of Meissner & Weiss (2006). (b) We adopted as the age of NGC 6388 that of NGC 104 according to Catelan et al. (2006). (c) Caloi & D’Antona (2007) assumed a reference age of 11.0 Gyr. (d) Testa et al. (2001) indicate that NGC 6626 is coeval with respect to NGC 2298 and this latter cluster has 12.6 Gyr in Salaris & Weiss (2002). (e) Age from Rakos & Schombert (2005) derived from Strömgren photometry.
| object | Fe ii 2332 | BL 2538 | Fe ii 2609 | Mg ii 2800 | Mg i 2852 | Mg Wide | 2600-3000 | 2609/2660 | 2828/2921 | S2850L |
|---|---|---|---|---|---|---|---|---|---|---|
| NGC 104 | 0.32 | 0.58 | 0.59 | 0.99 | 0.46 | 0.31 | 1.28 | 0.93 | 0.58 | 1.48 |
| NGC 362 | 0.30 | 0.29 | 0.34 | 0.69 | 0.25 | 0.15 | 0.79 | 0.56 | 0.28 | 0.91 |
| NGC 1851 | 0.33 | 0.34 | 0.35 | 0.73 | 0.27 | 0.15 | 0.76 | 0.54 | 0.25 | 0.91 |
| NGC 1904 | 0.25 | 0.09 | 0.18 | 0.43 | 0.19 | 0.08 | 0.35 | 0.31 | 0.09 | 0.39 |
| NGC 2808 | 0.32 | 0.27 | 0.35 | 0.63 | 0.27 | 0.10 | 0.64 | 0.57 | 0.21 | 0.73 |
| NGC 5272 | 0.25 | 0.30 | 0.32 | 0.65 | 0.19 | 0.10 | 0.78 | 0.51 | 0.19 | 0.87 |
| NGC 5824 | 0.04 | 0.10 | 0.45 | 0.14 | 0.06 | 0.42 | 0.17 | 0.09 | 0.55 | |
| NGC 5904 | 0.23 | 0.19 | 0.25 | 0.56 | 0.27 | 0.11 | 0.63 | 0.44 | 0.22 | 0.65 |
| NGC 6093 | 0.11 | 0.15 | 0.45 | 0.17 | 0.09 | 0.47 | 0.26 | 0.19 | 0.54 | |
| NGC 6205 | 0.17 | 0.15 | 0.19 | 0.38 | 0.13 | 0.05 | 0.39 | 0.29 | 0.09 | 0.50 |
| NGC 6266 | 0.24 | 0.25 | 0.56 | 0.24 | 0.17 | 0.61 | 0.43 | 0.27 | 0.79 | |
| NGC 6284 | 0.12 | 0.13 | 0.50 | 0.21 | 0.09 | 0.46 | 0.29 | 0.18 | 0.61 | |
| NGC 6293 | 0.08 | 0.14 | 0.32 | 0.17 | 0.09 | 0.48 | 0.28 | 0.13 | 0.67 | |
| NGC 6341 | 0.14 | 0.14 | 0.13 | 0.31 | 0.09 | 0.00 | 0.38 | 0.23 | 0.08 | 0.42 |
| NGC 6388 | 0.33 | 0.46 | 0.70 | 0.32 | 0.23 | 1.12 | 0.78 | 0.44 | 1.44 | |
| NGC 6397 | 0.08 | 0.07 | 0.29 | 0.18 | 0.02 | 0.23 | 0.14 | 0.07 | 0.24 | |
| NGC 6441 | 0.81 | 0.77 | 0.34 | 0.30 | 1.46 | 1.09 | 0.46 | 2.03 | ||
| NGC 6624 | 1.08 | 0.48 | 0.33 | 1.13 | 0.47 | |||||
| NGC 6626 | 0.56 | 0.33 | 0.10 | 0.41 | 0.29 | |||||
| NGC 6637 | 0.34 | 0.56 | 0.95 | 0.43 | 0.31 | 1.10 | 0.87 | 0.50 | 1.41 | |
| NGC 6681 | 0.20 | 0.13 | 0.14 | 0.49 | 0.22 | 0.14 | 0.49 | 0.28 | 0.23 | 0.53 |
| NGC 6715 | 0.21 | 0.19 | 0.27 | 0.54 | 0.18 | 0.10 | 0.61 | 0.46 | 0.17 | 0.78 |
| NGC 6752 | 0.20 | 0.15 | 0.18 | 0.48 | 0.16 | 0.07 | 0.43 | 0.32 | 0.15 | 0.47 |
| NGC 6864 | 0.37 | 0.49 | 0.67 | 0.31 | 0.11 | 0.87 | 0.74 | 0.22 | 1.26 | |
| NGC 7078 | 0.13 | 0.11 | 0.11 | 0.32 | 0.12 | 0.03 | 0.47 | 0.23 | 0.08 | 0.45 |
| NGC 7089 | 0.13 | 0.19 | 0.24 | 0.50 | 0.21 | 0.05 | 0.45 | 0.36 | 0.13 | 0.50 |
| NGC 7099 | 0.17 | 0.10 | 0.15 | 0.32 | 0.10 | 0.02 | 0.31 | 0.25 | 0.02 | 0.35 |