Flows and Motions in Moss in the Core of a Flaring Active Region: Evidence for Steady Heating.
Abstract
We present new measurements of the time variability of intensity, Doppler and non-thermal velocities in moss in an active region core observed by the EUV Imaging Spectrometer on Hinode in 2007, June. The measurements are derived from spectral profiles of the Fe XII 195 Å line. Using the 2′′ slit, we repeatedly scanned 150′′ by 150′′ in a few mins. This is the first time it has been possible to make such velocity measurements in the moss, and the data presented are the highest cadence spatially resolved maps of moss Doppler and non-thermal velocities ever obtained in the corona. The observed active region produced numerous C- and M- class flares with several occurring in the core close to the moss. The magnetic field was therefore clearly changing in the active region core, so we ought to be able to detect dynamic signatures in the moss if they exist. Our measurements of moss intensities agree with previous studies in that a less than 15% variability is seen over a period of 16 hours. Our new measurements of Doppler and non-thermal velocities reveal no strong flows or motions in the moss, nor any significant variability in these quantities. The results confirm that moss at the bases of high temperature coronal loops is heated quasi-steadily. They also show that quasi-steady heating can contribute significantly even in the core of a flare productive active region. Such heating may be impulsive at high frequency, but if so it does not give rise to large flows or motions.
1 Introduction
One of the most important unsolved problems in astrophysics is the question of how the solar corona is heated. Directly related to this problem is understanding the evolution of the emission in active regions, particularly in the core. Recent observations from Hinode (Kosugi et al., 2007) are providing a comprehensive view of active regions. They appear to be composed of at least two dominant loop populations: core loops that are seen evolving at multi-temperatures, and peripheral cool loops that develop downflows (Ugarte-Urra et al., 2009). The former appear to be rooted in unipolar magnetic concentrations (Brooks et al., 2008). The latter are seen extending to great heights and appear to be associated with coronal rain. Fan structures around the edges of active regions show strong outflows (Sakao et al., 2007) that may be significant sources of the slow solar wind (Doschek et al. 2008; Harra et al. 2008).
A key question is what is the time-scale of heating in the cores of active regions? Is steady heating important, or is everything dynamic? If the heating is impulsive, is the repetition time between events shorter than a coronal loop cooling time so that the impulsive heating is effectively steady? Hydrostatic models are able to reproduce the emission from high temperature loops seen in active regions, but they have difficulty reproducing the emission from lower temperature (warm) overdense loops (Warren & Winebarger, 2006; Klimchuk, 2006). Hydrodynamic simulations of active regions (Warren & Winebarger, 2007) or modeling based on low frequency impulsive heating by nanoflares (Patsourakos & Klimchuk, 2008), improve the agreement with the warm loop observations, but discrepancies still remain. It is not always clear whether these discrepancies are related to the hydrostatic or hydrodynamic modeling, or to the extrapolation and modeling of the morphology of the magnetic field (Brooks & Warren, 2008).
One region where the heating could be quasi-steady is in transition region moss. Moss is the reticulated pattern of emission in active regions that typically evolves slowly over long time-scales and shows only low-level variability (Berger et al., 1999a). Indeed hydrostatic modeling of moss is able to reproduce the observed intensities well - to within a filling factor (Warren et al., 2008). Though the general pattern evolves slowly, fine-scale dynamics are observed on a local scale, and this has been interpreted as variability in the overlying spicular material rather than in the moss itself (de Pontieu et al., 1999). This picture of fine-scale dynamics within a slowly evolving large-scale pattern also well describes the unipolar regions at the footpoints of hot loops (Brooks et al., 2008). The fact that moss is thought to be the emission from the footpoints of hot loops (Berger et al., 1999b; Martens et al., 2000), suggests that there may be a close relationship between these patterns and we are investigating this issue. Tripathi et al. (2008) recently presented an example where the moss maps the magnetic flux closely, though De Pontieu et al. (2003) did not find any spatial correlation with the photospheric magnetic field.
It has been argued that moss in highly evolved active regions may be the only regions in the corona where the heating could be steady because these are the only places where the magnetic field is not changing rapidly (Antiochos et al., 2003). Detection of flows and motions in the moss, however, would reveal dynamic signatures for the first time. This letter presents an analysis of the time-variability of flows and motions in moss over 16 hours of EIS observations of the core of a flaring active region observed in 2007, June. We show that the Doppler and non-thermal velocities are no larger than typical quiet Sun values in the moss, and that they do not vary substantially over the observations period. These results support the view that moss at the bases of hot loops is heated quasi-steadily.


2 Observations and Data Reduction
The EIS instrument obtains high resolution spectra in the wavelength ranges 171–212 Å and 245-291 Å and has a spectral resolution of 0.0223 Å and 1′′ spatial pixels (Culhane et al., 2007). Typical exposure times for active regions are 15–30s so that it takes tens of mins to several hours for the EIS instrument to step its slit over the full extent of a large active region. Thus observational cadence or spatial coverage are usually traded off for diagnostic information when making observations with a spectrometer in comparison with using a broad-band filter imager such as TRACE (Handy et al., 1999, Transition Region and Coronal Explorer) or Hinode/XRT (Golub et al., 2007, X-ray Telescope). The EIS effective area peaks near the strong Fe XII 195.119 Å emission line, however, so that very short exposures (1s) can still yield good counts in this line on a relatively bright target. It is therefore possible to make rapid scans over a wide area in strong lines only, effectively trading off wavelength coverage to retain high cadence and a large FOV. We use data obtained in this observing mode in this letter.
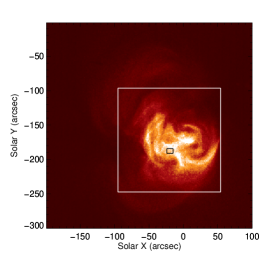
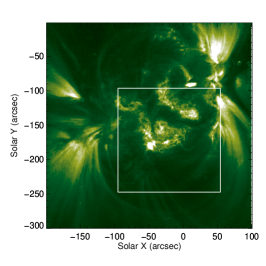
Hinode tracked NOAA active region 10960 from limb to limb in June 2007. EIS repeatedly ran an observing sequence CHROMO_EVAP_RASTER which takes 1s exposures with the 2′′ slit and scans an area of 150′′ by 150′′ in a few mins. Figure 1 shows XRT and TRACE images of AR 10960 with the EIS FOV overlaid. The movie associated with Figure 1 shows that AR 10960 evolved slowly in XRT images, and this is confirmed by the X-ray light curve shown in Figure 1. The intensity observed by XRT in a boxed region above the moss varies by less than 15% over the 8 hour period shown. The TRACE movie shows that the pattern of moss in the core of the region is also remarkably stable. Nevertheless, this region was flare productive: Figure 2 is a GOES plot of the X-ray activity, which shows numerous C- and M- class flares occuring during its passage across the disk, and also a gradual decline in activity. These characteristics make AR 10960 an ideal candidate for studying whether impulsive or steady heating dominates in the core of the region.
The EIS data analyzed here were obtained between 18UT on 2007, June 7, and 10UT on 2007, June 8. Several C- class flares did occur during these 16 hours though not all were cleanly observed by Hinode or TRACE because of South Atlantic Anomaly (SAA) and night-time passage. At least two flares are seen, however, in our XRT and TRACE movies and it is clear that they occurred in the core of the region near the neutral line with the potential to disrupt or interact with the moss.
The EIS data were converted to physical units and processed using the default options for the SolarSoft routine EIS_PREP. The thermal orbital variation in line centroid position was estimated from single Gaussian fits to the Fe XII 195.119 Å line profiles at every pixel of every raster scan. This effect and the spectral line tilt were removed from the data prior to further analysis. The zero-point velocity for this operation was set by measuring the wavelength of the Fe XII line averaged over the complete dataset. The Hinode pointing has an orbital variation on the order of 1–2 pixels in the X- and Y- directions (Shimizu et al., 2007). This effect was removed by coaligning the single Gaussian fit images by cross-correlation.
Since the 2′′ slit instrumental width was not measured in the laboratory pre-launch, we estimated it using measurements of the Fe X 184.536 Å line from a large raster scan of the quiet Sun taken on 2007, November 6. From these data, we found that the 2′′ slit instrumental width was approximately 19% wider than that of the 1′′ slit. Taking the on-orbit value for the 1′′ slit from Brown et al. (2008) we estimated the 2′′ slit instrumental width to be 0.066 Å. The non-thermal velocities were calculated from the line widths assuming this measured instrumental width and the appropriate thermal width at a temperature of 1.35MK.
The Fe XII 195.119 Å line is blended with a very weak density sensitive line at 195.179 Å. and we found that single Gaussian fits to our data overestimated the Doppler and non-thermal velocities as a result of density variations. Our measurements are therefore derived from double Gaussian fits where the separation of the line centroids is fixed at 0.06 Å and the widths of the two components are forced to be the same. These fit parameter constraints were suggested by Young et al. (2009) and we found that their method worked well on our data, even in single pixels.
3 Results
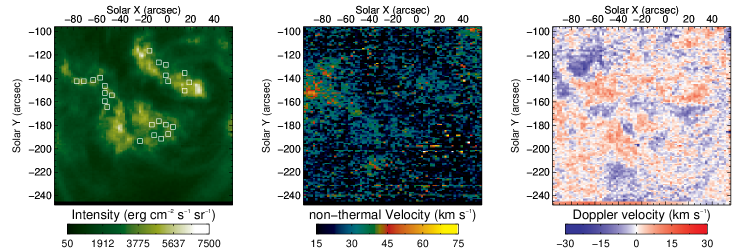
Figure 3 shows an example of the intensity, non-thermal, and Doppler velocity maps obtained from two component Gaussian fits to the EIS data. The moss is only weakly visible in the non-thermal velocity maps, and little variation in the patterns is seen over 16 hours of data (see the movie associated with Figure 3).
We analyzed the time variability of these quantities in 25 locations in the moss by visually selecting pixels that are not affected (in the line of sight) by any flaring activity, and do not lie close to the edges of the moss. These edges border dark areas that have been shown to have enhanced non-thermal velocities and outflows in other active regions (Doschek et al., 2008). Larger blue-shifts in these areas can also be seen in Figure 3.
Our aim was to probe the properties of the moss on smaller spatial scales than Antiochos et al. (2003)– they used a minimum box size of 10′′10′′– and to reduce smoothing of the measurements that results from averaging over large regions. Variations in intensities in single pixels can result from not sampling precisely the same spatial location in consecutive rasters because of the Hinode orbital pointing variation, however. Furthermore, increased signal in the box improves the reliability of measurements of the contribution from the blend. Therefore, the box size was chosen to be 2 pixels around the selected pixels as a compromise. The velocities here were calibrated to the zero point velocity by comparing the time-averaged wavelength from single and double Gaussian fits to the data at each location. Nevertheless, the absolute values are not well constrained.
The results for the full 16 hour time-period are shown in Figure 4. Residual effects from, e.g., cosmic ray hits that were not completely removed, have been ignored by only quoting results from the 98% of significant values. Consistent with previous results obtained by TRACE, the high spectral resolution EIS obervations show that the Fe XII 195.119 Å intensities do not vary significantly over time. The standard deviation of the intensities from the 25 locations over 16 hours is less than 15% of the average intensity in each region. This is less than the variation of the average intensity from location to location (30-35%).
Our new measurements of Doppler and non-thermal velocities show that they are only weak in the moss; 2.7 km/s (red-shifted) and 21.7 km/s, respectively, when averaged over time in all the 25 locations. Given the uncertainties in the absolute values, the Doppler velocity is consistent with a measurement of zero. The average values of the non-thermal velocities in each of the 25 locations range from 17–31 km/s. The upper limit of this range is an extreme case: in all but this location the values are less than 26 km/s. These values are no more than the typical values measured for non-thermal mass motions in the quiet Sun at this temperature. We confirmed this by performing double Gaussian fits to the Fe XII 195.119 Å line in 39 quiet Sun synoptic datasets that we had processed for a differential emission measure analysis (Brooks et al., 2009). The data were taken with the EIS 1′′ slit for the best spectral resolution, and the non-thermal velocity we obtained for the quiet Sun was 25 km/s. The standard deviation in the moss measurements is less than 15% of the average values for each location over the 16 hours of observation, which corresponds to a variation of less than 4 km/s in all the boxed areas. The average Doppler velocities are also less than 6.5 km/s in each of the regions. This is consistent with the measurements of only a few km/s in the moss by Warren et al. (2008). The Doppler velocities also vary by less than 3 km/s during the observations period. As with the intensity results, this is less than the measured variation from location to location.


4 Conclusions
Active region 10960 evolved slowly when seen in XRT images, and the moss in the core of the region also developed slowly in TRACE and EIS images. The region was flare productive, however, with many C- and M- class flares occurring throughout its passage across the solar disk. Several of these flares occurred close to the neutral line in the core of the active region during the 16 hours of data we analyzed with the potential to interact with and disrupt the moss. AR 10960 was therefore a good candidate for studying the relative importance of impulsive and steady heating in the core of an active region.
The data we presented are the highest cadence spatially resolved maps of non-thermal and Doppler velocities in moss ever obtained in the corona. As such they are ideal for detecting any signatures of dynamics in the moss, should they exist. Our spectrally resolved measurements of Fe XII 195.119 Å intensities agree with previous results from broad-band filter images in that the intensities do not vary significantly in the moss. Our new measurements of Doppler and non-thermal velocities show that they are only weak in the moss, and that they vary by only a few km/s during the observing period.
The results confirm the findings of Antiochos et al. (2003) that moss at the bases of high temperature coronal loops is heated quasi-steadily ‘to an excellent approximation’. Perhaps surprisingly, we find that this is also true in the core of a flare productive active region, where the magnetic field is clearly changing. It may be that steady heating dominates in the moss in active region cores, with the variability being due to obscuration by overlying spicular material as suggested by de Pontieu et al. (1999). In any case, it is clear that the heating does not give rise to strong flows or motions in the moss, and that the time-scale between impulsive heating events has to be short enough to maintain loops at high temperatures, in contrast to models that assume loops have time to cool substantially between events.
References
- Antiochos et al. (2003) Antiochos, S. K., Karpen, J. T., DeLuca, E. E., Golub, L., & Hamilton, P. 2003, ApJ, 590, 547
- Berger et al. (1999a) Berger, T. E., de Pontieu, B., Fletcher, L., Schrijver, C. J., Tarbell, T. D., & Title, A. M. 1999a, Sol. Phys., 190, 409
- Berger et al. (1999b) Berger, T. E., de Pontieu, B., Schrijver, C. J., & Title, A. M. 1999b, ApJ, 519, L97
- Brooks et al. (2008) Brooks, D. H., Ugarte-Urra, I., & Warren, H. P. 2008, ApJ, 689, L77
- Brooks & Warren (2008) Brooks, D. H., & Warren, H. P. 2008, ApJ, 687, 1363
- Brooks et al. (2009) Brooks, D. H., Warren, H. P., Williams, D. R., & Watanabe, T. 2009, ApJ
- Brown et al. (2008) Brown, C. M., Feldman, U., Seely, J. F., Korendyke, C. M., & Hara, H. 2008, ApJS, 176, 511
- Culhane et al. (2007) Culhane, J. L., et al. 2007, Sol. Phys., 243, 19
- de Pontieu et al. (1999) de Pontieu, B., Berger, T. E., Schrijver, C. J., & Title, A. M. 1999, Sol. Phys., 190, 419
- De Pontieu et al. (2003) de Pontieu, B., Tarbell, T., & Erdélyi, R. 2003, ApJ, 590, 502
- Doschek et al. (2008) Doschek, G. A., Warren, H. P., Mariska, J. T., Muglach, K., Culhane, J. L., Hara, H., & Watanabe, T. 2008, ApJ, 686, 1362
- Golub et al. (2007) Golub, L., et al. 2007, Sol. Phys., 243, 63
- Handy et al. (1999) Handy, B. N., et al. 1999, Sol. Phys., 187, 229
- Harra et al. (2008) Harra, L. K., Sakao, T., Mandrini, C. H., Hara, H., Imada, S., Young, P. R., van Driel-Gesztelyi, L., & Baker, D. 2008, ApJ, 676, L147
- Klimchuk (2006) Klimchuk, J. A. 2006, Sol. Phys., 234, 41
- Kosugi et al. (2007) Kosugi, T., et al. 2007, Sol. Phys., 243, 3
- Martens et al. (2000) Martens, P. C. H., Kankelborg, C. C., & Berger, T. E. 2000, ApJ, 537, 471
- Patsourakos & Klimchuk (2008) Patsourakos, S., & Klimchuk, J. A. 2008, ApJ, 689, 1406
- Sakao et al. (2007) Sakao, T., et al. 2007, Science, 318, 1585
- Shimizu et al. (2007) Shimizu, T., et al. 2007, PASJ, 59, 845
- Tripathi et al. (2008) Tripathi, D., Mason, H. E., Young, P. R., & Del Zanna, G. 2008, A&A, 481, L53
- Ugarte-Urra et al. (2009) Ugarte-Urra, I., Warren, H. P., & Brooks, D. H. 2009, ApJ, 695, 642
- Warren & Winebarger (2006) Warren, H. P., & Winebarger, A. R. 2006, ApJ, 645, 711
- Warren & Winebarger (2007) Warren, H. P., & Winebarger, A. R. 2007, ApJ, 666, 1245
- Warren et al. (2008) Warren, H. P., Winebarger, A. R., Mariska, J. T., Doschek, G. A., & Hara, H. 2008, ApJ, 677, 1395
- Young et al. (2009) Young, P. R., Watanabe, T., Hara, H., & Mariska, J. T. 2009, A&A, 495, 587