The Relation between EIT Waves and Coronal Mass Ejections
Abstract
More and more evidence indicates that “EIT waves” are strongly related to coronal mass ejections (CMEs). However, it is still not clear how the two phenomena are related to each other. We investigate a CME event on 1997 September 9, which was well observed by both EUV imaging telescope (EIT) and the high-cadence MK3 coronagraph at Mauna Loa Solar Observatory, and compare the spatial relation between the “EIT wave” fronts and the CME leading loops. It is found that “EIT wave” fronts are co-spatial with the CME leading loops, and the expanding EUV dimmings are co-spatial with the CME cavity. It is also found that the CME stopped near the boundary of a coronal hole, a feature common to observations of “EIT waves”. It is suggested that “EIT waves”/dimmings are the EUV counterparts of the CME leading loop/cavity, based on which we propose that, as in the case of “EIT waves”, CME leading loops are apparently-moving density enhancements that are generated by successive stretching (or opening-up) of magnetic loops.
1 Introduction
As the largest-scale eruptive phenomenon on the Sun, coronal mass ejections (CMEs) are often accompanied by many other phenomena, which are visible in various wavelengths, such as solar flares, filament eruptions, and “EIT waves”. Among them, “EIT waves” are extremely enigmatic. They have attracted wide attention and provoked a lot of debate concerning their physical nature. The first reports of the phenomenon appeared in Dere et al. (1997) and Moses et al. (1997). Thompson et al. (1998) analyzed the famous 1997 May 12 event in detail using the data from the EUV Imaging Telescope (EIT) on board the Solar and Heliospheric Observatory (SOHO) spacecraft. In association with the CME event, the running difference images of the EIT data showed that an almost circular bright front, with an averaged intensity enhancement of (Thompson et al., 1999), propagates away from the source active region, giving an impression of a wave. They were conventionally called “EIT waves” since they were discovered with the EIT telescope, though sometimes they are referred to as “coronal waves” (Warmuth et al., 2004; Attrill et al., 2007; Tripathi & Raouafi, 2007).
As “EIT waves” propagate outward, they are immediately followed by expanding dimmings. Therefore, the two phenomena were proposed to result from the same physical process, which was very controversial during the past years (e.g., Chen, 2008). One debate concerns the driving source of the wave propagation. It was quite often claimed that “EIT waves” are generated by the pressure pulse which may be a solar flare (e.g., Wu et al., 2001; Vršnak et al., 2002), whereas Plunkett et al. (1998), Delannée & Aulanier (1999), Chen et al. (2002), and Chen, Fang, & Shibata (2005) proposed that they are associated with CMEs. Biesecker et al. (2002) studied 173 events and found that after correcting for observational biases all EIT waves are associated with CMEs. Noticing that about half of the “EIT waves” observed from 1997 March to 1998 June were associated with small solar flares below C class, Cliver et al. (2005) pointed out that it is hard to imagine that such weak flares can produce global-scale perturbations, so that “EIT waves” should be preferentially associated with CMEs. As a complementary proof, Chen (2006) selected strong (M- and X-class) flares near solar minimum that were not associated with CMEs, and found that none of them produced “EIT waves”. Furthermore, Chen (2006) showed that from the same active region within the same day, a weaker flare with a CME was associated with an “EIT wave”, however, another stronger flare without a CME was not accompanied by an “EIT wave”. In addition, Podladchikova & Berghmans (2005) and Attrill et al. (2007) found that EIT waves rotate in senses determined by the helicity of the CME source region, a feature not expected from flare-induced waves. These pose strong evidence to support that “EIT waves” are purely related to CMEs. However, the physical connection between “EIT waves” and CMEs is still not well established. Veronig et al. (2008) proposed that “EIT waves” are fast-mode waves driven by CME flanks, while Chen & Fang (2005) theoretically postulated that “EIT wave” fronts are the EUV signature of the CME leading loops, and accordingly, the expanding EUV dimmings are the EUV signature of the CME cavity. With the data analysis of the CME event on 1997 September 9, this Letter aims to clarify the connection between “EIT waves” and CMEs.
2 Observations
“EIT waves” are observed by EUV imaging telescopes like EIT, with a field of view (FOV) of . Before the launch of the recent STEREO satellites, CMEs were mostly observed by three coronagraphs (C1, C2, and C3) in the Large Angle and Spectrometric Coronagraph (LASCO), which are on board the SOHO spacecraft. The white-light coronagraphs C2 and C3, which observe the coronal mass directly, have a FOV beyond . Therefore, the comparison of the observations between them and EIT relies on spatial extrapolation, which introduces uncertainties. The C1 coronagraph has a FOV from , which overlaps with that of EIT. However, during its short lifetime, it was often observing the corona with the forbidden lines, whose intensity depends not only on the coronal density, but also on the temperature. Therefore, their structure may not necessarily be co-spatial with the white-light CME. In order to precisely determine the spatial relation between “EIT wave” fronts and CMEs, we study ground-based coronagraph white-light data with a FOV overlapping that of EIT.
Thompson & Myers (2009) compiled a catalog of 176 “EIT wave” events that occurred between 1997 March and 1998 June. In order to compare the “EIT wave” fronts and CMEs, we selected those “EIT wave” events that have fronts appearing above the solar limb. It is found that 38 cases in the catalog are off-limb events. We then search for the white-light data from the Mark-III K-Coronameter (MK3), which was installed at the Mauna Loa Solar Observatory (MLSO). It turned out that only the 1997 September 9 event was well observed by the MK3 coronagraph. The “EIT wave” propagation was observed by the EIT instrument, and the CME was observed by both the ground-based coronagraph MK3 and the space-borne LASCO instrument.
The EIT instrument is a normal-incidence, multilayer EUV telescope (Delaboudinière et al., 1995). It observes the full-disk solar corona, extending up to with a pixel size of . There are four narrow bandpass EUV channels centered at 171, 195, 284, and 304 Å, which selectively observe spectral lines formed by Fe IX/X, Fe XII, Fe XII, and He II, respectively. The Fe XII 195 Å images used in this paper have a cadence of min. The Fe XII emission line exhibits a peak emission near 1.5 MK. The LASCO instrument consists of a set of three coronagraphs, i.e., C1, C2, and C3, with overlapping and concentric FOV. C2 and C3 are traditional white-light coronagraphs that observe Thomson-scattered visible light through a broadband filter (Brueckner et al., 1995). The MK3 coronagraph at MLSO began observations in 1980 (MacQueen & Fisher, 1983). It measures polarization brightness of photospheric radiation scattered by free electrons in the lower corona, with a FOV of , a pixel size of , and a cadence of 3 min.
3 Results
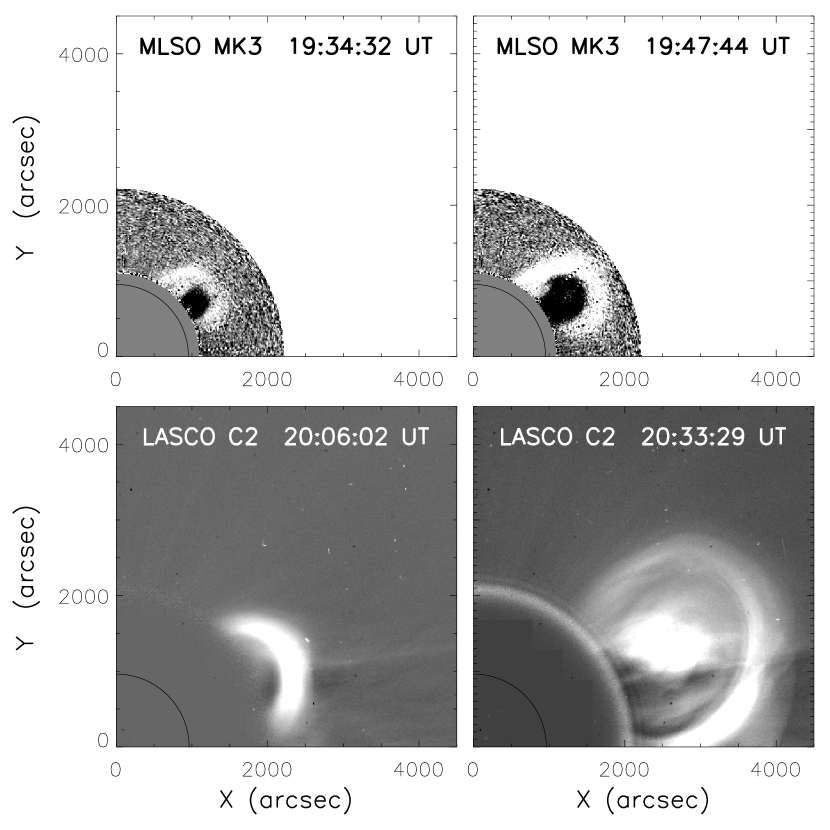
The leading loop of the CME was visible in the FOV of the MK3 coronagraph from 19:34:32 UT on 1997 September 9. The data before that were not of high enough quality to clearly show the structure of the CME. The upper panels of Figure 1 display the white-light base-difference images of the CME, which were observed by MK3. The pre-event intensity map at 19:04:11 UT is chosen as the base image that is subtracted from the later images. The high-cadence observations of MK3 indicated that the CME leading loop accelerated from 14636 km s-1 at 19:34:32 UT to 36636 km s-1 at 19:47:44 UT, after which the top of the leading loop went out of the FOV of the MK3. At 20:06:02 UT, the CME began to be visible in the FOV of the LASCO C2 coronagraph at , as seen from the lower panels of Figure 1. At 20:33:29 UT, the CME leading loop moved to a heliocentric distance of in the plane-of-the-sky. The averaged radial speed of the CME propagation is estimated to be 72620 km s-1 in the FOV of LASCO C2, which is almost twice that measured in the FOV of the MK3.
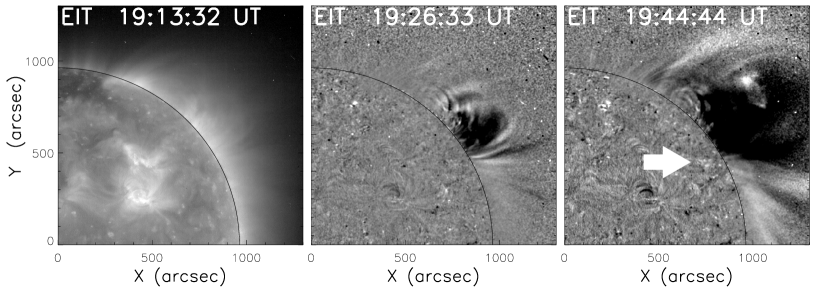
As the CME lifted off, no flare-like brightening was visible on the solar disk, inferring that the source region of this CME event was located behind the solar limb. However, the full-disk imager, EIT, detected the propagation of an “EIT wave”, as revealed by the middle and right panels of Figure 2. In this figure, the left panel shows the pre-event Fe XII 195 Å image, and the middle and right panels depict the evolution of the base-difference 195 Å images. It is seen that the main part of the “EIT wave” was above the limb, extending beyond the FOV of EIT, with some weak brightenings on the solar disk as indicated by the white arrow in the right panel. As revealed by the left panel of Figure 2, a polar coronal hole existed on the northern side of the “EIT wave”. The northern leg of the “EIT wave” was approaching the coronal hole from 19:26:33 UT to 19:44:44 UT, after which it stopped near the boundary of the coronal hole.
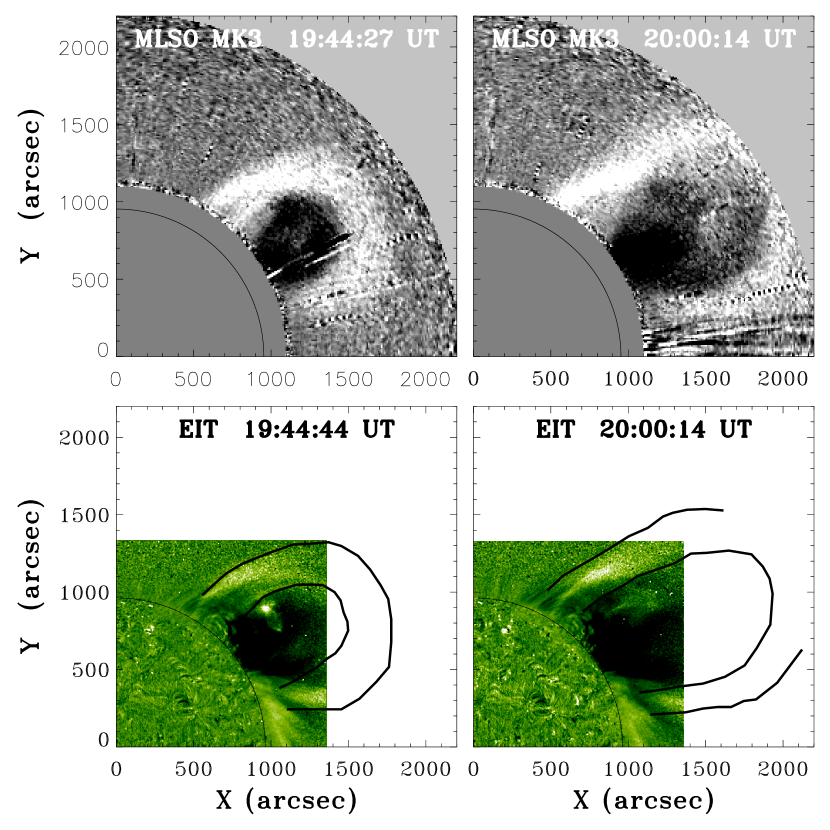
Owing to the high cadence of the MK3 observations, the spatial positions of the white-light CME and the “EIT wave” can be compared directly when the two phenomena were observed almost simultaneously. The white-light images of the CME at 19:44:27 UT and 20:00:49 UT are displayed in the upper panels of Figure 3, and the corresponding EIT 195 Å images at 19:44:44 UT and 20:00:14 UT are shown in the lower panels. For clearness, the outlines of the white-light CME leading loops (defined by eye) in the upper left and right panels are superimposed on the EIT Fe XII intensity map in the lower left and right panels, respectively, as represented by the thick black lines. It is seen that the “EIT wave” fronts above the limb are almost co-spatial with the leading loop of the CME, with slight differences in the detailed structures. Accordingly, the EIT dimmings are co-spatial with the white-light cavity of the CME. Note that there is a small time difference in the white-light and EUV observations (35 s). Considering that the top of the CME leading loop was moving with a speed of 36636 km s-1 in the FOV of the MK3, such a time difference corresponds to a spatial shift of , which is below the spatial resolution of the MK3 coronagraph.
4 Discussions
4.1 Spatial Relation between “EIT Waves” and CMEs
More and more evidence tends to support that “EIT waves” are related to CMEs, rather than solar flares. However, exactly how “EIT waves” are related to CMEs is still not clear. The simultaneous observations of an “EIT wave” in Fe XII 195 Å and a white-light CME in the 1997 September 9 event provide a precious opportunity to tackle this question.
The source region of the eruption was located behind the solar limb, hence the “EIT wave” was observed as a limb event, which allows the direct comparison with coronagraph data. Our analysis in Section 3 (see Figure 3) indicates that the “EIT wave” fronts were almost co-spatial with the leading loops of the CME during the eruption, and the expanding EUV dimmings, which immediately followed the “EIT wave” fronts, were co-spatial with the dark cavity of the CME.
The brightening of the “EIT wave” fronts in Fe XII 195 Å might be due to temperature variation and/or density enhancement (Thompson et al., 1999). Therefore, it is controversial whether the brightening is mainly contributed by temperature variation (e.g., due to Joule heating, Delannée et al., 2008) or by density enhancement (Wills-Davey & Thompson, 1999). Considering that “EIT waves” are observed simultaneously in several EUV lines that have different formation temperatures (Wills-Davey & Thompson, 1999; Long et al., 2008), it is believed that the “EIT wave” brightening is mainly due to density enhancement, though the adiabatic compression may increase the plasma temperature to some extent, resulting in some differences between detailed features in different lines (Wills-Davey & Thompson, 1999; Chen & Fang, 2005). The approximate co-spatiality of “EIT wave” fronts and white-light CME leading loops, as revealed by Figure 3, provides direct evidence that “EIT wave” brightenings are mainly contributed by density enhancement, since the white-light enhancement of the CME leading loops is produced by the increased coronal density only. Therefore, we conclude that “EIT wave” fronts are mainly due to density enhancement, and they are the EUV signatures of the CME leading loops, as we theoretically proposed in Chen & Fang (2005). It is also inferred that, similar to the frequently assumed dome-like shape of CME leading loops, the “EIT wave” front should also be dome-like, and the circular “EIT wave” fronts, sometimes observed on the solar disk, are just a projection of the three-dimensional dome-like structure, whose skirt is much brighter than the top of the dome.
4.2 Nature of CME Leading Loop
The physics behind the formation of CME leading loops is still not clear. It is often taken for granted that we observe coronal plasma embedded in the erupting magnetic loops. However, with UV spectral observations of halo CMEs, Ciaravella et al. (2006) found that the CME fronts show Doppler shifts significantly smaller than their apparent velocity obtained with white-light coronagraphs, suggesting that CME leading loops (at least for the halo events), might be fast-mode shocks rather than being plasma carried outward by erupting magnetic loops. The co-spatiality of “EIT waves” and CME leading loops found in this Letter could also shed light on the nature of the CME leading loops.
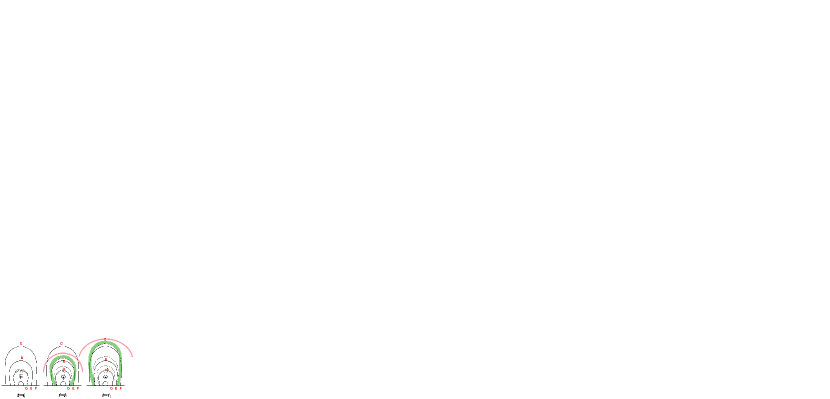
“EIT waves” are often considered to be fast-mode magnetoacoustic waves in the corona (e.g., Wang, 2000; Wu et al., 2001; Vršnak et al., 2002; Warmuth et al., 2004; Grechnev et al., 2008; Pomoell et al., 2008). However, the wave model cannot explain the following features of “EIT waves” (e.g., see Wills-Davey et al., 2007; Chen, 2008, for details): (1) the “EIT wave” velocity is significantly smaller than those of Moreton waves. The latter are well established to be due to fast-mode waves in the corona; (2) The “EIT wave” velocities have no correlation with those of type II radio bursts (Klassen et al., 2000); (3) The “EIT wave” fronts may stop when they meet with magnetic separatrices (Delannée & Aulanier, 1999); (4) The “EIT wave” velocity may be below 100 km s-1 (e.g., the Fig. 3 of Long et al., 2008), which is even smaller than the sound speed in the corona. These strange features provoked Delannée & Aulanier (1999) to relate “EIT waves” to magnetic restructuring during CMEs. With MHD numerical simulations, Chen et al. (2002; 2005) identified the “EIT wave” features to correspond to stretching of the magnetic field. The “EIT wave” disturbance was observed well behind the fast-mode piston-driven shock waves during CME eruptions. Chen et al. (2002; 2005) proposed that “EIT waves” are apparently-moving density enhancements, which are actually produced by successive stretching (or opening-up) of closed field lines, rather than being real waves. The model can account for the main characteristics of “EIT waves”, such as the low velocity, their diffuse fronts, the stationarity near magnetic separatrices, and found support in observations (e.g., Harra & Sterling, 2003). The co-spatiality of “EIT waves” and CME leading loops found in this paper would infer that CME leading loops are also generated by the successive stretching of overlying magnetic loops. As illustrated by Figure 4, as the core structure, e.g., a magnetic flux rope, erupts, the resulting perturbation propagates outward in every direction, with a probability of forming a piston-driven shock as indicated by the pink lines. However, different from a pressure pulse, the erupting flux rope continues to push the overlying magnetic field lines to move outward, so that the field lines are stretched outward one by one. For each field line, the stretching starts from the top, e.g., point A for the first magnetic line, and then is transferred down to the leg (point D) with the Alfvén speed. The deformation at point A is also transferred upward to point B of the second magnetic line with the fast-mode speed. Such a deformation would also be transferred down to its leg (point E) with the local Alfvén speed, by which the entire second magnetic line is stretched up. The stretching at any part of the magnetic field lines compresses the coronal plasma on the outer side, producing density enhancements. All the newly formed density enhancements form a pattern (green), which is observed as the CME leading loop. Similar to “EIT wave” fronts, the legs of the CME leading loop separate initially, and may stop when they meet with magnetic separatrices such as the boundary of coronal holes. This is why CMEs generally maintain a fixed angular span in their later stages. At the same time, as the field lines are stretched outward, the enveloped volume increases, resulting in coronal dimmings (or the dark cavity) behind the CME leading loop.
To conclude, with the simultaneous observations of an “EIT wave” in Fe XII 195 Å and a CME in white light, we found that “EIT wave” fronts are co-spatial with CME leading loops, and accordingly, expanding EUV dimmings are co-spatial with the CME cavity. We postulate that the CME leading loops may have the same formation mechanism and physical nature as “EIT waves”, i.e., they are the apparently-moving density enhancements that are generated by successive stretching (or opening-up) of magnetic loops. It is noted that in other “EIT wave” models like the reconnection model of Attrill et al. (2007), the “EIT wave” front is also expected to be co-spatial with the CME leading loop. The difference between these models should be explored further.
References
- Attrill et al. (2007) Attrill, G. D. R., Harra, L. K., van Driel-Gesztelyi, L., & Démoulin, P. 2007, ApJ, 656, L101
- Biesecker et al. (2002) Biesecker, D. A., Myers, D. C., Thompson, B. J. et al. 2002, ApJ, 569, 1009
- Brueckner et al. (1995) Brueckner, G. E., et al. 1995, Sol. Phys., 162, 357
- Chen (2006) Chen, P. F. 2006, ApJ, 641, L153
- Chen (2008) Chen, P. F. 2008, J. of Astrophys. Astron., 29, 179
- Chen & Fang (2005) Chen, P. F. & Fang, C. 2005, IAU Symp., 226, 55
- Chen, Fang, & Shibata (2005) Chen, P. F., Fang, C., & Shibata, K. 2005, ApJ, 622, 1202
- Chen et al. (2002) Chen, P. F., Wu, S. T., Shibata, K., & Fang, C. 2002, ApJ, 572, L99
- Ciaravella et al. (2006) Ciaravella, A., Raymond, J. C., & Kahler, S. W. 2006, ApJ, 652, 774
- Cliver et al. (2005) Cliver, E. W., Laurenza, M., Storini, M. & Thompson, B. J. 2005, ApJ, 631, 604
- Delaboudinière et al. (1995) Delaboudiniére, J.-P. et al. 1995, Sol. Phys., 162, 291
- Delannée & Aulanier (1999) Delannée, C. & Aulanier, G. 1999, Sol. Phys., 190, 107
- Delannée et al. (2008) Delannée, C., Török, T., Aulanier, G., & Hochedez, J.-F. 2008, Sol. Phys., 247, 123
- Dere et al. (1997) Dere, K. P., et al. 1997, Sol. Phys., 175, 601
- Grechnev et al. (2008) Grechnev, V. V., Uralov, A. M., Slemzin, V. A. et al. 2008, Sol. Phys., 253, 263
- Harra & Sterling (2003) Harra, L. K. & Sterling, A. C. 2003, ApJ, 587, 429
- Klassen et al. (2000) Klassen, A., Aurass, H., Mann, G., & Thompson, B. J. 2000, A&AS, 141, 357
- Long et al. (2008) Long, D. M., Gallagher, P. T., McAteer, R. T. J., & Bloomfield, D. S. 2008, ApJ, 680, L81
- MacQueen & Fisher (1983) MacQueen, R. M., & Fisher, R. R. 1983, Sol. Phys., 89, 89
- Moses et al. (1997) Moses, D., et al. 1997, Sol. Phys., 175, 571
- Plunkett et al. (1998) Plunkett, S. P. et al. 1998, Geophys. Res. Lett., 25, 2477
- Podladchikova & Berghmans (2005) Podladchikova, O., & Berghmans, D. 2005, Sol. Phys., 228, 265
- Pomoell et al. (2008) Pomoell, J., Vainio, R., & Kissmann, R. 2008, Sol. Phys., 253, 249
- Thompson et al. (1999) Thompson, B. J., Gurman, J. B., Neupert, W. M. et al. 1999, ApJ, 517, L151
- Thompson & Myers (2009) Thompson, B. J. & Myers, D. C. 2009, ApJS, in press
- Thompson et al. (1998) Thompson, B. J., Plunkett, S. P., Gurman, J. B. et al. 1998, Geophys. Res. Lett., 25, 2465
- Tripathi & Raouafi (2007) Tripathi, D., & Raouafi, N.-E. 2007, A&A, 473, 951
- Veronig et al. (2008) Veronig, A. M., Temmer, M., & Vršnak, B. 2008, ApJ, 681, L113
- Vršnak et al. (2002) Vršnak, B., Warmuth, A., Brajša, R., & Hanslmeier, A. 2002, A&A, 394, 299
- Warmuth et al. (2004) Warmuth, A., Vršnak, B., Magdalenić, J., Hanslmeier, A., & Otruba, W. 2004, A&A, 418, 1117
- Wills-Davey et al. (2007) Wills-Davey, M. J., DeForest, C. E., & Stenflo, J. O. 2007, ApJ, 664, 556
- Wills-Davey & Thompson (1999) Wills-Davey M. J. & Thompson, B. J. 1999, Sol. Phys., 190, 467
- Wang (2000) Wang, Y. -M. 2000, ApJ, 543, L89
- Wu et al. (2001) Wu, S. T., Zheng, H. N., Wang, S. et al. 2001, J. Geophys. Res., 106, 25089