e-VLBI observations of GHz-Peaked Spectrum (GPS) radio sources in nearby galaxies from the AT20G survey
Abstract
GHz-peaked spectrum (GPS) radio sources are thought to be young objects which later evolve into FR-I and FR-II radio galaxies. We have used the Australia Telescope 20 GHz (AT20G) survey catalogue to select a uniform sample of GPS sources with spectral peaks above 5 GHz, which should represent the youngest members of this class. In this paper, we present e-VLBI observations of ten such objects which are associated with nearby () galaxies and so represent a new population of local, low–power GPS sources. Our e-VLBI observations were carried out at 4.8 GHz with the Australia Telescope Long Baseline Array (LBA) using a real–time software correlator. All ten sources were detected, and were unresolved on scales of 100 mas, implying that they are typically less than 100 pc in linear size.
keywords:
AGN, GPS, Radio Galaxy Evolution1 Introduction
Gigahertz-Peaked Spectrum (GPS) radio sources are characterized by a spectral peak and turnover at frequencies above 1 GHz. They were identified as early as 1966 (Kellerman 1966), and are thought to be the progenitors of large radio galaxies (O’Dea 1998). The spectral turnover is usually attributed to synchrotron self–absorption, although free–free absorption plays a role in some sources (Tingay & de Kool 2003, Vermeulen et al. 2003).
Interactions between the central AGN and its host galaxy are especially important in the younger sources, as the host ISM plays a large role in the evolution of the radio source. In the evolutionary scenario (Snellen et al. 2000), the peak of the radio spectrum progressively moves toward lower frequencies as the source evolves. Most current samples of GPS sources are dominated by sources which peak below 5 GHz, and so are either at large redshift or have moved beyond the earliest stages of evolution.
Recently two very nearby ( Mpc) galaxies, NGC 1052 (Vermeulen et al. 2003) and IC 1459 (Tingay, Edwards & Tzioumis 2003) have been shown to be GPS radio sources. The turnover frequency of the overall spectrum is close to 2.5 GHz for IC 1459 and 10 GHz for NGC 1052. The radio sources within these galaxies are relatively low–powered ( W Hz-1 at 5 GHz) compared to the ensemble of known GPS sources, which have typical radio powers above W Hz-1.
Both NGC 1052 and IC 1459 (in common with the only other known GPS radio source within 100 Mpc, PKS 1718–649) show strong LINER-like emission lines in their optical spectra and have complex gas kinematics in their nuclear regions, which may suggest that the galaxy has undergone a recent interaction or gas accretion event. Franx and Illingworth (1988) note that IC 1459 has a counter-rotating stellar core, which is also postulated to have formed as the result of a galaxy merger.
The GPS radio sources in both NGC 1052 and IC 1459 are strongly jet–dominated on parsec scales, in contrast to the majority of more distant and luminous GPS radio galaxies where the radio emission is dominated by what appear to be the small–scale analogues of radio–galaxy hotspots. This raises the possibility that there exists a luminosity/morphology relationship in GPS radio galaxies, similar to that seen on much larger scales in FR-I and FR-II radio galaxies (Fanaroff & Riley 1974).
While the interpretation of NGC 1052 is unclear, since the radio source shows the presence of large-scale hotspots indicating that the radio source is not young, it could be classified as a restarted radio source. IC 1459, however, has no large-scale structure and could be interpreted as a young radio source. The apparently two-sided nature of the pc-scale jets in IC 1459 (Sokolova et al. 2009, in preparation) does not favour a highly aligned jet as an explanation for the lack of large-scale structure.
When investigating GPS radio sources it is important to recognize the potential for contamination from variable sources whose peaked spectrum is not at all related to the evolution of young radio galaxies. Less than 10% of the QSOs identified as GPS sources in the literature retain their classification when subjected to long term monitoring and simultaneous spectral measurements (Torniainen et al. 2005). Similarly–selected galaxy type GPS samples are more reliable with % identified as genuine GPS sources (Torniainen et al. 2007). In each case the contamination rate is seen to increase as the spectral peak shifts to higher frequencies.
To investigate the parsec-scale properties of GPS radio sources at the lowest luminosities further, we have used the high-frequency AT20G survey (Ricci et al. 2004; Sadler et al. 2006, Massardi et al. 2008) to construct a uniform sample of GPS sources with high–frequency ( GHz) spectral turnovers, low redshift () and low radio power (P W/Hz). To avoid as much as possible the contamination from sources unrelated to the evolutionary scenario, we selected only sources that are identified with galaxies. The source names refered to in this paper are drawn from the AT20G survey. In this paper, we present observations from the Australian e-VLBI network at 100 mas resolution as a first step in measuring the angular sizes and structures of these nearby high-frequency GPS sources.
We use the following cosmological values throughout this paper: , , and .
2 Target Selection
2.1 Selecting high-frequency GPS sources
The AT20G full-sample data release (Murphy et al. 2009, in preparation) provides near-simultaneous flux–density measurements at 4.8, 8.6 and 20 GHz for most AT20G sources south of declination . This is important in allowing us to identify candidate GPS sources without the problem of variability giving a false spectral shape.
We selected our high–frequency GPS sample from the 3800 AT20G sources which had good–quality data at all three frequencies, since this gives us enough spectral information to identify an inverted or peaked spectrum. All the AT20G sources observed at 5 and 8 GHz were detected at these frequencies, so there are no upper limits in the AT20G sample. AT20G sources whose radio spectrum peaked above 5 GHz, or rose with frequency over the whole 5–20 GHz range111Sadler et al. (2008) found that almost all AT20G sources with rising (‘inverted’) spectra at 5–20 GHz show a spectral turnover between 20 and 95 GHz, so we are confident that most of the “inverted–spectrum” AT20G sources will be high-frequency peaking GPS objects. were flagged as GPS candidates. This yielded a final list of 656 candidate high–frequency GPS sources with spectral peaks above 5 GHz (Hancock 2009). The 1.4 GHz NVSS (Condon et al. 1998) and 843 MHz SUMSS (Mauch et al. 2003) catalogues were also used to search for low–frequency emission from the AT20G GPS sources.
2.2 Optical identification
We cross–matched our AT20G GPS sample with the optical SuperCOSMOS catalogue (Hambly et al. 2001) to search for optical counterparts. Roughly 70% of our AT20G GPS sample (465/656) had an optical identification above the SuperCOSMOS plate limit. Of these 23% were classified as galaxies by SuperCOSMOS and 77% were stellar objects, which are expected to be QSOs. This is consistent with the finding of Stanghellini (2003) that GPS populations contain many flat-spectrum radio QSOs.
2.3 A complete sample of nearby GPS radio galaxies
Since our interest here is in the GPS radio sources associated with nearby galaxies, we considered only the 100 AT20G GPS sources which were identified with SuperCOSMOS galaxies. A radio–optical identification was accepted if the two positions differed by less than 5 arcsec. Redshifts for these objects were obtained from the 6dF Galaxy Survey (6dFGS; Jones et al. 2004) and from the wider literature via the NED online database222http://nedwww.ipac.caltech.edu/.
Only about 25% of the AT20G GPS galaxies currently have redshift information, and further redshift measurements are in progress. Using the currently-available redshift data, we identified a sample of 28 GPS radio sources which were associated with nearby (redshift ) galaxies. All of these had 5 GHz radio powers below W Hz-1. Ten of the galaxies from this sample (listed in Table 1) were observed in our March 2008 eVLBI run. The low–frequency properties of these sources are summarized in Table 2.
| Name | AT20G position | z | log P5 | Alt. | ||||||||
|---|---|---|---|---|---|---|---|---|---|---|---|---|
| AT20G | J2000 | mag | mJy | mJy | mJy | WHz-1 | GHz | name | ||||
| (1) | (2) | (3) | (4) | (5) | (6) | (7) | (8) | (9) | (10) | (11) | (12) | |
| J031010573041 | 03 10 10.6 | 57 30 41.3 | 13.1 | 0.082 | 45 | 73 | 89 | 0.82 | 0.48 | 23.8 | 20 | ESO 116-G10 |
| J051103255450 | 05 11 03.8 | 25 54 51.0 | 12.2 | 0.092 | 92 | 113 | 122 | 0.35 | 0.20 | 24.2 | 20 | PMN J05112554 |
| J054828331331 | 05 48 28.5 | 33 13 31.5 | 12.9 | 0.040 | 31 | 38 | 52 | 0.35 | 0.36 | 23.0 | 20 | … |
| J074618570258 | 07 46 18.7 | 57 02 58.6 | … | 0.130 | 47 | 63 | 94 | 0.50 | 0.49 | 24.2 | 20 | SGRS J07465702 |
| J091856243829 | 09 18 56.5 | 24 38 29.5 | 14.4 | 0.056 | 48 | 51 | 64 | 0.10 | 0.20 | 23.5 | 20 | … |
| J114503325824 | 11 45 03.5 | 32 58 24.2 | 10.5 | 0.038 | 69 | 91 | 75 | 0.47 | 0.06 | 23.3 | 10 | … |
| J130031441442 | 13 00 31.1 | 44 14 42.6 | 10.5 | 0.032 | 68 | 104 | 77 | 0.72 | 0.09 | 23.2 | 10 | AM 1257435 |
| J181857550815 | 18 18 58.0 | 55 08 15.2 | 11.4 | 0.072 | 42 | 53 | 74 | 0.41 | 0.40 | 23.7 | 20 | … |
| J220916471000 | 22 09 16.3 | 47 10 00.3 | 7.1 | 0.005 | 136 | 161 | 122 | 0.29 | 0.07 | 21.8 | 10 | NGC 7213 |
| J224506433157 | 22 45 06.0 | 43 31 57.3 | 13.0 | 0.068 | 74 | 90 | 84 | 0.33 | 0.09 | 23.9 | 10 | … |
| Name | SSUMSS | SNVSS | log P1.4 |
|---|---|---|---|
| AT20G | mJy | mJy | WHz-1 |
| J031010573041 | 37.3 1.5 | … | 23.8 |
| J051103255450 | … | 44.1 1.7 | 24.0 |
| J054828331331 | 10 | 6.0 0.5 | 22.3 |
| J074618570258 | 194.0 11.0 | … | 24.8 |
| J091856243829 | … | 55.6 1.7 | 23.6 |
| J114503325824 | 39.7 2.2 | 31.5 1.1 | 23.0 |
| J130031441442 | 26.9 1.3 | … | 22.9 |
| J181857550815 | 627.7 21.2 | … | 24.7 |
| J220916471000 | 119.6 3.8 | … | 21.8 |
| J224506433157 | 38.7 1.5 | … | 23.7 |
3 Observations
The targets listed in Table 1 were observed using the new e-VLBI capability of the Long Baseline Array (LBA, Tzioumis 1997) in March 2008, at a frequency of 4.8GHz. The LBA stations used were the Parkes observatory (64 m dish), ATCA (six 22 m dishes as a tied array), and the Mopra antenna (22m) of the ATNF. The data were correlated in real time at Parkes using a Distributed FX (DiFX) correlator developed by Deller et. al (2007).
The observations were arranged as a series of 5 minute integrations per source, cycling through those sources that were above the horizon at any time. In this way, a typical ensemble of observations for an individual source consisted of approximately 10 5 minute integrations, over a 12 hour period. A typical coverage is shown in figure 1. These data were reduced using standard VLBI data reduction and imaging techniques implemented in AIPS333The Astronomical Image Processing System (AIPS) was developed and is maintained by the National Radio Astronomy Observatory, which is operated by Associated Universities, Inc., under co-operative agreement with the National Science Foundation and DIFMAP (Shepherd 1994). The observations utilised phase-referencing techniques via observations of bright, compact calibration sources nearby to each target, for calibration of the interferometer phase, enhancing the coherence time of the visibilities and allowing the detection of fainter targets.
The typical one sigma image sensitivity derived from these datasets is approximately 1 mJy/beam. The angular resolution varies with source declination but is typically approximately 100 mas.

| Name | eVLBI position | z | MK | Scale | LAS | LLS | SVLBI | SAT20G | Flux ratio | ||
|---|---|---|---|---|---|---|---|---|---|---|---|
| AT20G | J2000 | arcsec | mag | kpc/” | arcsec | pc | mJy | mJy | e-VLBI/AT20G | ||
| (1) | (2) | (3) | (4) | (5) | (6) | (7) | (8) | (9) | (10) | (11) | |
| J031010573041 | 03 10 10.6 | 57 30 41.68 | 0.1 | 0.082 | 1.54 | 0.13 | 200 | 36.5 | 45 | 0.81 | |
| J051103255450 | 05 11 03.8 | 25 54 49.96 | 0.5 | 0.092 | 1.71 | 0.11 | 188 | 47.2 | 92 | 0.51 | |
| J054828331331 | 05 48 28.5 | 33 13 30.00 | 1.1 | 0.040 | 0.80 | 0.09 | 72 | 24.5 | 31 | 0.79 | |
| J074618570258 | 07 46 18.6 | 57 02 58.21 | 0.0 | 0.130 | … | 2.29 | 0.05 | 114 | 62.2 | 47 | 1.32 |
| J091856243829∗ | 09 18 56.5 | 24 38 29.39 | 3.7 | 0.056 | 1.07 | 0.06 | 64 | 46.2 | 48 | 0.96 | |
| J114503325824 | 11 45 03.5 | 32 58 23.48 | 0.3 | 0.038 | 0.74 | 0.05 | 37 | 62.9 | 69 | 0.91 | |
| J130031441442 | 13 00 31.0 | 44 14 41.51 | 0.2 | 0.032 | 0.63 | 0.06 | 38 | 58.6 | 68 | 0.86 | |
| J181857550815 | 18 18 58.0 | 55 08 15.30 | 0.3 | 0.072 | 1.35 | 0.06 | 81 | 47.9 | 42 | 1.14 | |
| J220916471000 | 22 09 16.2 | 47 10 00.25 | 0.5 | 0.005 | 0.10 | 0.15 | 15 | 120.6 | 136 | 0.89 | |
| J224506433157 | 22 45 06.0 | 43 31 57.44 | 0.1 | 0.068 | 1.29 | 0.20 | 258 | 56.5 | 74 | 0.76 | |
4 Results
Figure 2 shows a typical e-VLBI image of one of the sources in Table 1, all of which were unresolved on scales of 200 mas or less.
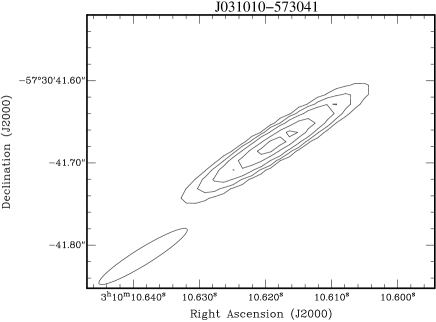
Table 3 lists the maximum angular size of each source as measured from the images using the MIRIAD task IMFIT. An e-VLBI position is also listed for each source along with the 4.8 GHz flux density measured from the e-VLBI ( arcsec beam) and AT20G ( arcsec beam) images. The uncertainty in the the e-VLBI positions is dominated by the phase referencing of the calibration source, and is typically 10 mas in RA and DEC. Note that the AT20G and e-VLBI flux-density measurements are not simultaneous and were made up to three years apart.
The mean flux ratio (SVLBI/SAT20G) is 0.90 with a standard deviation of 0.22. If we exclude the source J051103255450, which appears to be variable (see SS4.1.2 below), the mean flux ratio rises to 0.94 and the standard deviation drops to 0.18. These results suggest that (i) the nearby AT20G GPS sources are compact, with 90% of their 4.8 GHz emission arising on scales smaller than 100–200 pc, and (ii) most of these sources show only modest variability at 4.8 GHz on timescales of 1–3 years.
4.1 Notes on individual sources
4.1.1 AT20G J031010573041
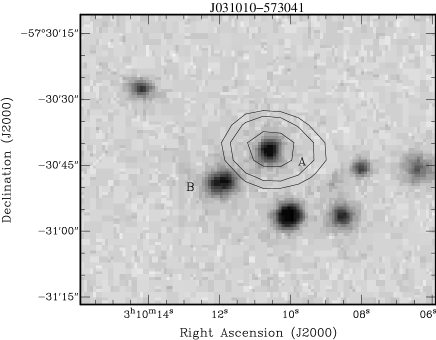
The optical counterpart of this radio source is a member of a compact group of galaxies (Figure 3). No redshift has been measured for the host galaxy (object A in Figure 3), so we adopt the measured 6dFGS redshift of for the companion galaxy as the redshift of the whole group. None of the other galaxies in this group has a redshift measurement.
4.1.2 AT20G J051103255450
This source was detected in the PMN survey (Griffith et al. 1994) with a flux density of 5311 mJy in the 4 arcmin Parkes beam at 4.8GHz. This is significantly lower than the AT20G value of 924 mJy (in a 15 arcsec beam), suggesting that the source may be variable. The 6dFGS spectrum shows absorption lines typical of an early–type galaxy but no obvious optical emission lines.
4.1.3 AT20G J054828331331
The 6dFGS spectrum shows absorption lines together with possible weak [O III] emission. There is a faint NVSS source associated with this object (see Table 2), but it lies below the limit of the 843 MHz SUMSS catalogue.
4.1.4 AT20G J074618570258
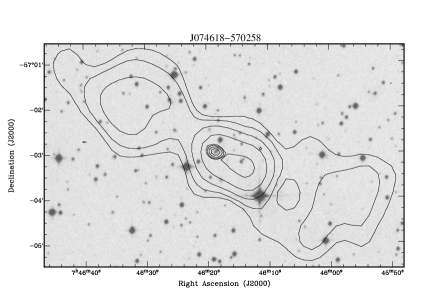
This radio source has been identified by Saripalli et al. (2005) as the core of a “double-double” Giant Radio Galaxy. Figure 4 shows the optical SuperCOSMOS blue image overlaid with SUMSS radio contours at 843MHz – the total extent of the SUMSS source is 5.5 arcmin, corresponding to a largest linear size of 750 kpc.
This source was classified as FR-I by Saripalli et al. (2005) on the basis of the edge–darkened radio morphology in the SUMSS image. Saripalli et al. (2005) also obtained a higher-resolution 1.4 GHz radio image of J074618570258 with the ATCA (their Figure 9), which shows an inner pair of radio hotspots indicative of a core-jet morphology with the jet pointing towards the weaker (South-West) of the larger–scale radio lobes. The component identified as the core by Saripalli et al. (2005), which is identified with a galaxy, is also coincident with the AT20G source detected in our eVLBI observation.
Saripalli et al. (2005) note that the optical spectrum of this galaxy (shown in their Figure 19) has stellar absorption lines but no obvious emission lines. They suggest that J074618570258 may be an example of a restarting radio jet within relic lobes.
4.1.5 AT20G J091856243829
The 6dFGS spectrum of this galaxy shows strong emission–lines of H, [N II] and [S II], although H/[O III] lines are not seen. The e-VLBI position is offset 3.7 arcsec north of the optical centroid of the galaxy.
This galaxy has a K-band absolute magnitude M, making it significantly less luminous than the host galaxies of most nearby radio–loud AGN (which typically have M, see e.g. Figure 8 of Mauch & Sadler 2007). This, together with the relatively flat radio spectrum (compared to the other sources in our GPS sample) and the 3.7 arcsec radio–optical position offset, suggests that the radio emission in J091856243829 may come from a background quasar rather than the galaxy itself.
4.1.6 AT20G J114503325824
This galaxy appears in the SUMSS and NVSS catalogues as a point source of 39.7 mJy and 31.5 mJy respectively, suggesting a strong upturn in the radio spectrum above 1.4 GHz. The 6dFGS spectrum shows strong absorption lines and weak [N II] emission, consistent with the galaxy’s designation as a possible LINER.
4.1.7 AT20G J130031441442
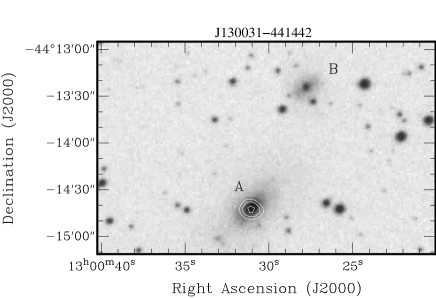
This object is associated with the brighter of the two objects in the galaxy pair AM 1257435 (galaxy A in Figure 5). Galaxy B, the second member of the pair, is 1.4 arcmin away. J130031441442 (galaxy A) is listed as a shell galaxy in the catalogue of Malin and Carter (1983), who describe it as having “shells NW and SE, 2 companions”. Such shells are generally attributed to a past merger of two gas–poor galaxies. J130031441442 is also identified with the UV source FC-238 by Brosch et al. (2000), who list it as a SAB(s) pec galaxy with UV magnitude of .
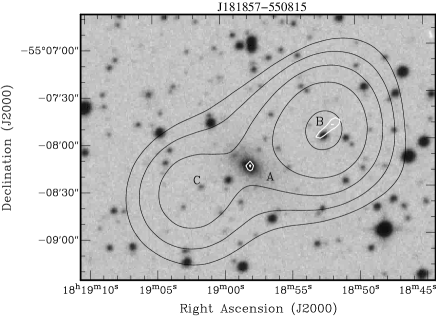
4.1.8 AT20G J181857550815
The 6dFGS spectrum of this galaxy (marked as object A in Figure 6) shows stellar absorption lines typical of early–type galaxies but no obvious optical emission lines. This galaxy lies between two SUMSS sources, as shown in Figure 6. The AT20G source J181857550815 is at the position of galaxy A near the centre of the image.
The most likely interpretation is that the AGN in galaxy A produces the extended radio lobes which are seen at 843 MHz. The radio observations at 5, 8 and 20GHz from the AT20G show an inverted spectrum with spectral index centered on J181857550815, which may mean that, like J074618570258, J181857550815 is a recently “restarted” radio galaxy. The fact that the radio lobes are extended along the minor axis of the host galaxy is consistent with this scenario, and the 4.8 GHz AT20G image shows a jet-like feature extending roughly 1 arcmin from the nucleus.
A second galaxy, marked as B in figure 6 lies close to the centroid of the north-western lobe and may also be responsible for some of the radio emission seen in the SUMSS image. The total SUMSS flux density is 627.721.2 mJy and the separation of the two SUMSS components is 1.1 arcmin, implying a largest linear size of at least 90 kpc.
4.1.9 AT20G J220916471000
The AT20G source J220916471000 is a well–studied nearby Seyfert 1 galaxy, NGC 7213. The optical spectrum includes many strong emission lines which can be used as diagnostics of the physical conditions in the nucleus (Filippenko & Halpern 1984). Neutral hydrogen was also detected in this galaxy in the HIPASS survey (Doyle et al. 2005).
The radio continuum emission from NGC 7213 may be variable, as noted by Blank, Harnett and Jones (2005).
4.1.10 AT20G J224506433157
The 6dFGS spectrum shows stellar absorption typical of an early-type galaxy, with no obvious emission lines. The optical counterpart of this source is only slightly extended.
5 Discussion
5.1 Source sizes
As noted earlier, all ten sources listed in Tables 1 and 2 were unresolved at 100 mas resolution in our e-VLBI observations. Figure 7 shows that the radio emission detected by the AT20G survey on scales of 10–15 arcsec or larger is dominated by a central compact component less than 0.1 arcsec in size. The lack of any significant structure in the core on scales larger than 100 pc supports the idea that we are looking at young unevolved radio sources. Even for a very slowly evolving source with hot spot expansion velocities of 0.1c, a linear size of 100pc gives an age of 3000 years.
For powerful radio galaxies, it is well known that core and total radio power are related (Fabiano et al. 1984), and Slee et al. (1994) found at 5 GHz for a sample of 140 galaxies ranging in radio power from to W Hz-1. Figure 7 suggests that a similar relation applies for the nearby GPS radio galaxies in our sample.

5.2 Core spectral index
The distribution of the spectral indices listed in Table 1 is consistent with that of the medium–power sample studied by Slee et al. (1994). These authors attribute the inverted spectral indices of the galactic cores to a combination of synchrotron self absorption (SSA) and free-free absorption (FFA) for sources smaller than mas. For SSA to be responsible for the spectral turnover, the magnetic fields must be either much stronger than previously thought, or well below equipartition values, with the energy in relativistic electrons greatly exceeding that in magnetic fields. Orienti et al. (2008) find that equipartition does hold for high frequency peaking sources, requiring stronger magnetic fields than previously estimated by Slee et al. (2004). For sources larger than mas SSA is no longer viable. Higher–resolution observations of our GPS sample are needed to determine the angular size and structure of the central emission region.
5.3 Variability
GPS galaxies are the least variable class of compact radio sources (Rudnick and Jones, 1982). GPS radio sources in general show a low incidence of variability (, O’Dea 1998 and references therein), and many of the high frequency peaking (HFP) sources are QSOs that show peaked spectrum only during outburst/flare events. This is supported by Torniainen et al. (2005) who find that nearly all quasar type GPS sources are variable both in spectral shape and radio power with only a small fraction being ’genuine’ GPS sources. As our sample of sources contains only galaxies we might therefore expect very little variability to be present, but longer-term monitoring is needed to test this. At least two objects in the sample, J051103255450 and J220916471000, already show some evidence of variability, as noted in §4.
5.4 Extended low–frequency radio emission
At least two of the sources in our sample, J074618570258 and J181857550815, show extended low–frequency radio emission on scales of 100 kpc or larger. These may be “restarted” radio galaxies in which the current phase of nuclear activity has been caught at an early stage.
It is particularly remarkable that our GPS sample, selected at 20 GHz, includes the giant radio galaxy J074618570258 which was first identified by Saripalli et al. (2005) on the basis of its extended low surface-brightness radio emission at 843 MHz. When the redshift coverage of the AT20G GPS sample is completed, it should allow a more detailed study of the duty cycle of activity in nearby radio galaxies.
6 Conclusions and Future work
We have presented 6cm e-VLBI observations of 10 low redshift, low radio power GPS galaxies selected from the AT20G survey. The angular resolution of the eVLBI observations was sufficient to confirm the compact nature of the targets, but not high enough to differentiate between edge-brightened and jet dominated GPS sources. Such a differentiation is required to investigate the possibility of a luminosity-morphology relationship in radio galaxy progenitors, similar to the FR-I/FR-II relationship. The eVLBI observations do allow us to devise follow-up VLBI observations using the full LBA at a higher observing frequency, to obtain higher angular resolution. The value of eVLBI observations in this context is that fast feedback can be obtained regarding the detectability of the targets, allowing the rapid selection of a sample for more detailed follow-up observations.
Acknowledgements
The Australia Telescope Long Baseline Array is part of the Australia Telescope which is funded by the Commonwealth of Australia for operation as a National Facility managed by CSIRO. This research has made use of the NASA/IPAC Extragalactic Database (NED) which is operated by the Jet Propulsion Laboratory, California Institute of Technology, under contract with the National Aeronautics and Space Administration.
References
Blank D. L. et al. 2005, MNRAS, 356, 734
Brosch N. et al., 2000, MNRAS, 313, 641
Condon J. J. et al., 1998, AJ, 115, 1693
Deller A. T. et al., 2007, PASP, 119, 318
de Vaucouleurs, G., de Vaucouleurs A., Corwin H.G., Buta R.J., Paturel, G., Fouque P., Third Reference Catalogue of Bright Galaxies.
Doyle M.T. et al. 2005, MNRAS, 361, 34
Fabiano G., Miller L., Trinchieri G., Longair M., Elvis M., 1984, ApJ, 277, 115
Fanaroff B.L., Riley J.M., 1974, MNRAS,167, 31P
Filippenko A.V., Halpern J.P., 1984, ApJ 285, 458
Franx M., Illingworth G.D., 1988, ApJ 327, L55
Griffith M. R. et al., 1994, ApJS, 90, 179
Hambly N.C. et al., 2001, MNRAS, 326, 1279
Hancock P.J., 2009, AN, 330, 180 arXiv:0901.4592v1
Kellerman K. 1966, AuJPh, 19, 195
Jauncey D. L et al. 2003, PASA, 20, 151
Jones H. et al. 2004, MNRAS, 355, 747
Malin D. F., Carter D. ApJ, 274, 534
Mauch T. et al. 2003, MNRAS, 342, 1117
O’Dea C. 1998, PASP, 110, 493
Orienti M. et al. 2008, A&A, 487, 885
Rudnick L., Jones T. W. 1982, ApJ, 255, 39
Sadler E. M et al. 2008, MNRAS, 385, 1656
Saripalli L. et al. 2005, AJ, 130, 896
Shepherd M. C. et al. 1994, BAAS, 26, 987
Slee O. B, et al. 1994, MNRAS, 269, 928
Snellen I. A. G et al. 2000, MNRAS, 319, 445
Stanghellini C., 2003, PASP, 20, 118
Tingay S. J et al. 2003, MNRAS, 346, 327
Tingay S. J., de Kool M. 2003, AJ, 126, 723
Tzioumis A. K, 1997, Vistas Astron., 41, 311
Torniainen I. et al. 2005, A&A, 435, 839
Torniainen I. et al. 2007, A&A, 469, 451
Vermeulen R. C et al. 2003, A&A, 401, 113