Magnetism in Nb1-yFe2+y – composition and magnetic field dependence
Abstract
We present a systematic study of transport and thermodynamic properties of the Laves phase system Nb1-yFe2+y. Our measurements confirm that Fe-rich samples, as well as those rich in Nb (for ), show bulk ferromagnetism at low temperature. For stoichiometric NbFe2, on the other hand, magnetization, magnetic susceptibility and magnetoresistance results point towards spin-density wave (SDW) order, possibly helical, with a small ordering wavevector Å-1.
Our results suggest that on approaching the stoichiometric composition from the iron-rich side, ferromagnetism changes into long-wavelength SDW order. In this scenario, changes continuously from 0 to small, finite values at a Lifshitz point in the phase diagram, which is located near . Further reducing the Fe content suppresses the SDW transition temperature, which extrapolates to zero at . Around this Fe content magnetic fluctuations dominate the temperature dependence of the resistivity and of the heat capacity which deviate from their conventional Fermi liquid forms, inferring the presence of a quantum critical point. Because the critical point is located between the SDW phase associated with stoichiometric NbFe2 and the ferromagnetic order which reemerges for very Nb-rich NbFe2, the observed temperature dependences could be attributed both to proximity to SDW order or to ferromagnetism.
pacs:
75.30.Fv, 75.30.Kz, 75.40.Cx, 75.47.-m, 75.50.BbI Introduction
Magnetic quantum phase transitions, where the threshold of magnetism can be reached at low temperature, guide towards new ordering phenomena in metals. While examples of quantum phase transitions and of the associated quantum critical behavior abound in 4f-electron metals, such as the heavy fermion Ce- and Yb-compounds,stewart2006 comparatively few transition metal compounds have been studied in detail. Among these are the nearly or weakly ferromagnetic (FM) materials MnSi, Ni3Al/Ni3Ga, -Fe, FeGe and ZrZn2, as well as layered oxides such as the high- cuprates and the ruthenates. pfleiderer2007 ; niklowitz2005 ; aguayo2004 ; pedrazzini2007 ; smith2008 ; broun2008 ; grigera2004 Outside the oxide family, itinerant antiferromagnetism, or spin density wave order, is rare in transition metal compounds. The most thoroughly studied example is chromium and its alloy series with vanadium, in which signatures of Fermi liquid (FL)baym1991 breakdown have been observed at the quantum critical composition Cr1-xVx.yeh2002 Recently, we have reported anomalous temperature dependences of the heat capacity and of the electrical resistivity in slightly off-stoichiometric NbFe2.brando2008 Positioned very close to the threshold of magnetism at ambient pressure and stoichiometric composition, NbFe2 may provide fresh opportunities in this long-standing problem.
The C14 Laves phase system Nb1-yFe2+y exhibits three magnetically ordered low temperature states within a narrow composition range at ambient pressure. At slightly off-stoichiometric compositions, both towards the iron-rich and the niobium-rich side, it has been reported to be ferromagnetic at low temperature, with composition-dependent, low transition temperatures of the order of tens of Kelvin. Moreover, at and very close to the stoichiometric composition, NbFe2 has been reported to assume antiferromagnetic or spin density wave (SDW) order below a second transition temperature .shiga1987 ; yamada1988 ; yamada1990 ; crook1995 ; kurisu1997 The easy accessibility of these ordered states in a nearly stoichiometric compound presents a number of interesting opportunities for studies of quantum phase transitions and quantum criticality in a transition metal compound.
Firstly, it may be possible to examine ferromagnetic quantum criticality by tuning towards absolute zero. This requires starting with a niobium-rich sample and either changing the composition or applying hydrostatic pressure. In iron-rich samples, ferromagnetism transforms into the presumed spin density wave state on approaching stoichiometry. The precise nature of this non-ferromagnetic ordered phase in nearly stoichiometric NbFe2, and the associated quantum critical phenomena, represent a second area of interest. Finally, the intermediate composition ranges, at which ferromagnetism is replaced by the non-ferromagnetic order characteristic of stoichiometric NbFe2 invite detailed investigation.
Past studies of the Nb1-yFe2+y system have explored the composition-temperature phase diagram in polycrystals by magnetic measurements and by nuclear magnetic resonance.yamada1988 ; crook1995 While in broad agreement, these studies differ in their classification of the slightly niobium-rich region of the phase diagram. The former (Ref. 13) describes the region around as paramagnetic down to , whereas the latter (Ref. 14) reports a mixed (FM and SDW) phase. Further microscopic probes have been Mößbauer spectroscopy, muon spin relaxation (sr) and neutron scattering studies. While sr has shown evidence of static moments in stoichiometric NbFe2, neutron scattering has so far not revealed any information about the nature of this magnetic order in NbFe2. Here, we reexamine the magnetic phase diagram of Nb1-yFe2+y in well-characterized high-quality samples. We aim to address key questions thrown up by earlier studies: (i) Are both FM phases previously observed truly belonging to the C14 phase of Nb1-yFe2+y or is the ferromagnetism due to the presence of a FM second phase;bi1996 ; zhu2003 (ii) which is then the real origin of the SDW order; (iii) how does the SDW state grow out of the FM state; (iv) does the antiferromagnetism disappear in slightly Nb-rich samples, and, if so, (v) is there a QCP?
II Experimental details
II.1 Sample preparation
Most measurements in previous studies,shiga1987 ; yamada1988 ; crook1995 were carried out on polycrystalline samples of Nb1-yFe2+y prepared by arc-melting, followed by annealing for one week at . X-ray powder diffraction was used to check for phase purity and to determine the lattice parameters, from which the composition was estimated.
Since C14-Nb1-yFe2+y crystallizes in a broad homogeneity range from 27.4 to 36.3 at. Nb at , and because the magnetic properties are very sensitive to , it is important to verify not only the structure but also the final composition. We decided, therefore, to prepare samples in the range from 26 to 40 at.% Nb, covering the whole homogeneity range of the C14 phase, with two similar methods (indicated as method A and B in table 1) accompanied by characterization with X-ray powder diffraction, metallographic analysis, and wavelength and energy dispersive X-ray spectroscopy (WDXS and EDXS).
The results are displayed in Table 1. Method A: Pellets with a mass of were prepared by arc melting from pure niobium (H. C. Starck, granules, ) and iron (Chempur, foil, ) on a water-cooled copper hearth in an argon atmosphere. In order to assure homogeneity, the pellets were turned over and remelted several times. The pellets were subsequently enclosed in weld-sealed niobium ampoules which were in turn jacketed in quartz tubes, and annealed at for three weeks. Method B: Polycrystals were prepared by melting together the elements in a radio-frequency induction heating system (in argon atmosphere) on a water-cooled copper boat, immediately followed by a short anneal above .
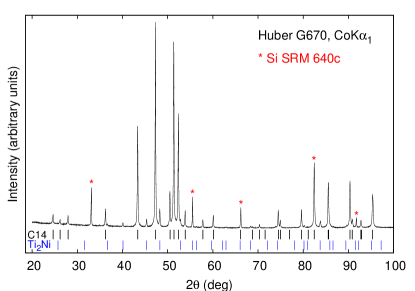
X-ray powder diffraction data (Fig. 1) have been collected on a Huber G670 diffractometer equipped with a Ge monochromator. Co K radiation was used instead of standard Cu K because of the strong absorption of iron. Silicon (National Institute of Standards & Technology SRM 640c, Åwas used as the internal standard. The lattice parameters were refined by least-squares fits of the diffraction angles in the range , where is the diffraction angle, using the program PPLP.gabe1989
| Nb1-yFe2+y | meth. | phase | nom. (at.%) | WDXS (at.%) | (Å) | (Å) | RRR | (K) | (K)222 indicates the FM transition temperature of the second phase with Ti2Ni-structure type, while refers to the FM state of the C14 Laves phase. | (T)333Values estimated at 100 m K | |
|---|---|---|---|---|---|---|---|---|---|---|---|
| Nb0.8Fe2.2 | 0.2 | (A) | C14 + Fe(Nb) | 26.0 | 27.9(2) | 4.8136(4) | 7.8509(5) | ||||
| Nb0.825Fe2.175 | 0.175 | (A) | C14 + Ti2Ni | 28.0 | 28.4(3) | 4.8159(7) | 7.857(1) | ||||
| Nb0.865Fe2.135 | 0.135 | (A) | C14111Some traces of Ti2Ni-structure type phase. | 29.0 | 29.2(2) | 4.8211(5) | 7.8642(7) | ||||
| Nb0.897Fe2.103 | 0.103 | (A) | C14111Some traces of Ti2Ni-structure type phase. | 30.0 | 30.3(3) | 4.8249(6) | 7.872(1) | ||||
| Nb0.96Fe2.04 | 0.04 | (A) | C14 | 32.0 | 32.5(2) | 4.8346(5) | 7.8880(8) | 72 | |||
| Nb0.992Fe2.008 | 0.008 | (A) | C14 | 33.3 | 33.2(2) | 4.8419(4) | 7.8978(6) | 14 | |||
| Nb1.035Fe1.965 | -0.035 | (A) | C14 | 34.0 | 34.5(3) | 4.8461(6) | 7.9048(9) | 14.5 | |||
| Nb1.06Fe1.94 | -0.06 | (A) | C14 + Ti2Ni | 35.0 | 34.6(1) | 4.8503(5) | 7.9106(7) | 30 | |||
| Nb1.09Fe1.91 | -0.09 | (A) | C14 + | 36.0 | 34.8(2) | 4.8556(4) | 7.9175(7) | ||||
| Nb1.093Fe1.907 | -0.093 | (A) | C14 + | 38.0 | 4.8562(6) | 7.918(1) | |||||
| Nb1.097Fe1.903 | -0.097 | (A) | C14 + | 40.0 | 35.2(2) | 4.8569(7) | 7.919(2) | ||||
| Nb1.006Fe1.994 | -0.006 | (A) | C14 | 33.3 | 4.8414(6) | 7.8989(1) | 13 | 5 | |||
| Nb1.012Fe1.988 | -0.012 | (A) | C14 | 33.53 | 4.842(1) | 7.900(2) | 2 | ||||
| NbFe2 | 0 | (B) | C14 | 33.3 | 33.3(4) | 4.8401(2) | 7.8963(6) | 9.1 | 10 | 0.6 | |
| Nb0.997Fe2.003 | 0.003 | (B) | C14 + Ti2Ni | 4.8397(6) | 7.8959(9) | 10 | 80 | ||||
| Nb0.993Fe2.007 | 0.007 | (B) | C14111Some traces of Ti2Ni-structure type phase. | 4.8414(6) | 7.8981(9) | 5.3 | 18 | 6 | 0.15 | ||
| Nb0.985Fe2.015 | 0.015 | (B) | C14 | 6 | 32 | 25 | |||||
| Nb1.01Fe1.99444Single crystal obtained using Czochralski method.brando2007 ; brando2008 | -0.01 | (C) | C14 | 18 | 2.8 | 0.2 | |||||
| Nb1.022Fe1.978444Single crystal obtained using Czochralski method.brando2007 ; brando2008 | -0.022 | (C) | C14 | 4.8440(4) | 7.9015(5) | 4 |
Together with the expected hexagonal C14 Laves phase (space group ), X-ray powder diffractograms show evidence of a second phase with Ti2Ni structure type (space group , Å) in almost all investigated samples. The structure type of the second phase was confirmed for the sample at the composition Nb1.06Fe1.94 (see Tab. 1) by electron-back-scatter diffraction.

According to EDXS analysis this phase is richer in Nb compared to the Laves phase. The actual composition of this phase could not be accurately determined due to its small grain size. It is plausible that in a sample with a large amount of this Nb-rich second phase the C14 main phase will be Fe-rich. This argument may explain the difference in lattice parameters between the samples with and , which were both extracted from the same ingot.
The main difference between the two methods emerged in the metallographic analysis: While the first method resulted in high homogeneity in all regions of the final pellet with very small isolated filaments of the Ti2Ni-like phase, the second method produced drastic differences in homogeneity between the upper and the lower zone inside the pellet. The zone with almost no extra phases appears to be the middle of the pellet.
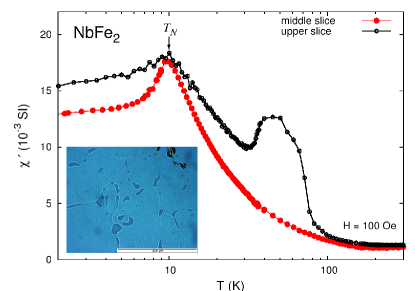
After having cut the samples into horizontal slices, we ground and polished them carefully (in two steps) and observed the surface with a high resolution optical microscope. The inset in Fig. 2 shows the optical micrograph taken from one of the upper slices of the NbFe2 polycrystal prepared with method B. It is the same sample as that measured in Fig. 1, where we observed the richest amount of second phase. The phase can be seen clearly near the C14-NbFe2 grain boundaries, which have dimensions of about .
Afterwards, we measured the AC-susceptibility at low magnetic fields () of samples extracted from the upper and the middle slice (Fig. 2): In the upper slice, we observed a FM signal with a transition temperature , in addition to the expected SDW peak at . In the middle slice, only the SDW signature is present. Comparing these measurements with the metallographic analysis, we conclude that the second phase is responsible for the FM part of the signal. Repeating the same procedure with different samples, we observed that is different in every sample, varying from 250 K to 15 K. It probably depends on the real Nb concentration at the grain boundaries. Looking at the Nb1-yFe2+y phase diagram (Fig. 19), this hypothesis makes sense because the Nb-rich region is FM and the transition temperature varies strongly with the quantity of Nb. In magnetic fields higher than 250 Oe these FM features disappear. It is therefore necessary to evaluate the quality of any sample by not only measuring the residual resistance ratio (RRR), but also the AC-susceptibility in zero magnetic field.
The lattice parameters of all polycrystals are listed in Table 1, together with the initial nominal compositions, WDXS results and transition temperatures. The discrepancy between the values of our lattice parameters for NbFe2 and those reported in literature is less than 0.001 Å.shiga1987 ; bi1996 ; zhu2003 The measurements that we are going to present have been performed on a selected number of polycrystals, which show none or at most very low presence of the second phase.
Fig. 3 shows the average volume per atom of the C14 structure versus the nominal (solid line) and WDXS (dashed line) Nb content. The final composition of most samples, as determined by WDXS, is slightly richer in Nb than the nominal composition. In the range from 28 to 34 at. Nb, a linear dependence of the atomic volume on composition determined by WDXS according to Vegard’s volume is observed. Around the upper border of the homogeneity range ( at.% Nb), the sample composition could not be determined accurately by WDXS, probably because of the large amount of the second phase. Using the relation
| (1) |
obtained by a least-squares fit of the data, we can determine the composition of a sample by measuring the lattice parameters. This is especially useful for detecting small differences in composition that are difficult to observe using WDXS. The accuracy in the WDXS experiments is of the order of limiting the accuracy on to . We note that a small systematic error of about 0.2 at. cannot be ruled out. However, this error would only shift the absolute value without changing the shape of the phase diagram.
II.2 Experimental setup
Measurements of the resistivity, heat capacity, magnetization and magnetic susceptibility down to 1.8 K have been carried out in a 9 T Physical Properties Measurements System and in a 7 T Magnetic Properties Measurements System (Quantum Design). High-resolution measurements of the resistivity at temperatures down to 50 mK were obtained in an adiabatic demagnetization refrigerator (Cambridge Magnetic Refrigeration) by a standard 4-terminal lock-in technique. The low temperature heat capacity was determined in the same refrigerator by a relaxation-time technique.

Due to the low molar specific heat of NbFe2 compared to that of heavy fermion compounds ( mJ/Kmol at 1 K), and due to the low sample mass of , we had to assemble a particular platform for measuring the heat capacity with high resolution: We used sapphire single-crystals of 6 mm diameter and m thickness held mechanically by four Pt0.9Ir0.1 wires, which provide a well defined thermal link with a thermal conductance at 1 K; this configuration provides relaxation time constants of about s. Details of the heat capacity setup will be described in a forthcoming article.
III Results and discussion
III.1 FM phases: .
We focus our attention first on a very Nb-rich sample , as well as on one very rich in Fe . For both compositions, literature reports FM order.yamada1988 ; crook1995 They are still in the C14 homogeneity range and the amount of the second phase appears to be negligible. Our results confirm that both Nb- and Fe-rich Nb1-yFe2+y are FM, and indicate that the two ferromagnetically ordered states are different in character.
Fig. 4 shows the DC magnetic susceptibility of the two samples measured at 50 Oe. Clear jumps in magnetization are observed at K and K for the Fe-rich and the Nb-rich sample respectively. When increasing the external field, the transition temperature remains practically constant, suggesting that the ferromagnetism is not a consequence of the second phase. In addition, hysteresis signatures are evident in both samples, as shown in the inset of the same figure. Although in both samples the remanent magnetizations are very small, of the order of per atom, the coercive fields are quite large: 200 Oe and 700 Oe.

With increasing Nb excess the coercive field of Nb-rich samples decreases to a value that is not detectable anymore by the measurement technique, as in the case of soft magnets: The Arrott plot for sample ( K) in Fig. 5 at 2 K does not show any hysteresis, although the finite intercept for zero is a clear indication of a remanent magnetization and hence of ferromagnetism. For very slight Nb doping, , no FM signal has been observed down to 2 K and also the Arrott plot suggests a PM groundstate.

On the Fe-rich side, all samples exhibited large hysteresis (see inset of Fig. 5). The FM transition in samples and is also inferred by the behavior of versus shown in Fig. 6. All samples in the homogeneity range follow a Curie-Weiss law below 100 K with a slope corresponding to a large fluctuating moment compared to the ordered moment (), where and is the atomic number density.
As the composition is varied from slightly Fe-rich () to slightly Nb-rich (), remains constant at per atom (inset of Fig. 6), whereas the Curie-Weiss temperature changes sign, from K for to K for .
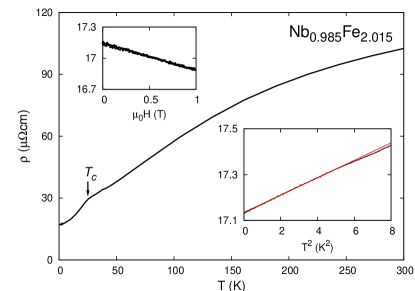
To study the ground state properties of the FM phase, we measured the electrical resistivity and the heat capacity of a FM sample with down to 100 mK. Although the sample shows a small SDW signal (peak in the magnetic susceptibility) at K, its groundstate properties are dominated by the FM transition at K: the resistivity , shown in Fig. 7, suddenly decreases only at the FM transition temperature K, following a law above and below (Ref. 11), which indicates a strong influence of FM fluctuations on the electron scattering rate. Below K, recovers a Fermi-liquid dependence (lower inset). The magnetoresistance is almost flat at 100 mK up to 1 Tesla (upper inset).
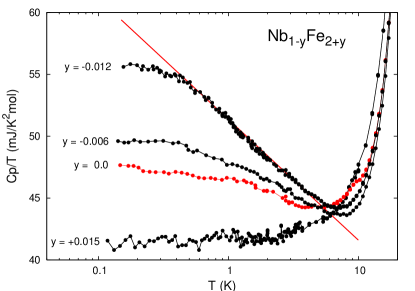
The temperature dependence of the heat capacity divided by temperature, , of the sample with is shown in Fig. 8. No clear heat capacity anomalies are visible at the SDW and FM transition temperatures (arrows), which suggests small ordered moments. Below 2 K, levels off at a value of 42 mJ/K2mol, consistent with a Fermi-liquid ground state.
Below 300 mK, however, increases dramatically, probably because of the nuclear Schottky contribution of the Nb atoms subject to a the internal field of a ferromagnet (inset). By fitting the points below 2 K with a Schottky contribution, we obtain . From this equation we can estimate the internal magnetic field experienced by the Nb atoms:
where is given by NMR experiments and is the nuclear spin of the Nb atoms. For 93Nb atoms with and MHz/T, the resulting field is T. Only in this FM sample (the only FM sample measured down to 50 mK), has the Schottky contribution to the heat capacity been clearly observed.
We conclude that the groundstate of the Fe-rich compounds is ferromagnetic and that the low temperature transport and thermodynamic properties are well explained by the Fermi-liquid theory, as in many other FM transition metal compounds.niklowitz2005
III.2 SDW phase:
We focus now on stoichiometric NbFe2. Based on the broadening of the NMR line width and on the “S”-like feature in the magnetization curves below K, NbFe2 had been reported to exhibit spin density wave order at low temperature.shiga1987 ; yamada1988 ; crook1995 This interpretation is consistent with our measurements of the magnetic susceptibility, specific heat capacity and magnetization.brando2008 ; moroni2005 ; brando2006 Based on these earlier results, we suggested that the low temperature magnetic order in stoichiometric NbFe2 may take the form of a SDW with an helical arrangement of the Fe spins. Direct evidence for SDW order in NbFe2 from neutron scattering is still outstanding,cywinski but a renewed attempt, using large single crystals grown in an infrared mirror furnace, is scheduled.
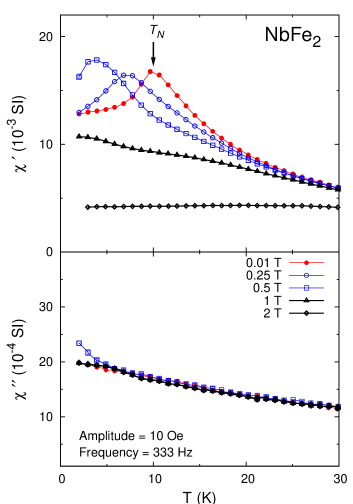
Fig. 9 shows the real and imaginary components of the AC-susceptibility. The distinct SDW peak is visible at 10 K, cutting off the Curie-Weiss-like behavior with decreasing temperature (see Fig. 6). The low transition temperature, for a d-metal compound, as well as the geometrically frustrated Kagomé structure of the Fe atoms in the C14 phase, might suggest a spin-glass transition.
However, the measured Curie-Weiss temperature is close to 1 K giving a frustration factor of only 0.1. By contrast, the hall-mark of frustration in local moment systems is a frustration factor . Moreover, the lack of a loss peak in at , as well as the absence of a distinct frequency dependence of argue against a spin-glass transition.
The analysis of the irreversible field-cooled (FC) and zero-field-cooled (ZFC) measurements (not shown) indicates a slight splitting of the magnetization curves at , but the effect is so small that it would be difficult to attribute it to the main phase. Only at much lower temperatures ( K) and at very low fields does this splitting become more pronounced, suggesting the formation of magnetic domains.dennis-thesis2006 This behavior will be analysed in the next section, where it resurfaces in a slightly Fe-doped sample.
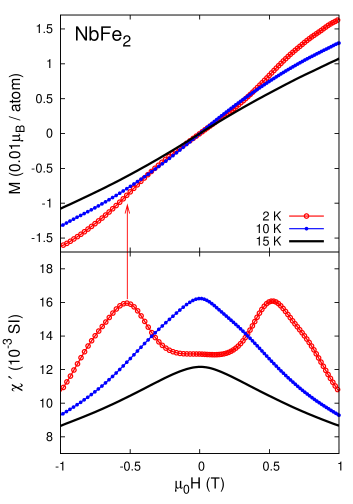
An applied magnetic field shifts the peak to lower and suppresses the magnetic order at a critical field at , switching the system to a paramagnetic state. This can be seen more clearly in the magnetization and susceptibility plots in Fig. 10. Such a behavior could be interpreted as a metamagnetic transition from a paramagnetic (PM) state to another PM state with a higher magnetization in field. Such transitions are not uncommon in nearly FM metals, such as YCo2,sakakibara1990 but here, in contrast to the metamagnetic PM-to-PM case, is shifted to lower values with increasing temperature (see color plot of Fig. 16).brando2008
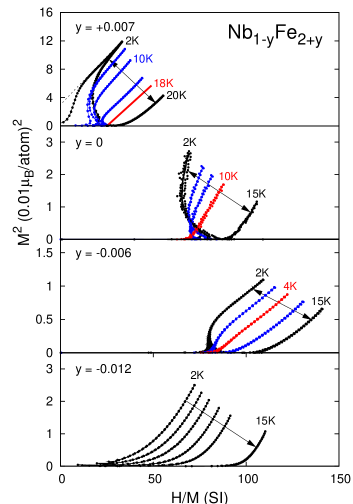
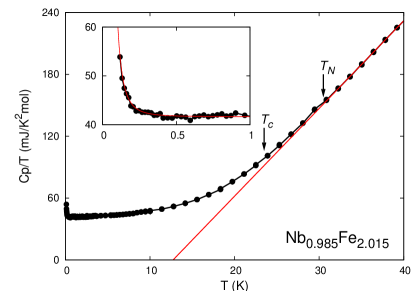
A further indication of a bulk SDW transition at is given by the Arrott plot in Fig. 11, in which the high field, high temperature linear dependence of on changes over to an arc with negative slope below and .yamada1988 Moreover, in the specific heat capacity (Fig. 12), the bulk SDW transition is visible as a small hump at , when the data are compared with measurements in magnetic fields .brando2006 In Fig. 12, this hump is shown not only for but also for the slightly Fe-rich sample with , which shows signatures of an SDW transition as well, at .
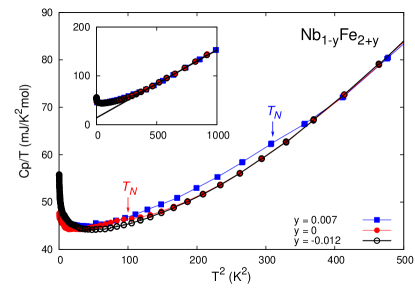
The entropy below the transition is very low, of the order of . Fig. 12 also shows the heat capacity of a slightly Nb-rich sample (). At this composition, no indication of a transition has been observed in the heat capacity down to 2 K. The inset of the Fig. 12 shows how the high temperature data can be fitted with the electronic and phononic contribution:
| (2) |
where the Sommerfeld coefficient is and the Debye temperature is . This Sommerfeld coefficient agrees very well with that predicted by band-structure calculations.takayama1988 ; inoue1989 However, increases towards low temperatures and saturates below 1 K near a value of (cf. Fig. 17),wada1990 three times larger than the band structure value.

The most dramatic signature of the SDW state is the behavior of the magnetoresistance : Although the SDW transition cannot be detected in the temperature dependence of the resistivity, the low temperature magnetoresistance shows a jump of about at the critical field in NbFe2, and even more () in the Fe-rich sample with , as shown in Fig. 13. The magnitude of the jump thus appears to be related to . At this feature disappears and follows a linear field dependence at high field, as in a paramagnetic metal.
In NbFe2, all magnetic signatures below are practically identical to those observed in the helically ordered compound MnAu2, although the latter has a much higher transition temperature .samata1998 Furthermore, the large magnetic anisotropy observed in single crystals,kurisu1997 and the the critical field required to destroy the SDW state, which is a surprisingly low value when compared to , suggest a long wavelength incommensurate magnetic groundstate. Moreover, the hexagonal C14 structure may favor helical order with propagation wavevector along the -axis, as in rare earth metals.blundell2001 Finally, the large Stoner factor (), computed by comparing the value of at to the one expected from band-structure DOS,takayama1988 ; inoue1989 and the high Wilson ratio of about 60,brando2008 indicates that this compound is on the border of a ferromagnetic instability. All these observations led us to propose that the SDW state grows out of the ferromagnetism existing in Fe-rich NbFe2, and develops into a helical state (as illustrated in Fig. 20).
III.3 SDW and FM mixed phase:
To examine our hypothesis that the SDW state grows continuously out of the FM phase in Fe-rich samples, we measured a slightly Fe-doped sample with , which is located in the phase diagram around the point of crossover between the pure FM phase and the SDW one. The AC-susceptibility, plotted in Fig. 14, shows the same sharp peak as in NbFe2, but at a higher temperature . The bulk transition is also visible in the specific heat measurement shown in Fig. 12.

The ZFC-FC curves separate exactly at , whereas in the stoichiometric () sample a clear separation only occurred well below .sato-turtelli2007 This might indicate spin glass behavior. However, as in the stoichiometric sample, we did not observe any shift of the maximum at with measurement frequency.
Hysteresis phenomena appear only at temperatures below , as shown, for example, in the Arrott plot of Fig. 5 at 2 K: In this plot the sample seems to be SDW between 10 K and 18 K, but develops a remanent magnetization suggesting FM at lower temperatures. These features are illustrated more drastically in the isotherms of Fig. 13: Below , the sample develops a clear negative magnetoresistance, and jumps towards lower values as the critical field is exceeded. The magnitude of the jump increases with decreasing temperature. Around , begins to shows hysteresis until at 2 K the “up” and “down” lines are well separated. The resulting curves suggest that the hysteresis phenomena detected in the stoichiometric samples are not a consequence of secondary FM phases, but are an intrinsic property of the SDW state.
Supporting evidence for this interpretation is provided in Fig. 15, which shows a sequence of magnetization and AC-susceptibility isotherms for the same sample. As already pointed out by Crook and Cywinski,crook1995 the hysteresis lines separate firstly not at but at finite fields. Following the measurements from the top to the bottom frame of the figure, we recognize the double peak at and as a signature of the SDW phase. As the temperature is lowered further, between and hysteresis develops, which straddles but does not yet reach . Finally, close to , the size of the hysteretic field region includes zero field, so that the two hysteresis regions associated with and merge, giving rise to a FM remanent magnetization.

All investigated samples with Fe concentrations display qualitatively the same phenomena, only the transition temperatures and the magnitudes of the effects change with increasing . For the samples seem to show only the FM character. The fact that in these very iron-rich, purely FM samples the magnetoresistance is much weaker and does not show any hysteresis suggests that the hysteretic signatures in , and are a characteristic property of this specific SDW state and indicates the presence of SDW domains, as recently discussed by Jaramillo et al. .jaramillo2007

III.4 PM phase:
While Fe-excess increases the SDW ordering temperature , and eventually induces low-ordered-moment ferromagnetism, slight Nb-excess weakens the SDW state and tunes the system towards paramagnetism and therefore to a QCP. This has been observed in the behavior of the magnetic susceptibility in two samples with and . Fig. 16 shows the color plots of for the two samples at : The ordered SDW phase for the sample, defined by the bright zone in the diagram, shrinks to a point for . A similar plot for a stoichiometric sample () is shown in Ref. 11.
Additional evidence for this evolution towards a paramagnetic state close to is given by the sequence of Arrott plots shown in Fig. 11. For and , the vs. curves change appearance at : for , the curves bend towards the left, whereas for they bend towards the right. By contrast, for , no such change in behavior occurs down to .
The heat capacity is less sensitive to the magnetic transition and so the weak anomaly that was observed in the stoichiometric sample at 10 K, has not yet been observed in either Nb-rich sample. The surprisingly high value of the Sommerfeld coefficient at low temperature for all the samples close to the stoichiometric composition has been considered as indication of the presence of strong spin fluctuations and of the vicinity of the system to a QCP.brando2006 ; brando2007 Approaching the QCP by increasing the Nb-content, gradually increases and, for , it follows a logarithmic temperature dependence down to about (Fig. 17).
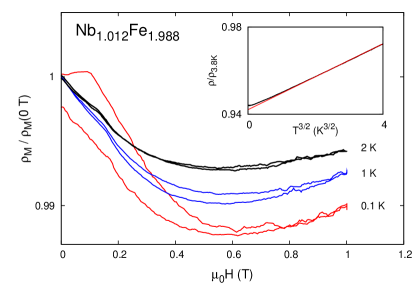
Non-Fermi-liquid behavior has also been observed in the temperature dependence of the electrical resistivity. The inset of Fig. 18 shows the temperature dependence of the resistivity : its power-law exponent varies from to between and and crosses over to the FL exponent 2 below .brando2007 Combining both observations, the -dependence of the heat capacity and of the resistivity below 3 K, the sample Nb1.012Fe1.988 seems to be close to a ferromagnetic QCP, where and have been predicted for a 3D FM metal.moriya1985 ; lonzarich1997 Below , Nb1.012Fe1.988 experiences a crossover to the conventional FL state.
Magnetoresistance measurements below (Fig. 18) suggest that Nb1-yFe2+y does not have a paramagnetic ground state at . A little drop (less than 1) in is observed at 2 K and clear hysteresis phenomena develop below . This indicates the presence of very weak SDW order below , which develops domains at .
These findings contrast with our observations on a high quality Nb-rich () single crystal, in which non-Fermi liquid phenomena have been observed down to the lowest temperature.brando2008 Despite residual low-temperature order below , presumably with a very small ordered moment, the resistance of the single crystal follows a power law down to , and its heat capacity coefficient increases logarithmically with decreasing temperature, without any indication of a crossover to a FL state. The return of our Nb-rich polycrystal with to FL behavior at low temperature, when such a return to FL behavior is not observed in a single crystal with a similar composition, may be attributed to the lower quality of the polycrystal either in terms of its purity or its homogeneity.
We interpret these findings as the first clear indication of a logarithmic breakdown of the Fermi-liquid state in a transition metal antiferromagnet: The fact that the precise power-law exponent varies between 3/2 and 5/3 and the discrepancies between the phenomena observed in single and polycrystals suggest that the precise form of may depend on stoichiometry and on the sample orientation and that present data cannot decide whether FM or SDW spin fluctuations determine the low temperature behavior.
IV Phase diagram and conclusion
We propose a refined version of the magnetic phase diagram for Nb1-yFe2+y (Fig. 19), obtained by combining all the thermodynamic and transport measurements discussed in this paper. Dashed lines indicate the likely limits of the FM and SDW state. We can address the five questions outlined in the introduction with the help of this phase diagram.
For , distinct FM phases have been observed at low temperature. Our data confirm that the FM features do not originate from an impurity phase, but are intrinsic to the C14 Laves phase Nb1-yFe2+y. The isotherms are qualitatively different in the Fe-rich and Nb-rich FM phases, suggesting that the two states are of a different nature.
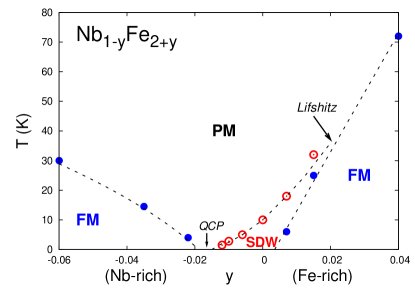
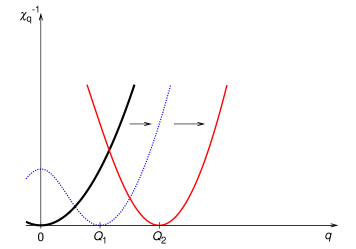
Between the FM phases, a distinct non-FM phase has been observed: susceptibility, magnetization, resistivity and heat capacity results, many of which are similar to observations in well-known spin helical compounds such as MnAu2,samata1998 Y2Fe17prokhnenko2005 and MnSi,pfleiderer1997 ; stishov2007 suggest that the magnetic order in stoichiometric NbFe2 assumes the form of a SDW, possibly a long wavelength helical or spiral state. On the Fe-rich side, we believe that the SDW state with a small wave vector connects continuously to the FM state at the Lifshitz point, which is located around .hornreich1975 The schematic Fig. 20 shows the possible evolution of the wave vector dependent generalised susceptibility , as Nb1-yFe2+y is tuned away from the Lifshitz point: With decreasing iron content the minimum shifts from to low , and Nb1-yFe2+y changes from FM to long-wavelength SDW order. The small value of the intercept at would explain the high value of the measured AC-susceptibility at low temperature. Assuming that the dispersion stiffness value of NbFe2 is similar to the one measured in ZrZn2, we could estimate an ordering wave vector of about 0.05 Å-1 for NbFe2.brando2008 Until the precise nature of the SDW state can be observed using a microscopic probe, ideally neutron scattering, this scenario remains strongly hypothetical.
Alternative origins of the dual nature of NbFe2 – nearly ferromagnetic and yet antiferromagnetic – include (i) coincidental peaks of the wave vector dependent susceptibility at large wave vector (SDW) and at (FM) and (ii) a very weakly dispersive wave vector dependent susceptibility , peaking at a large, antiferromagnetic wave vector but remaining unusually large even at . Neutron scattering experiments on recently grown, large single crystals of NbFe2 are planned, and will hopefully help to resolve this controversy.
Once the SDW state is entered, SDW domains form with different order parameter polarizations or ordering wavevector directions, creating a set of domain walls. A weak magnetic field is sufficient to destroy the SDW and induce a weakly spin-aligned paramagnetic state. The transition in from helical to the paramagnetic state probably occurs through a number of successive steps, which are linked with domain wall jumps and define the size of the hysteresis. We are planning to investigate this interpretation by high precision measurements of the magnetic field dependence of the magnetization and of the electrical resistivity at very low temperatures. By reducing the Fe content (for small negative ), the SDW state can be suppressed completely, leading to a magnetic quantum critical point and leaving a small paramagnetic region around . Here, magnetic fluctuations dominate the temperature dependence of resistivity and specific heat. Since the critical exponents fall in between those expected for FM and SDW spin fluctuations and the QCP is located between the two different phases, the nature of the fluctuations requires clarification.
Acknowledgements.
We are indebted to R. Ballou, A. Chubukov, B. Fåk, S. Grigera, G. G. Lonzarich, P. Niklowitz, C. Pleiderer, J. Quintanilla, J. Saunders, A. Schofield, B. Simons and Y. Yamada for useful discussions. Part of this work has been founded by UK Government’s funding agency EPSRC, grant number GR/T09866/01. Moreover, we thank the Max-Planck Inter-Institutional Research Initiative “The Nature of Laves Phases” and A. Kerkau for supporting key characterization activities.References
- (1) See, e. g., G. R. Stewart, Rev. Mod. Phys. 73, 797 (2001); ibid. 78, 743 (2006); H. v. Löhneysen, A. Rosch, M. Vojta, and P. Wölfle, Rev. Mod. Phys. 79, 1015 (2007); P. Gegenwart, Q. Si and F. Steglich, Nature Physics 4, 186 (2008), and references therein.
- (2) C. Pfleiderer, P. Böni, U. K. Rößler, and A. Rosch, Science 316, 1871 (2007).
- (3) P. G. Niklowitz, F. Beckers, G. G. Lonzarich, G. Knebel, B. Salce, J. Thomasson, N. Bernhoeft, D. Braithwaite, and J. Flouquet, Phys. Rev. B 72, 024424 (2005).
- (4) A. Aguayo, I. I. Mazin, and D. J. Singh, Phys. Rev. Lett. 92, 147201 (2004).
- (5) P. Pedrazzini, H. Wilhelm, D. Jaccard, T. Jarlborg, M. Schmidt, M. Hanfland, L. Akselrud, H. Q. Yuan, U. Schwarz, Yu. Grin, and F. Steglich, Phys. Rev. Lett. 98, 047204 (2007).
- (6) R. P. Smith, M. Sutherland, G. G. Lonzarich, S. S. Saxena, N. Kimura, S. Takashima, M. Nohara, and H. Tagagi, Nature 455, 1220 (2008).
- (7) D. M. Broun, Nature Physics 4, 170 (2008).
- (8) S. A. Grigera, P. Gegenwart, R. A. Borzi, F. Weickert, A. J. Schofield, R. S. Perry, T. Tayama, T. Sakakibara, Y. Maeno, A. G. Green, and A. P. Mackenzie, Science 306, 1154 (2004).
- (9) G. Baym and C. Pethick, in Landau Fermi liquid theory (Wiley, New York, 1991).
- (10) A. Yeh, Y.-Ah Soh, J. Brooke, G. Aeppli, T. F. Rosenbaum, and S. M. Hayden, Nature 419, 459 (2002).
- (11) M. Brando, W. J. Duncan, D. Moroni-Klementowicz, C. Albrecht, D. Grüner, R. Ballou, and F. M. Grosche, Phys. Rev. Lett. 101, 026401 (2008).
- (12) M. Shiga, and Y. Nakamura, J. Phys. Soc. Jpn. 56, 4040 (1987).
- (13) Y. Yamada, and A. Sakata, J. Phys. Soc. Jpn. 57, 46 (1988).
- (14) M. R. Crook, and R. Cywinski, J. Magn. Magn. Mater. 140-144, 71 (1995).
- (15) Y. Yamada, H. Nakamura, Y. Kitaoka, K. Asayama, K. Koga, A. Sakata, and Tetsuro Murakami, J. Phys. Soc. Jpn. 59, 2976 (1990).
- (16) M. Kurisu, Y. Andoh, and Y. Yamada, Physica B 237-238, 493 (1997).
- (17) Y. J. Bi, J. S. Abell, and D. Fort, J. Crystal Growth 166, 298 (1996).
- (18) J. H. Zhu, L. M. Pike, C. T. Liu, and P. K. Liaw, Acta Mater. 47, 2003 (1999).
- (19) E. J. Gabe, Y. Le Page, J. P. Charland, F. L. Lee, and P. S. White, J. Appl. Crystallogr. 22 384 (1989).
- (20) M. Brando, D. Moroni-Klementowicz, C. Albrecht, W. Duncan, D. Grüner, R. Ballou, B. Fåk, and F.M. Grosche, J. Magn. Magn. Mater. 310, 852 (2007).
- (21) D. Moroni-Klementowicz, M. Brando, C. Albrecht, and F. M. Grosche, AIP Conf. Proc. 850, 1251 (2006).
- (22) M. Brando, D. Moroni-Klementowicz, C. Albrecht, and F. M. Grosche, Physica B 378-380, 111 (2006).
- (23) R. Cywinski, private communication; B. Fåk and R. Ballou, private communication.
- (24) D. Moroni-Klementowicz, PhD Thesis:“Unconventional Magnetism and Quantum Criticality in the Hexagonal Laves Phase NbFe2 ”, Royal Holloway College, University of London (2006).
- (25) T. Sakakibara, T. Goto, K. Yoshimura, and K. Fukamichi, J. Phys.: Condens. Matter 2, 3381 (1990).
- (26) N. Takayama, and M. Shimizu, J. Phys. F 18 L83 (1988).
- (27) J. Inoue, and M. Shimizu, J. Magn. Magn. Mater. 79, 265 (1989).
- (28) H. Wada, M. Hada, M. Shiga, and Y. Nakamura, J. Phys. Soc. Jpn. 59, 701 (1990).
- (29) H. Samata, N. Sekiguchi, A. Sawabe, Y. Nagata, T. Uchida, and M. Der Lan, J. Phys. Chem. Solids 59, 377 (1998).
- (30) S. Blundell, in Magnetism in Condensed Matter, Oxford Masters in Condensed Matter Physics Series, (Oxford University Press Inc., New York, 2001).
- (31) R. Sato Turtelli, J. P. Sinnecker, R. Grössinger, A. Penton-Madrigal, and E. Estevez-Rams, J. Magn. Magn. Mater. 316, e492 (2007).
- (32) R. Jaramillo, T. F. Rosenbaum, E. D. Isaacs, O. G. Shpyrko, P. G. Evans, G. Aeppli, and Z. Cai, Phys. Rev. Lett. 98, 117206 (2007).
- (33) T. Moriya, in Spin Fluctuations in Itinerant Electron Magnetism, Springer Series in Solid State Sciences, Vol. 56 (Springer, Berlin, 1985).
- (34) G. G. Lonzarich, in Electron, Ed. M. Springford (CUP, Cambridge, UK, 1997).
- (35) O. Prokhnenko, J. Kamarád, K. Prokeš, Z. Arnold, and A. V. Andreev, Phys. Rev. Lett. 94, 107201 (2005).
- (36) C. Pfleiderer, G. J. McMullan, S. R. Julian, and G. G. Lonzarich, Phys. Rev. B 55, 8330 (1997).
- (37) S. M. Stishov, A. E. Petrova, S. Khasanov, G. Kh. Panova, A. A. Shikov, J. C. Lashley, D. Wu, and T. A. Lograsso, Phys. Rev. B 76, 052405 (2007).
- (38) R. M. Hornreich, M. Luban, and S. Shtrikman, Phys. Rev. Lett. 35, 1678 (1975).