Surface segregation in nanoparticles from first principles
Abstract
FePt nanoparticles are known to exhibit reduced L10 order with decreasing particle size. The reduction in order reduces the magnetic anisotropy and the thermal stability of the direction of magnetization of the particle. The phenomenon is addressed by investigating the thermodynamic driving forces for surface segregation using a local (inhomogeneous) cluster expansion fitted to ab initio data which accurately represents interatomic interactions in both the bulk and surface regions. Subsequent Monte Carlo simulations reveal that first surface layer Pt segregation is compensated by Pt depletion in the second subsurface layer. This indicates that the core’s ordered state is not affected by surface thermodynamics as much as previously thought. Thus, the weak ordering experimentally observed is likely not due to fundamental thermodynamic limitations but rather to kinetic effects.
pacs:
75.50.Tt, 61.46.+w, 64.70.Nd, 61.66.DkUnderstanding the physics of the transition from bulk to nanoscale magnetic alloys is important from both a fundamental Fundam and technological point of view. In the last decade, Fe-Pt nanoparticles have been intensively investigated in view of possible future applications as an ultra-high density information-storage medium and high-performance permanent magnets FePt-nano ; NanoSize ; Liu-Harrell . The critical issue for information-storage application is the presence of magnetic anisotropy offering sufficiently large thermal stability. In Fe-Pt, a high magnetic anisotropy is guaranteed by an ordered L10 phase. However, recent experimental observations have shown a difficulty in obtaining a high degree of L10 order in FePt nanoparticles annealed at 600∘C with diameter less than 4nm NanoSize ; Sint . Due to the high surface to volume ratio of nanoparticles, surface segregation has been suggested to be one of the possible causes of this reduced ordering RCWB-05 ; Asta05-06 ; Albe05-07 (interestingly, in FeC and FeMoC nanoparticles, size plays the opposite role inducing a disorder-order transition art36-39 ).
In this letter, we address the FePt surface segregation problem with accurate ab initio computational thermodynamics techniques. In earlier studies, the phenomenon was tackled using several interatomic model potentials Asta05-06 ; Albe05-07 ; Wiest07 . Pair interactions were fitted to the experimental phase diagram Asta05-06 ; Albe05-07 , and to bulk first principles data Asta05-06 . A single-layer isotropic surface potential was estimated from the surface energy difference between pure fcc Fe and Pt Asta05-06 and by fitting to experimental segregation profiles Albe05-07 . The Embedded Atom Method potential was used in Ref. [Wiest07, ]. More recently, surface segregation in small Fe-Pt clusters was studied by direct comparison of the energies of several different configurations obtained from first principles Gruner08 . Our approach is radically different: the surface potential is obtained from ab initio calculations without fitting to experimental data and without a-priori assumptions about strength and isotropy. We combine the surface potential obtained using the method just described and the bulk pair potential RCWB-05 into a local (inhomogeneous) cluster expansion LCEs , enabling efficient Monte Carlo simulations to describe the nanoparticle’s actual thermodynamic equilibrium segregation profile. The temperature and size dependencies of the L10 order identify the regimes when surface segregation is responsible for reduced equilibrium order with correspondingly low magnetic anisotropy.
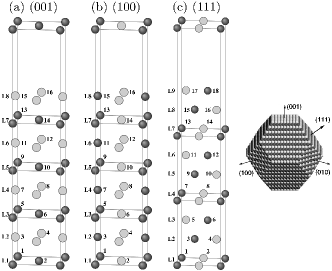
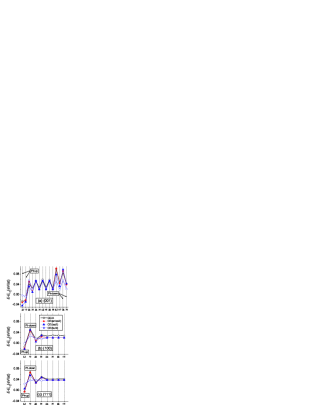
The nanoparticle is modeled as an fcc-based “truncated octahedron” (Fig. 1), which is typically observed for chemically synthesized FePt nanoparticles Fundam ; TO-exper with free boundary conditions. The initial atomic configuration is considered as ordered L10 with alternating Fe and Pt layers forming (001) fcc crystal planes. This particle has three inequivalent types of surfaces, (001), (100), and (111), which are addressed by using standard periodic slab geometries (Fig. 1). The vacuum layer thickness was chosen to be approximately equal to three fcc lattice parameters. As well as perfectly ordered slabs, defected surfaces obtained by exchange(s) of atoms belonging to different atomic layers are considered. The energies were calculated from first principles within the Generalized Gradient Approximation using Projector Augmented Wave pseudopotentials, as implemented in the VASP package VASP ; noteVASP . The calculated slab energy differences are presented in Fig. 2. In agreement with previous theoretical Asta05-06 ; Wiest07 ; Gruner08 ; Ruban99-09 and experimental reports ExpSegr , the data indicates that there is an energetic gain for Pt atoms to segregate into all three considered surfaces. However, this finding is not sufficiently compelling to determine the thermodynamic equilibrium of the system.
| Layers | Cluster Expansions | |||||||
|---|---|---|---|---|---|---|---|---|
| (lmn) | bulk | iso1 | iso2 | 100iso1 | 100iso2 | aniso1 | aniso2 | |
| (eV) | ||||||||
| (001) | 8 | 0 | -0.33 | -0.13 | -0.264 | -0.065 | -0.284 | 0.102 |
| 7 | 0 | 0 | 0.201 | 0 | 0.199 | 0 | 0.386 | |
| 2 | 0 | 0 | 0.201 | 0 | 0.199 | 0 | 0.050 | |
| 1 | 0 | -0.33 | -0.13 | -0.264 | -0.065 | -0.222 | -0.172 | |
| (100) | 2 | 0 | 0 | 0.201 | 0 | 0.199 | 0 | 0.160 |
| 1 | 0 | -0.33 | -0.13 | -0.264 | -0.065 | -0.284 | -0.124 | |
| (111) | 2 | 0 | 0 | 0.201 | 0 | 0.207 | 0 | 0.207 |
| 1 | 0 | -0.33 | -0.13 | -0.531 | -0.324 | -0.531 | -0.324 | |
| LSF Error(eV/at) | ||||||||
| (001) | 0.026 | 0.021 | 0.013 | 0.020 | 0.012 | 0.020 | 0.004 | |
| (100) | 0.015 | 0.009 | 0.007 | 0.002 | 0.006 | 0.008 | 0.002 | |
| (111) | 0.022 | 0.011 | 0.008 | 0.008 | 0.003 | 0.008 | 0.003 | |
| Total | 0.023 | 0.016 | 0.011 | 0.015 | 0.009 | 0.015 | 0.003 | |
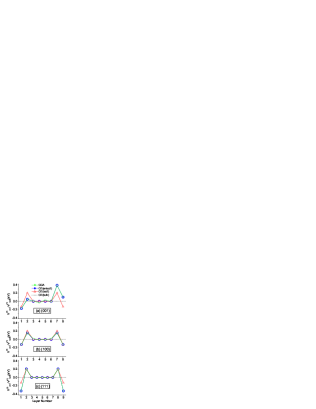
To parameterize the entropic contributions to surface segregation, a number of local cluster expansions (LCE) are constructed so that they reproduce atom exchange energies obtained from total energy calculations both in the bulk and in the surfaces. The local (or inhomogeneous) nature of the cluster expansions (CE) manifests itself by the presence of a layer-dependent unary mixing potential (see Eqs. (4,7) in RCWB-05 ). Such a layer dependence near the surface may be formally considered as an external surface potential applied to the surface atoms. The constructed LCEs differ from each other by the number of external layers affected by surface potential and by the directional dependence of surface potential. The constructed LCEs and their accuracy in surface regions are presented in Fig. 3 and Tab. 1. The previously proposed bulk CE RCWB-05 has to be modified only at two external surface layers (see Fig. 3) so that only the LCEs with one and two layers of surface potentials have to be considered. Comparing the prediction errors of different CEs, it is concluded that accounting for surface the potential within the second layer has a larger effect than considering the anisotropy in the surface potential. Hence, we conclude that the “iso2” LCE (with isotropic two-layer surface potential) represents the best compromise between the accuracy and complexity of calculations. Note that the “iso1” surface potential (-0.33 eV) is very similar to the corresponding surface potential (-0.30 eV) obtained in Refs. [Asta05-06, ; Albe05-07, ] with different approaches.
The cluster expansion is then employed in a finite-temperature Monte Carlo simulation scheme RCWB-05 . While spanning the phase space, the L10 order is monitored by the “generalized” parameter :
| (1) |
where is the statistical average over the Monte Carlo steps, and three directional parameters are defined as the difference between the Pt atom concentrations at odd and even crystal planes perpendicular to the i-th direction. The generalization is required for small nanoparticles, because, in the presence of a surface potential, we have observed that all can be comparable in wide temperature intervals. Generally, we can not neglect in Eq. (1) as it was done Ref. [RCWB-05, ]. In the case of isotropic order, , we have .
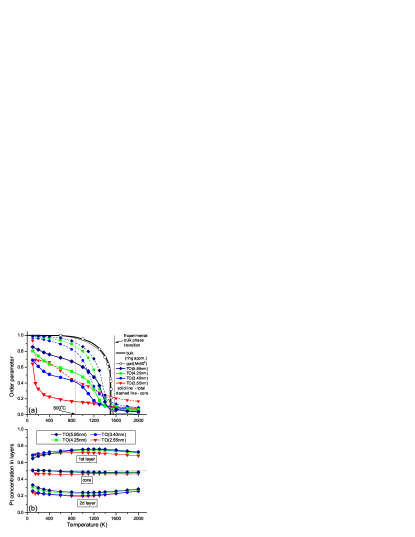
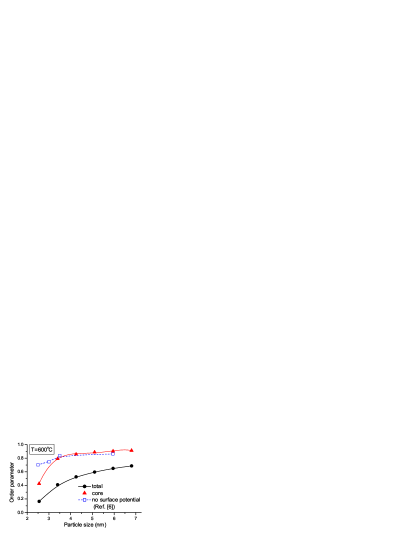
The results of our Monte Carlo simulations with the “iso2” cluster expansion are presented in Figs. 4-5. The comparison of the present and previous RCWB-05 results confirms that the presence of a surface potential reduces the total order in agreement with Refs. [Asta05-06, ; Albe05-07, ]. The reduction is larger for smaller particles having a bigger fraction of surface versus volume. In addition, there is a negligible effect of the surface potential on the core order parameter for particles larger than 3.4nm, followed by a still considerable total order parameter (0.4-0.5 of maximum value at 600∘C). Only for particles smaller than 3.4nm, is there a strong reduction in order.
Figure 4(b) shows that the Pt-segregation into the first external layer is compensated by Pt-depletion in the second layer so that the composition of the core remains close to ideal. This is a direct consequence of the values of the surface potential “iso2” for the two external layers, similar in magnitude but with opposite sign (Fig. 3 and Tab. 1). Consequently, as the core remains close to stoichiometry, its ordered state is affected by surface thermodynamics less than that previously concluded Asta05-06 ; Albe05-07 .
Our model considers only configurational entropy and neglects other effects. For instance, the effects of vibrational avdw:vibrev or magnetic RubAbr entropies are not included. However, the good agreement between the measured and calculated bulk transition temperatures (Fig. 4) suggests that these corrections are small in the important range C. Furthermore, we have also considered nanoparticles embedded in vacuum rather than in the polymeric medium typically used. Nevertheless, our surface potential is similar to previous estimates based on experimental data Albe05-07 and, more importantly, our most crucial observation pertains to the second subsurface atomic layer, which is clearly less sensitive to the surrounding media. Therefore, our findings reopen the possibility that the weak ordering observed experimentally is not due to fundamental thermodynamic limitations but probably to kinetic effects Exper-KIN that may be easier to control RCWB-05 .
This research was supported by ONR (N00014-07-1-0878, N00014-07-1-1085, N00014-09-1-0921), NSF (DMR-0639822), and DOE (DE-FG07-071D14893). Computational support was provided by the TeraGrid resources at TACC (MCA-07S005), NCSA and SDSC (TG-DMR050013N).
References
- (1) I. M. L. Billas, A. Chtelain, and W. A. de Heer, Science 265, 1682 (1994); F. Baletto and R. Ferrando, Rev. Mod. Phys. 77, 371 (2005); M. L. Tiago et al., Phys. Rev. Lett. 97, 147201 (2006).
- (2) S. Sun et al., Science 287, 1989 (2000); H. Zeng et al., Nature 420, 395 (2002); S. Sun, Adv. Mater. 18, 393 (2006); S. D. Bader, Rev. Mod. Phys. 78, 1 (2006).
- (3) Y. K. Takahashi et al., J. Appl. Phys. 93, 7166 (2003); T. Miyazaki et al., Phys. Rev. B 72, 144419 (2005); C. Rong et al., Adv. Mater. 18, 2984 (2006).
- (4) J. P. Liu et al., IEEE Trans. Magn. 42,3036 (2006); S. Kang et al., J. Appl. Phys. 101, 09J113 (2007); U. Wiedwald et al., Appl. Phys. Lett. 90, 062508 (2007).
- (5) Annealing at 600∘C results in sintering of nanoparticles into larger agglomerates.
- (6) R. V. Chepulskii, J. Velev, and W. H. Butler, J. Appl. Phys. 97, 10J311 (2005); R. V. Chepulskii and W. H. Butler, Phys. Rev. B 72, 134205 (2005).
- (7) B. Yang et al., Scripta Materialia, 53, 417 (2005); Acta Materialia, 54, 4201 (2006).
- (8) M. Müller and K. Albe, Phys. Rev. B 72, 094203 (2005); M. Müller, P. Erhart, and K. Albe, Phys. Rev. B 76, 155412 (2007).
- (9) C. Srivastava et al., J. Appl. Phys. 102, 104310 (2007).
- (10) A. R. Harutyunyan et al., Phys. Rev. Lett. 100, 195502 (2008); S. Curtarolo et al., Phys. Rev. B, 78, 054105 (2008).
- (11) M. E. Gruner et al., Phys. Rev. Lett. 100, 087203 (2008).
- (12) J. M. Sanchez and F. Ducastelle and D. Gratias, Physica 128A, 334 (1984); A. Van der Ven et al., Phys. Rev. B 64, 184307 (2001); A. Van der Ven and G. Ceder, Phys. Rev. B 71, 054102 (2005).
- (13) L. D. Marks, Rep. Prog. Phys. 57 603 (1994); M. J. Yacaman et al., J. Vac. Sci. Technol. B 19, 1091 (2001); Z. R. Dai, S. Sun, and Z. L. Wang, Surf. Sci. 505, 325 (2002).
- (14) Y. Wang and J. P. Perdew, Phys. Rev. B 44, 13298 (1991); G. Kresse and J. Furthmüller, Comput. Mater. Sci. 6, 15 (1996).
- (15) All ferromagnetic structures were fully relaxed (cell shape and volume and atom cell-internal positions) but preserving the empty space between the slabs. Numerical convergence to within about 1 meV/atom is ensured by enforcing a high energy cut-off (400 eV) and dense (14142 and 1571) Monkhorst-Pack k-point meshes.
- (16) A. V. Ruban, H. L. Skriver, and J. K. Nørskov, Phys. Rev. B 59, 15990 (1999); A. U. Nilekar, A. V. Ruban, and M. Mavrikakis, Surf. Sci. 603, 91 (2009).
- (17) P. Beccat et al., Surf. Sci. 238, 105 (1990); R. Baudoing Savois, Y. Gauthier, and W. Moritz, Phys. Rev. B 44, 12977 (1991); R. M. Wang et al., Phys. Rev. Lett. 100, 017205 (2008); K. L. Torres and G. B. Thompson, Ultramicroscopy 109, 606 (2009).
- (18) R.V. Chepulskii, Solid State Commun. 115, 497 (2000); Phys. Rev. B 69, 134431 (2004).
- (19) A. van de Walle and G. Ceder, Rev. Mod. Phys. 74, 11 (2002).
- (20) A. V. Ruban and I. A. Abrikosov, Rep. Prog. Phys. 71, 046501 (2008).
- (21) A possible experimental confirmation of the conclusion can be made based on the data of Liu-Harrell , in which it was shown that the atomic order can be increased by NaCl treatment, ion irradiation, and by increase of temperature and/or annealing time, indicating underlying kinetic issues.