R. Mizuk
Institute for Theoretical and Experimental Physics, Moscow
I. Adachi
High Energy Accelerator Research Organization (KEK), Tsukuba
H. Aihara
Department of Physics, University of Tokyo, Tokyo
K. Arinstein
Budker Institute of Nuclear Physics, Novosibirsk
Novosibirsk State University, Novosibirsk
T. Aushev
École Polytechnique Fédérale de Lausanne (EPFL), Lausanne
Institute for Theoretical and Experimental Physics, Moscow
A. M. Bakich
University of Sydney, Sydney, New South Wales
V. Balagura
Institute for Theoretical and Experimental Physics, Moscow
E. Barberio
University of Melbourne, School of Physics, Victoria 3010
A. Bay
École Polytechnique Fédérale de Lausanne (EPFL), Lausanne
K. Belous
Institute of High Energy Physics, Protvino
V. Bhardwaj
Panjab University, Chandigarh
A. Bozek
H. Niewodniczanski Institute of Nuclear Physics, Krakow
M. Bračko
University of Maribor, Maribor
J. Stefan Institute, Ljubljana
T. E. Browder
University of Hawaii, Honolulu, Hawaii 96822
M.-C. Chang
Department of Physics, Fu Jen Catholic University, Taipei
A. Chen
National Central University, Chung-li
B. G. Cheon
Hanyang University, Seoul
C.-C. Chiang
Department of Physics, National Taiwan University, Taipei
R. Chistov
Institute for Theoretical and Experimental Physics, Moscow
I.-S. Cho
Yonsei University, Seoul
S.-K. Choi
Gyeongsang National University, Chinju
Y. Choi
Sungkyunkwan University, Suwon
J. Dalseno
High Energy Accelerator Research Organization (KEK), Tsukuba
M. Danilov
Institute for Theoretical and Experimental Physics, Moscow
S. Eidelman
Budker Institute of Nuclear Physics, Novosibirsk
Novosibirsk State University, Novosibirsk
N. Gabyshev
Budker Institute of Nuclear Physics, Novosibirsk
Novosibirsk State University, Novosibirsk
P. Goldenzweig
University of Cincinnati, Cincinnati, Ohio 45221
B. Golob
Faculty of Mathematics and Physics, University of Ljubljana, Ljubljana
J. Stefan Institute, Ljubljana
H. Ha
Korea University, Seoul
J. Haba
High Energy Accelerator Research Organization (KEK), Tsukuba
B.-Y. Han
Korea University, Seoul
T. Hara
High Energy Accelerator Research Organization (KEK), Tsukuba
Y. Hasegawa
Shinshu University, Nagano
K. Hayasaka
Nagoya University, Nagoya
Y. Hoshi
Tohoku Gakuin University, Tagajo
W.-S. Hou
Department of Physics, National Taiwan University, Taipei
H. J. Hyun
Kyungpook National University, Taegu
T. Iijima
Nagoya University, Nagoya
K. Inami
Nagoya University, Nagoya
A. Ishikawa
Saga University, Saga
H. Ishino
[
Tokyo Institute of Technology, Tokyo
R. Itoh
High Energy Accelerator Research Organization (KEK), Tsukuba
M. Iwasaki
Department of Physics, University of Tokyo, Tokyo
Y. Iwasaki
High Energy Accelerator Research Organization (KEK), Tsukuba
N. J. Joshi
Tata Institute of Fundamental Research, Mumbai
D. H. Kah
Kyungpook National University, Taegu
J. H. Kang
Yonsei University, Seoul
P. Kapusta
H. Niewodniczanski Institute of Nuclear Physics, Krakow
H. Kawai
Chiba University, Chiba
T. Kawasaki
Niigata University, Niigata
H. J. Kim
Kyungpook National University, Taegu
H. O. Kim
Kyungpook National University, Taegu
J. H. Kim
Sungkyunkwan University, Suwon
Y. I. Kim
Kyungpook National University, Taegu
Y. J. Kim
The Graduate University for Advanced Studies, Hayama
K. Kinoshita
University of Cincinnati, Cincinnati, Ohio 45221
B. R. Ko
Korea University, Seoul
S. Korpar
University of Maribor, Maribor
J. Stefan Institute, Ljubljana
P. Križan
Faculty of Mathematics and Physics, University of Ljubljana, Ljubljana
J. Stefan Institute, Ljubljana
P. Krokovny
High Energy Accelerator Research Organization (KEK), Tsukuba
A. Kuzmin
Budker Institute of Nuclear Physics, Novosibirsk
Novosibirsk State University, Novosibirsk
Y.-J. Kwon
Yonsei University, Seoul
S.-H. Kyeong
Yonsei University, Seoul
J. S. Lange
Justus-Liebig-Universität Gießen, Gießen
M. J. Lee
Seoul National University, Seoul
S. E. Lee
Seoul National University, Seoul
T. Lesiak
H. Niewodniczanski Institute of Nuclear Physics, Krakow
T. Kościuszko Cracow University of Technology, Krakow
C. Liu
University of Science and Technology of China, Hefei
Y. Liu
Nagoya University, Nagoya
D. Liventsev
Institute for Theoretical and Experimental Physics, Moscow
R. Louvot
École Polytechnique Fédérale de Lausanne (EPFL), Lausanne
D. Marlow
Princeton University, Princeton, New Jersey 08544
A. Matyja
H. Niewodniczanski Institute of Nuclear Physics, Krakow
S. McOnie
University of Sydney, Sydney, New South Wales
K. Miyabayashi
Nara Women’s University, Nara
H. Miyata
Niigata University, Niigata
Y. Miyazaki
Nagoya University, Nagoya
T. Mori
Nagoya University, Nagoya
E. Nakano
Osaka City University, Osaka
M. Nakao
High Energy Accelerator Research Organization (KEK), Tsukuba
H. Nakazawa
National Central University, Chung-li
Z. Natkaniec
H. Niewodniczanski Institute of Nuclear Physics, Krakow
S. Nishida
High Energy Accelerator Research Organization (KEK), Tsukuba
O. Nitoh
Tokyo University of Agriculture and Technology, Tokyo
T. Ohshima
Nagoya University, Nagoya
S. Okuno
Kanagawa University, Yokohama
S. L. Olsen
University of Hawaii, Honolulu, Hawaii 96822
P. Pakhlov
Institute for Theoretical and Experimental Physics, Moscow
G. Pakhlova
Institute for Theoretical and Experimental Physics, Moscow
C. W. Park
Sungkyunkwan University, Suwon
H. Park
Kyungpook National University, Taegu
H. K. Park
Kyungpook National University, Taegu
R. Pestotnik
J. Stefan Institute, Ljubljana
L. E. Piilonen
IPNAS, Virginia Polytechnic Institute and State University, Blacksburg, Virginia 24061
H. Sahoo
University of Hawaii, Honolulu, Hawaii 96822
K. Sakai
Niigata University, Niigata
Y. Sakai
High Energy Accelerator Research Organization (KEK), Tsukuba
O. Schneider
École Polytechnique Fédérale de Lausanne (EPFL), Lausanne
C. Schwanda
Institute of High Energy Physics, Vienna
A. Sekiya
Nara Women’s University, Nara
K. Senyo
Nagoya University, Nagoya
M. Shapkin
Institute of High Energy Physics, Protvino
V. Shebalin
Budker Institute of Nuclear Physics, Novosibirsk
Novosibirsk State University, Novosibirsk
J.-G. Shiu
Department of Physics, National Taiwan University, Taipei
B. Shwartz
Budker Institute of Nuclear Physics, Novosibirsk
Novosibirsk State University, Novosibirsk
S. Stanič
University of Nova Gorica, Nova Gorica
M. Starič
J. Stefan Institute, Ljubljana
T. Sumiyoshi
Tokyo Metropolitan University, Tokyo
Y. Teramoto
Osaka City University, Osaka
I. Tikhomirov
Institute for Theoretical and Experimental Physics, Moscow
K. Trabelsi
High Energy Accelerator Research Organization (KEK), Tsukuba
S. Uehara
High Energy Accelerator Research Organization (KEK), Tsukuba
T. Uglov
Institute for Theoretical and Experimental Physics, Moscow
Y. Unno
Hanyang University, Seoul
P. Urquijo
University of Melbourne, School of Physics, Victoria 3010
G. Varner
University of Hawaii, Honolulu, Hawaii 96822
K. E. Varvell
University of Sydney, Sydney, New South Wales
K. Vervink
École Polytechnique Fédérale de Lausanne (EPFL), Lausanne
C. H. Wang
National United University, Miao Li
M.-Z. Wang
Department of Physics, National Taiwan University, Taipei
P. Wang
Institute of High Energy Physics, Chinese Academy of Sciences, Beijing
X. L. Wang
Institute of High Energy Physics, Chinese Academy of Sciences, Beijing
Y. Watanabe
Kanagawa University, Yokohama
R. Wedd
University of Melbourne, School of Physics, Victoria 3010
E. Won
Korea University, Seoul
B. D. Yabsley
University of Sydney, Sydney, New South Wales
Y. Yamashita
Nippon Dental University, Niigata
C. Z. Yuan
Institute of High Energy Physics, Chinese Academy of Sciences, Beijing
C. C. Zhang
Institute of High Energy Physics, Chinese Academy of Sciences, Beijing
Z. P. Zhang
University of Science and Technology of China, Hefei
V. Zhulanov
Budker Institute of Nuclear Physics, Novosibirsk
Novosibirsk State University, Novosibirsk
T. Zivko
J. Stefan Institute, Ljubljana
A. Zupanc
J. Stefan Institute, Ljubljana
O. Zyukova
Budker Institute of Nuclear Physics, Novosibirsk
Novosibirsk State University, Novosibirsk
Abstract
From a Dalitz plot analysis of decays, we find a
signal for with a mass , width ,
product branching fraction
, and significance of
that agrees with previous Belle measurements based on
the same data sample.
In addition, we determine the branching fraction
and the fraction of
mesons that are longitudinally polarized .
These results are obtained from a data sample that contains
657 million pairs collected near the
resonance with the Belle detector at the KEKB asymmetric energy
collider.
pacs:
14.40.Gx, 12.39.Mk, 13.25.Hw
now at ]Okayama University, Okayama The Belle Collaboration
I Introduction
In a paper on the B meson decay process conjugate , the Belle Collaboration Z4430
reported the observation of a distinct and relatively narrow peak in
the mass spectrum near .
The analysis was performed by excluding the events in the
regions of the and , and fitting the
one-dimensional distribution. The fit gave a resonance
mass and width of
and
, where the first
uncertainty is statistical and the second is systematic; the
significance of the resonance was .
If this peak, called the , is interpreted as a meson state, then
it must have an exotic structure; its minimal quark content is
.
The observation motivated a subsequent Belle study of the process
, where a doubly peaked structure was observed in
the invariant mass distribution Z4040 . In this
channel, the observed structure is rather wide, therefore a full
Dalitz plot analysis was used in order to establish that the observed
peaks could be unambiguously associated with dynamics in the
channel. If these peaks, called the and
, are attributed to meson states, a minimal four-quark
substructure is required.
A recently reported study of decays by the BaBar
Collaboration BaBar_Z4430 did not find a significant signal for
; the reported significance is at the level. The BaBar sample of decays is
about 85% the size of the corresponding Belle data sample.
In this paper we present a reanalysis of the Belle
data sample using a Dalitz plot formalism.
The Belle detector BELLE_DETECTOR is a large-solid-angle
magnetic spectrometer that operates at the KEKB asymmetric-energy
collider kekb . A data sample corresponding to an
integrated luminosity of collected at the
resonance and containing 657 million pairs
is used.
A GEANT-based Monte Carlo (MC) simulation geant is used to
model the response of the detector.
II Event Selection
We select events of the type and
, where the decays either to or
with ( or ),
. We use the same selection criteria as in
Ref. Z4430 .
In particular, we identify mesons using the beam-energy
constrained mass and the energy
difference , where is the
center-of-mass (c.m.) beam energy, is the vector sum of the
c.m. momenta of the meson decay products and is their
c.m. energy sum. We select events with (
is the world-average -meson mass PDG ) and ,
which are both windows around the peak values. To
model combinatorial backgrounds, we use events that are in the
signal region and the sidebands defined as
.
To improve the definition of the Dalitz plot boundaries for both
signal and sideband events, we perform a mass-constrained fit to the
candidates from both regions.
Simulations of the two decay modes indicate that the
experimental resolution for is for
both modes.
III Dalitz plot distribution
We sum the Dalitz distributions for and
candidates. Due to the mass difference between
and the corresponding Dalitz plots have slightly different
boundaries. We find that this has a negligible effect on the results
of the Dalitz analysis. The Dalitz plot for the signal region is
shown in Fig. 1. Here vertical bands corresponding to the
and the are evident. The horizontal cluster
of entries in the vicinity of
constitutes the signal reported in Ref. Z4430 .
Figure 1: The Dalitz plot for the signal
region. The solid (dashed) lines delimit the five vertical (three
horizontal) slices that are used to present the fit results in
subsequent figures. The coordinates of the vertical lines are
, ,
and ; the coordinates of the
horizontal lines are and
.
In the following, we illustrate the results of different fits using
projected histograms of the slices of the Dalitz plot indicated by the
vertical solid lines and horizontal dashed lines shown in
Fig. 1. The three horizontal slices correspond to
regions below, around and above the mass region.
The five vertical slices distinguish the and
regions and bands above, below and in between
them. The sum of the latter three projections corresponds to the
veto used in Ref. Z4430 .
IV Formalism of the Dalitz analysis
The decay with the reconstructed in the
decay mode is described by four variables (assuming the
width of the to be negligible). These are taken to be
, , the helicity angle () and
the angle between the production and decay planes (). In
this analysis we integrate over the angular variables and
. The MC indicates that the reconstruction efficiency is almost
uniform over the full angular range; after integration over
this angle the contribution from interference between the different
helicity states is negligibly small. This allows the to
be treated as a stable particle in the Dalitz analysis.
In the channel, the is likewise treated as
stable. The system in this decay is predominantly in an
-wave BES_pipijp ; in this limit, the and
helicity states are the same, and we again find negligible
interference contributions after integration over decay angles.
Thus, our approach is the same as in the Dalitz analysis of the
decays in Ref. Z4040 .
The amplitude for the three-body decay is a sum over
different quasi-two-body modes; resonances are described by
relativistic Breit-Wigner functions with angular dependence.
As the default fit model, we include all known low-lying
resonances [the or , and the ,
, , , and ] and
a single exotic resonance.
In addition to the physics model, the fit function includes a
background term derived from the sidebands and is modulated by
the MC-determined experimental efficiency.
The MC sample is generated using the world-average branching
fractions PDG while to fix the relative fractions of the
and contributions we use isospin symmetry.
The Dalitz plots for the sideband and the MC sample are
smoothed.
The expression for the amplitudes, signal component of the fit
function, and other details of the fitting procedure are the same as
used in the analysis described in Ref. Z4040 .
V Fit results
The eight projected Dalitz plot slices with fit results for the
default model superimposed are shown in Fig. 2.
The signal is most clearly seen in the third vertical slice.
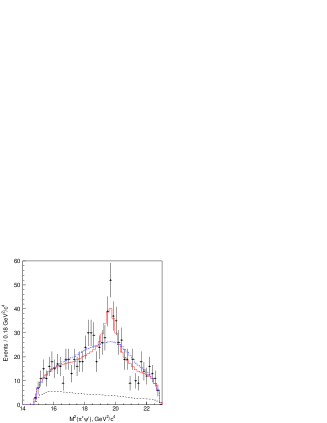
Figure 2: Dalitz plot projections for the slices defined in
Fig. 1: (a)-(e) correspond to vertical slices from left
to right, (f)-(h) correspond to horizontal slices from bottom to
top; in (f)-(h), plots including the full vertical scale are shown
inset. The points with error bars represent data, the solid (dotted)
histograms are the fit results for the default model that includes
all low-lying resonances and a single (without any)
state, and the dashed histograms represent the background.
The sum of the 1st, 3rd and 5th vertical slices (i.e. a Dalitz
plot projection with the veto applied) is shown in
Fig. 3.
Figure 3: The Dalitz plot projection with the veto applied.
The points with error bars represent data, the solid (dotted)
histogram is the Dalitz plot fit result for the fit model with all
resonances and a single (without any) state, and the
dashed histogram represents the background.
The resonance parameters determined from the fit are
and .
The central values agree well with the parameters reported in
Ref. Z4430 , while the errors are somewhat larger. The
statistical significance, calculated from the change in
when the is included in the fit (taking the added degrees of
freedom into account) is . The fit fractions and
significances for all of the components are listed in
Table 1.
Table 1: The fit fractions and significances of all contributions for
the fit models with the default set of resonances and a
single resonance.
Contribution
Fit fraction (%)
Significance
large
The confidence level (C.L.) of the fit model with (without) the
is 36% (0.1%). The C.L.’s are determined using ensembles of the MC
simulated experiments.
To study the model dependence, we consider a variety of other fit
hypotheses. These include: successively removing each resonance
component; adding, for each case, a non-resonant phase-space term;
relaxing the constraints on the mass and width; replacing the
with the LASS group’s parameterization for the
-wave amplitude LASS , and including another ()
resonance with mass and width left as free parameters.
The lowest significance of corresponds to the model
with a non-resonant phase-space term and a new resonance.
We treat the maximum variation of the parameters from these
different fit models as the systematic uncertainty. The resulting
uncertainty estimates are given in the first row of
Table 2.
We find the uncertainty due to the variation of the parameter in
the Blatt-Weisskopf form factors blatt-weisskopf to be
negligible. The contribution of the uncertainties in the mass and
width of intermediate resonances that are fixed in the fit is
also found to be negligible.
We vary the assumption about the value of the decay orbital
angular momentum () for those cases where several possibilities
exist. The resulting uncertainties are given in the second row in
Table 2.
In the fits described above, the spin of the is assumed to be
zero. We find that the assumption does not significantly improve
the fit quality. The variations in the parameters for the
different spin assignments are considered as systematic uncertainties
and are listed in the third row in Table 2.
We consider alternative smoothing procedures for sidebands and
MC samples. The corresponding variation of the parameters are
given in the fourth row in Table 2.
To obtain the total systematic uncertainties, the values given in
Table 2 are added in quadrature. The resulting mass, width
and fit fraction are , ,
.
Table 2: Systematic uncertainties in the mass, width and fit
fraction due to various sources.
Fit fraction, %
Fit model
assignment
spin assignment
Smoothing procedure
VI Other fits
In principle, more complex mass structures can be produced by
reflections from higher partial waves. To examine this, we
perform the Dalitz plot fit with a resonance term added
to the default model (see Fig. 4).
Figure 4: Dalitz plot projections as described for
Fig. 2. The points with error bars represent data, the
solid (dotted) histograms are the fit results for the model that
includes all low-lying resonances as well as the
and a single (without any) state, and the
dashed histograms represent the background.
In this case, the signal persists with mass and width within
of their default model values and with a statistical
significance of . However, the fit
fractions — 6.8% and 6.6% for the and non- hypotheses,
respectively — are very large for a resonance with a peak mass that
is () above the
kinematic limit for decays and for which only a small
portion of the low-mass tail of the resonance is accessible. Moreover
decay has an centrifugal barrier and
the branching fraction is only
PDG .
For these reasons, the significance estimate from this
fit model is likely to be an underestimate of the real value.
Studies of other decays where the can contribute
(e.g. and ) may provide further
insight.
The C.L. of the default model with an additional contribution from the
is 58% (6%) for the (non-) hypothesis.
The significant contribution is concentrated in a small area of
the Dalitz plot.
If a second state is added to the fit, we find a mass
and a width , with a
significance of .
Angular distributions for decays can be predicted based on the
Dalitz plot fit results and therefore provide a useful cross-check
(see Ref. Z4040 for details). We find good agreement between
data and predictions for various fit models. The statistics are not
sufficient to discriminate between models in our approach.
VII Branching fractions
To measure branching fractions we use only decays.
The yields of these decays with the reconstructed in the
and channels are found from fits to the
distributions to be and , respectively.
To determine the experimental efficiency, we used the phase-space MC
events weighted according to the results of the Dalitz plot fit. The
efficiencies are and for
and channels, respectively. The
uncertainties include the dependence on the Dalitz plot model (0.1%);
data and MC differences for track reconstruction ( per track),
and particle identification (4% for the pair and 4.2% for
); and MC statistics (0.6%). The uncertainties from
different sources are added in quadrature. The efficiencies are
corrected for the difference in lepton identification performance in
data compared to MC, (, determined from
and control samples.
Using as the number of pairs and
world-average values for the intermediate branching
fractions PDG , we determine .
This value is in agreement with BaBar’s value
BaBar_Z4430 (statistical error
only).
The branching fractions calculated for the two decay channels
are in good agreement: and
(statistical errors only).
The systematic error includes contributions from the uncertainties in
the efficiencies and the branching fractions of the intermediate
resonances.
Based on the fit fraction we find a product branching fraction
. This is in agreement
with the previous Belle result Z4430 and consistent with the
BaBar upper limit of BaBar_Z4430 .
The dominant feature of the decay process is the
intermediate state. Using the fit fraction from
Table 1, and evaluating systematic errors using the same
procedure as for the measurements, we determine the branching
fraction and the fraction of
mesons that are longitudinally polarized . The
branching fraction is somewhat below the world-average value of
PDG ; the longitudinal polarization
fraction agrees with the CLEOII result of and has
better precision fl_cleo .
VIII Conclusions
From a Dalitz plot analysis of decays, we find a
signal for with a mass , width and
product branching fraction
. The statistical
significance of this signal is ; the significance
including systematic uncertainty from the fit models is .
These results agree with, and supersede previous measurements based on
the same data sample reported in Ref. Z4430 .
In addition we determine the branching fraction
and the fraction of
mesons that are longitudinally polarized . These are the
first measurements of these quantities that are derived from a Dalitz
plot analysis.
Acknowledgments
We thank the KEKB group for excellent operation of the accelerator,
the KEK cryogenics group for efficient solenoid operations, and the
KEK computer group and the NII for valuable computing and SINET3
network support. We acknowledge support from MEXT, JSPS and Nagoya’s
TLPRC (Japan); ARC and DIISR (Australia); NSFC (China); DST (India);
MEST, KOSEF, KRF (Korea); MNiSW (Poland); MES and RFAAE (Russia); ARRS
(Slovenia); SNSF (Switzerland); NSC and MOE (Taiwan); and DOE (USA).
References
(1) The inclusion of charge-conjugate modes is implied
throughout this paper. By we mean the , also
known as the .
(2) S.-K. Choi et al. (Belle Collaboration),
Phys. Rev. Lett. 100, 142001 (2008).
(3) R. Mizuk et al. (Belle Collaboration), Phys. Rev. D
78, 072004 (2008).
(4) B. Aubert et al. (BaBar Collaboration),
arXiv:0811.0564 [hep-ex].
(5) A. Abashian et al. (Belle Collaboration),
Nucl. Instrum. Methods Phys. Res., Sect. A 499, 1 (2003).
(6) S. Kurokawa and E. Kikutani, Nucl. Instrum. Methods
Phys. Res., Sect. A 479, 117 (2002), and other papers included
in this volume.
(7) R. Brun et al., GEANT 3.21, CERN DD/EE/84-1, 1984.
(8) C. Amsler et al. (Particle Data Group), Phys. Lett.B
667, 1 (2008).
(9) J.Z. Bai et al. (BES Collaboration),
Phys. Rev. D 62, 032002 (2000).
(10) J. Blatt and V. Weisskopf, Theoretical
Nuclear Physics, p.361, New York: John Wiley & Sons (1952).
(11) D. Aston et al. (LASS Collaboration), Nucl. Phys. B
296, 493 (1988).
(12) S. J. Richichi et al. (CLEO Collaboration),
Phys. Rev. D 63, 031103 (2001).