Crystal-field ground state of the non-centrosymmetric superconductor CePt3Si:
a combined polarized soft X-ray absorption and polarized neutron study
Abstract
We determined the crystal-field split Hund’s rule ground state of the non-centrosymmetric heavy fermion superconductor CePt3Si with polarization dependent soft X-ray absorption spectroscopy (XAS) and polarized neutron scattering. We are also able to give the sequence of the crystal-field states from the temperature evolution of the linear dichroic signal in the XAS. The quantitative analysis of the XAS temperature dependence together with the neutron transition energies complete the identification of the crystal-field level scheme.
pacs:
71.27.+a, 75.10.Dg, 78.70.Dm, 78.70NxI Introduction
The discovery of superconductivity in the antiferromagnetic phases of the non-centrosymmetric heavy fermion compounds CePt3Si,BauerPRL92 CeIrSi3,Sugitani75 and CeRhSi3 Kimura95 stimulated a flurry of theoretical and experimental activities BauerPSJ76 ; FujimotoPSJ76 ; MathurNature394 ; SamokhinPRB69 with the main interest to understand the pairing state in the absence of inversion symmetry. It seems that the superconductivity is due to a mixture of singlet and triplet Cooper pairing and that the superconducting state is magnetically driven.GorkovPRL87 ; SaxenaNature427 The unusual properties evolve from the hybridized electrons so that the question arises which influence the highly anisotropic crystal-field ground state may have on the hybridization between and conduction electrons. Attempts were made to investigate this issue for the heavy fermion compound CeRu2Si2,Zwicknagl1992 and the semiconducting Kondo materials CeNiSn,Ikeda1996 ; Kagan1997 and CeRhAs Ishi2004 . More recently the aspect of -dependent hybridization was also studied in the CeMIn5 compounds.Mena2005 ; Burch2007 ; Ghaemi2007 ; WeberPRB78 However, reliable experimental input for such theoretical investigation is scarce due to experimental uncertainties in determining the ground state wave functions.
The wave functions and crystal-field levels are usually determined from a combined analysis of single crystal susceptibility and polycrystalline neutron scattering measurements. However, the method often fails because of thermal or powder averaging in either technique, and additionally, neutron scattering suffers from phonon contributions and broadened crystal-field levels due to hybridization effects.Park1998 Moreover, in the presence of magnetic order, anisotropic molecular field parameters have to be introduced in order to fit the static susceptibility, ending up with too many free parameters for a unique description. The methods to apply are then inelastic or elastic polarized neutron scattering on single crystals, the first technique requiring large single crystals, the second being very sensitive to absorption corrections when determining the magnetic form factor.
We have shown for the case of the heavy fermion material CePd2Si2 that soft X-ray absorption at the Ce M4,5 edges can be used complementary to neutron scattering in order to determine the ground state wave function.HansmannPRL100 XAS is highly sensitive to the initial state and via its polarization dependence direct information about the admixtures of the ground state wave function can be obtained. Sensitivity for higher lying crystal-field states is achieved by thermally populating those states. It was shown in Ref. HansmannPRL100, that the capability of XAS to resolve closely lying crystal-field states is not determined by the energy resolution of the experimental set-up, but rather by the temperature. However, the exact energy of crystal-field excitations is most accurately determined with inelastic polarized neutron scattering on single crystals where phonon and magnetic scattering can be separated. Hence it is ideal to combine both techniques.
CePt3Si orders antiferromagnetically at TN=2.2 K and enters a superconducting state at T0.75 K.BauerPRL92 The coexistence of both states has been confirmed by several experimental techniques.YogiPRL04 ; AmatoPRB05 The low-energy magnetic excitations were recently measured on a single crystal using inelastic neutron scattering.FakPRB78 CePt3Si crystallizes in the non-centrosymmetric tetragonal space group with lattice constants = 4.072 Å and = 5.442 Å.Tursina04 Inversion symmetry is broken by the absence of a mirror plane perpendicular to the -axis. However, the lack of inversion symmetry is irrelevant for the crystal-field description since the wave functions are even functions. Therefore, as in other centrosymmetric compounds, the Hund’s rule ground state of Ce3+ (, point group )FrigeriPRL92 splits under the influence of a tetragonal crystal-field, into three Kramer’s doublets, which can be represented in the basis of . The eigenfunctions of the three Kramer’s doublets can be written as
| (1) | |||||
with and an arbitrarily chosen phase of the mixed states.
Two groups have published inelastic neutron scattering data of CePt3Si powder samples in order to determine the crystal-field scheme. Bauer et al. BauerPB2005 found a broad distribution of magnetic intensity between 10 meV and 30 meV which was fitted with two non-resolved crystal-field excitations centered at 13 meV and 20 meV. The crystal-field parameters of Bauer et al. yield for the ground state wave function and as the highest excited state at 20 meV. Metoki et al. MetokiJCM16 found also a mixed ground state, but interpreted their neutron data with a very different ground state mixing of . According to their data the state is 1 meV above the ground state and the second mixed state is at 24 meV.
In this paper, we determine the ground state wave function from the low temperature XAS data, i.e. the value of the mixing factor , which gives the actual spatial distribution of the crystal-field ground state. We will further show that the temperature dependence of the XAS data determines the sequence of states. A quantitative modeling of the temperature dependence can even be done provided that the crystal-field energies are known. The latter are determined from the polarized inelastic neutron data presented here. Thus a complete picture of the crystal-field level scheme has been achieved.
II Experimental
The CePt3Si single crystal used for this study was the same as in Ref. FakPRB78, . A thin slice was cut from this crystal and used for the XAS measurements. We recorded all spectra using the total electron yield method in a chamber with a pressure of 4 x 10-11 mbar at the UE-46 PGM-1 undulator beam line of BESSY II. The total electron yield signal was normalized to the incoming photon flux as measured at the refocusing mirror. Clean sample surfaces were obtained by cleaving the samples in situ. The energy resolution at the cerium edges ( eV) was set at 0.15 eV. Further, the undulator together with a normal incident measurement geometry allow for a change of polarization without changing the probed spot on the sample surface. This guarantees a reliable comparison of the spectral line shapes. The two polarizations were and , being the long tetragonal axis. The sample was cleaved and then cooled down to the lowest accessible temperature. Spectra were taken at 5 K, 50 K, 150 K, and 200 K while warming up. In order to assure reproducibility of the data the sample was cleaved a second time and then data were taken in the sequence 300 K, 50 K and 80 K.
Inelastic neutron scattering measurements using polarization analysis were performed on the thermal triple-axis spectrometer IN20 at the high-flux reactor of the Institut Laue-Langevin. Horizontally focusing Heusler monochromator and analyzer were used in combination with relaxed collimation and a fixed final energy of 14.7 meV with an energy resolution (full width at half maximum, FWHM) of 0.6 meV. Higher-order neutrons were removed from the scattered beam using a graphite filter and their contribution to the monitor count rate was corrected for. Measurements were performed in the paramagnetic phase at a temperature of 5 K with the wave-vector transfer Q either parallel to the or to the axis, but with the same value of , to eliminate the influence of the magnetic form factor to the measured intensities. The use of polarization analysis in combination with a single crystal has two advantages for crystal-field determinations compared with standard methods of unpolarized neutrons on a polycrystalline material: (i) Scattering from phonons can easily be subtracted; (ii) Separation of the components of the angular momentum operator to the transition matrix elements between the initial state and the final state , where reflects the fact that only components perpendicular to Q are observed in neutron scattering experiments.
We measured the three polarization components of the spin-flip cross-section , where is parallel to Q, is perpendicular to Q in the horizontal scattering plane, and is vertical. The pure magnetic scattering is given by the difference of the spin-flip cross-sections and or, more specifically for the present set-up, the different transition matrix elements of the operator are given by for and for or for . The three independent determinations of are identical within statistical uncertainty. The measured non-spin-flip cross-section shows no strong intensity that could leak through to the spin-flip channels via the finite flipping ratio of 20–23, which corresponds to a neutron polarization efficiency of 95% at both polarizer and analyzer.
III Results and discussion
For the C4v point symmetry the crystal-field Hamiltonian describes the crystal field potential when the three Stevens parameters , , and are determined. Alternatively the crystal-field potential can be expressed in terms of the transition energies and between the crystal-field states within the multiplet and the mixing parameter . We performed ionic full multiplet calculations using the XTLS 8.3 programTanakaJPSC63 to calculate the XAS spectra. All atomic parameters were given by Hartree-Fock values, with a reduction of about 35% for the Coulomb interactions and about 20% for the interactions to reproduce best the experimental isotropic spectra, . This accounts for the configuration interaction effects not included in the Hartree-Fock scheme. Once the atomic parameters are fine tuned to the isotropic spectra, the polarized XAS data can be described by the incoherent sums of the respective polarization dependent spectra of the pure states HansmannPRL100 as long as the crystal-field splitting is small with respect to the spin orbit splitting. The latter requirement, which is fulfilled here ( 280 meV and 20 meV) assures that interference terms resulting from intermixing between the and multiplet can be neglected.
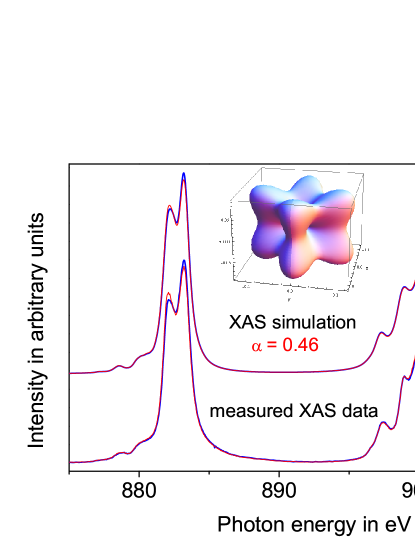
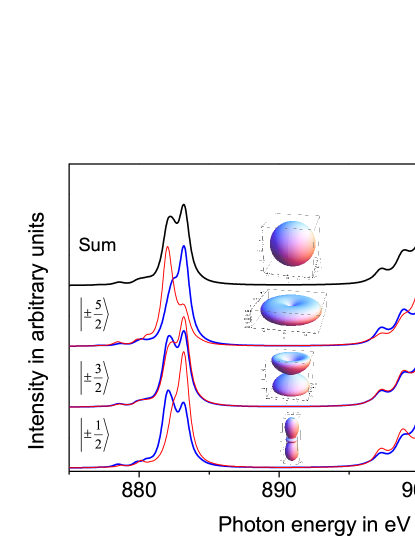
Figure 1 shows the low temperature linear polarized XAS data of CePt3Si at the M4,5 edge and their simulation based on the full multiplet treatment as described above. The polarization effect is not very large but real as will be shown in the next paragraph from the temperature dependence of the XAS data and the reproducibility of the 50 K spectra after the second cleave. The pure state cannot describe our low temperature data as can be seen from Fig. 2, where we have shown again (see Ref. HansmannPRL100, ) for reasons of convenience, the polarization dependent spectra for each state. The 5 K data are well described with the mixed ground state
() without the necessity to include the fractional occupation of a higher lying state. The small size of the polarization effect can be understood when considering, as was shown in the paper by Hansmann et al.,HansmannPRL100 that the variation of from 0 to 1 leads to a vanishing polarization effect when is equal to = 0.41, i.e. when is equal to the value of a cubic crystal-field symmetry. According to our data the mixing factor in CePt3Si is close to this value.
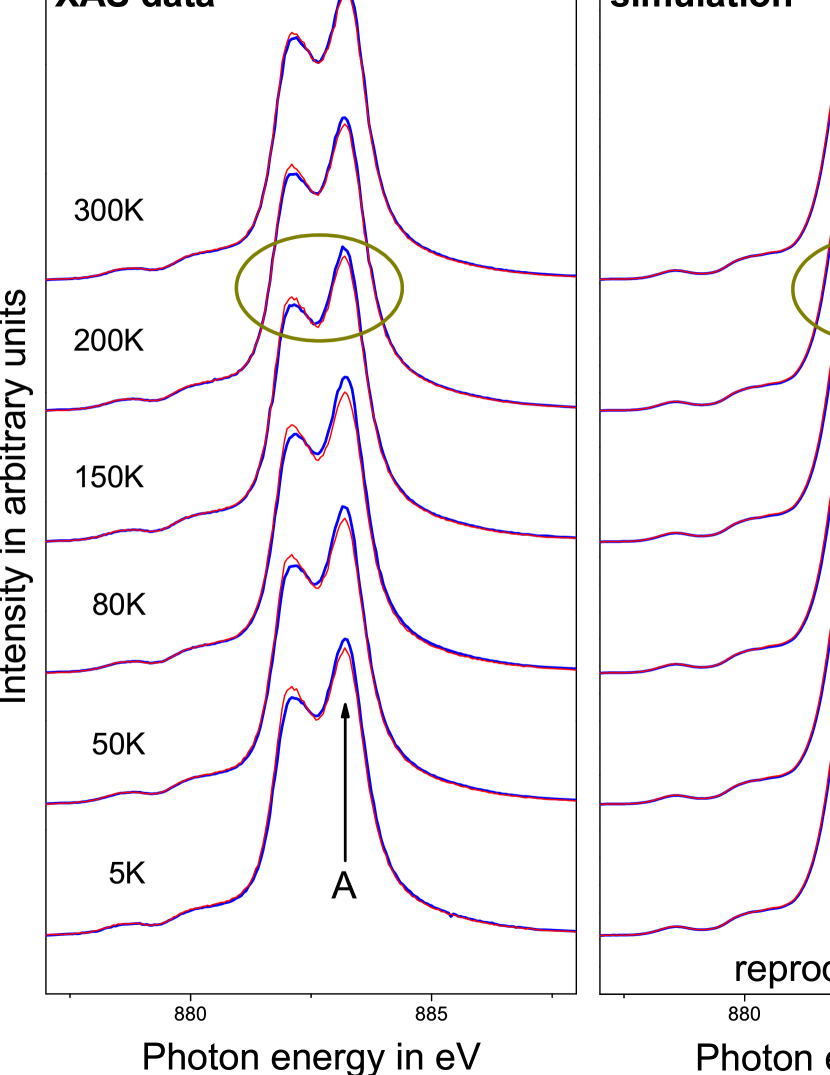
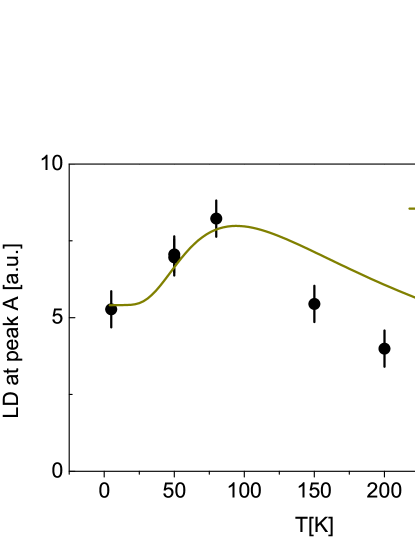
In order to rule out that the small size of the effect is due to unwanted surface effects the sample was measured at several temperatures, cleaved a second time and remeasured. The left panel side of Fig. 3 shows the M5 edge of CePt3Si for several temperatures between 5 K and 300 K. After the first cleave data were taken at 5 K, 50 K, 150 K and 200 K. After the second cleave the sample was measured first at 300 K and then cooled down to 50 K and warmed up to 80 K. Comparing the data at different temperatures shows that the polarization increases from 5 K to 50 K and 80 K and then decreases again as temperature rises further. We conclude that this effect is real since the polarization at 300 K (measured first after second cleave) is smaller than the polarization at 50 K (measured second after second cleave) and 80 K (measured third after second cleave). Surely, if surface degradation with time had been present, then one would rather expect to see a decrease of polarization. In addition the 50 K data were well reproduced. The black dots in Fig. 4 are the difference of the two intensities and (called linear dichroism LD) at the high energy peak of the M5 edge (see Fig. 3) and they summarize the temperature evolution of the polarization effect.
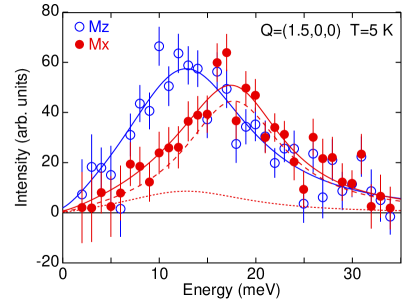
Polarized inelastic neutron scattering was used to determine the energy of the crystal-field levels. Figure 5 shows energy scans for Q=(1.5,0,0) for difference cross-sections sensitive to and , respectively. Within the crystal-field scheme of Eq. (1), the cross-section (open blue symbols in Fig. 5) contributes only to the transition between the ground state and the first excited state . The data were fitted by a damped harmonic oscillator (DHO)DHO convoluted with the instrumental resolution function. The first excited state has an energy (with respect to the ground-state energy) of =15.0(4) meV and a width (FWHM) of 8.2(9) meV, which reflects the damping of the crystal-field excitation due to the hybridization with the conduction electrons. The cross-section contains both transitions, and , and the corresponding data (full red symbols in Fig. 5) were modeled with two DHOs. The energy and width of the first transition (DHO) in the data were kept fixed to the above values while the integrated intensity was fixed to the fitted value of the cross-section after scaling with the corresponding transition probabilities, calculated from the mixing parameter of the XAS measurement. The second DHO described the second transition, for which the best fit gave an energy of =18.7(5) meV and FWHM = 6.2(8) meV. The fitted integrated intensity of the second DHO is about 16% smaller than expected from the calculated transition probabilities. We consider this to be an excellent agreement between neutron intensities and our findings from XAS.
The temperature dependence of the XAS data can now be modeled quantitatively using the ground state wave function as determined from XAS at = 5 K and the energy levels as determined with polarized neutrons. The results of these calculations are shown in the two middle panels of Fig. 3. The simulations differ in the order of the first and second excited state. Only the simulation with the as highest state reproduces the temperature dependence of the data well. The other option with the as first excited state leads to an inversion of polarization as temperature rises: for example, the intensity of peak for (blue) is simulated to become smaller than for (red) at 150 K, in contradiction with the experiment, see dark yellow circles in the left and middle right panel of Fig. 3. This can be understood when looking at the pure states as displayed in Fig. 2 and keeping in mind that the XAS spectra at finite temperatures resemble the superimposed polarizations of each state. The top of Fig. 2 shows that the full thermal population of all crystal-field states leads to a vanishing polarization since the sum of all spatial distributions is spherical. From this can be concluded that a small ground state polarization requires the first and second excited state to almost compensate each other, i.e. the other mixed state must have a polarization almost opposite to the one of the (see Fig. 2). Hence mixing in the other mixed state as temperature rises leads at first to an increase of polarization until the influence of the highest state, here the , compensates this due to thermal population. The dark yellow line in Fig. 4 displays the simulated temperature dependence of the polarization. The simulation reproduces the experimental temperature dependence quite well, including the presence of a maximum at 80 K.
For completeness we have simulated the XAS spectra using the crystal-field model suggested by Metoki et al.MetokiJCM16 Their ground state wave function produces spectra which do not resemble the experimental ones (see right panel of Fig. 3). Moreover, their model would lead to a strong temperature dependence between 5 K and 50 K which is not present in the experimental data.
IV Conclusion
We have performed temperature dependent linear polarized XAS measurements at the M4,5 edge of cerium in CePt3Si and inelastic polarized neutron experiments. The combination of both techniques gives a conclusive picture of the crystal-field level scheme in CePt3Si. The low temperature XAS data yield as the ground state wave function and the sequence of excited states can clearly be determined from the temperature dependence of the XAS data. Using the crystal-field transition energies as determined from the polarized neutron scattering data (15.0 and 18.7 meV) we were also able to quantitatively explain the temperature dependence. The wave-vector and polarization dependence of the neutron scattering intensities also confirm this sequence of the crystal-field levels. We note that the result with having the level as the highest lying excited state is in excellent agreement with the findings by Bauer et al. and excludes the suggestions by Metoki at al.
Acknowledgements
The experiments at BESSY were supported by the BMBF through project 05 ES3XBA/5. We thank L. Hamdan and the Cologne Mechanical Workshop for skillful technical support. The wave function density plots were calculated using the CrystalFieldTheory package for Mathematica written by M. W. Haverkort and the neutron transition matrix elements by a program written by J.X. Boucherle and F. Givord.
References
- (1) E. Bauer, G. Hilscher, H. Michor, Ch. Paul, E.W. Scheidt, A. Gribanov, Yu. Seropegin, H. Noël, M. Sigrist, P. Rogl, Phys. Rev. Lett. 92, 027003 (2004).
- (2) I. Sugitani, Y. Okuda, H. Shishido, T. Yamada, A. Thamizhavel, E. Yamamoto, T.D. Matsuda, Y. Haga, T. Takeuchi, R. Settai, Y. Onuki, J. Phys. Soc. Jpn. 75, 043703 (2006).
- (3) N. Kimura, K. Ito, K. Saitoh, Y. Umeda, H. Aoki, T. Terashima, Phys. Rev. Lett. 95, 247004 (2005).
- (4) E. Bauer, H. Kaldarar, A. Prokofiev, E. Royanian, A. Amato, J. Sereni, W. Brämer-Escamilla, I. Bonalde, J. Phys. Soc. Jap. 76, 051009, (2007).
- (5) S. Fujimoto, J. Phys. Soc. Jpn. 76, 051008, (2007).
- (6) N.D. Mathur, F.M. Grosche, S.R. Julian, I.R. Walker, D.M. Freye, R.K.W. Haselwimmer, G.G. Lonzarich, Nature 394, 39 (1998).
- (7) K.V. Samokhin, E.S. Zijlstra, S.K. Bose, Phys. Rev. B 69, 094514 (2004).
- (8) L.P. Gor’kov, E.I. Rashba, Phys. Rev. Lett. 87, 037004 (2001).
- (9) S.S. Saxena, P. Monthoux, Nature 427, 799 (2004).
- (10) G. Zwicknagl, Adv. Phys. 41, 203 (1992).
- (11) H. Ikeda, K. Miyake, J. Phys. Soc. Jpn. 65, 1769 (1996).
- (12) Y. Kagan, K.A. Kikoin, A.S. Mishchenko, Phys. Rev. B 55, 12348 (1997).
- (13) F. Ishi, T. Oguchi, J. Phys. Soc. Jpn. 73, 145 (2004).
- (14) F.P. Mena, D. van der Marel, J.L. Sarrao, Phys. Rev. B 72, 045119 (2005).
- (15) K. S. Burch, S. V. Dordevic, F. P. Mena, A. B. Kuzmenko, D. van der Marel, J. L. Sarrao, J. R. Jeffries, E.D. Bauer, M.B. Maple, D.N. Basov, Phys. Rev. B 75, 054523 (2007).
- (16) P. Ghaemi, T. Senthil, Phys. Rev. B 75, 144412 (2007).
- (17) H. Weber, M. Vojta, Phys. Rev. B 77, 125118 (2008).
- (18) J.-G. Park, D.T. Adroja, K.A. McEwen, Y.J. Bi, J. Kulda, Phys. Rev. B 58, 3167 (1998).
- (19) P. Hansmann, A. Severing, Z. Hu, M.W. Haverkort, C.F. Chang, S. Klein, A. Tanaka, H.H. Hsieh, H.-J. Lin, C.T. Chen, B. Fåk, P. Lejay, L.H. Tjeng, Phys. Rev. Lett. 100, 066405 (2008).
- (20) M. Yogi, Y. Kitaoka, S. Hashimoto, T. Yasuda, R. Settai, T.D. Matsuda, Y. Haga, Y. Onuki, P. Rogl, E. Bauer, Phys. Rev. Lett. 93, 027003 (2004).
- (21) A. Amato, E. Bauer, C. Baines, Phys. Rev. B 71, 092501 (2005).
- (22) B. Fåk, S. Raymond, D. Braithwaite, G. Lapertot, J.-M. Mignot, Phys. Rev. B 78, 184518 (2008).
- (23) A.I. Tursina, A.V. Gribanov, H. Noel, P. Rogl, Y.D. Seropegin, O.I. Bodak, J. Alloys Compd. 383, 239 (2004).
- (24) P.A. Frigeri, D.F. Agterberg, A. Koga, M. Sigrist, Phys. Rev. Lett. 92, 097001 (2004).
- (25) E. Bauer, G. Hilscher, H. Michor, M. Sieberer, E.W. Scheidt, A. Gribanov, Yu. Seropegin, P. Rogl, A. Amato, W.Y. Song, J.-G. Park, D.T. Adroja, M. Nicklas, G. Sparn, M. Yogi, Y. Kitaoka, Physica B 359-361, 360 (2005).
- (26) N. Metoki, K. Kaneko, T.D.Matsuda, A. Galatanu, T. Takeuchi, S. Hashimoto, T. Ueda, R. Settai, Y. Onuki, N. Bernhoeft,, J. Phys.: Condens. Matter 16, L207 (2004).
- (27) A. Tanaka, T. Jo, J. Phys. Soc. Jpn. 63, 2788 (1994).
- (28) B. Fåk, B. Dorner, Physica B 234-236, 1107 (1997).