Optical spectra obtained from amorphous films of rubrene: Evidence for predominance of twisted isomer
Abstract
In order to investigate the optical properties of rubrene we study the vibronic progression of the first absorption band (lowest transition). We analyze the dielectric function of rubrene in solution and thin films using the displaced harmonic oscillator model and derive all relevant parameters of the vibronic progression. The findings are supplemented by density functional calculations using B3LYP hybrid functionals. Our theoretical results for the molecule in two different conformations, i.e. with a twisted or planar tetracene backbone, are in very good agreement with the experimental data obtained for rubrene in solution and thin films. Moreover, a simulation based on the monomer spectrum and the calculated transition energies of the two conformations indicates that the thin film spectrum of rubrene is dominated by the twisted isomer.
I Introduction
Organic semiconductors have become very promising and actively investigated materials Brütting (2005); Witte and Wöll (2008); Gerlach et al. (2008). Due to their specific optical properties organic molecules are particularly interesting for various device applications such as light emitting diodes, field effect transistors and solar cells Park et al. (2007a, b); Hsu et al. (2007). Different studies have demonstrated that the optical properties of molecular solids are strongly influenced by their structure. Crystalline materials as for example pentacene Hinderhofer et al. (2007) and diindenoperylene Heinemeyer et al. (2008) thin films exhibit complex and generally anisotropic absorption spectra which are often influenced by characteristic charge transfer excitations. Amorphous materials with extended -conjugated electron systems, as for example rubrene (Fig. 1), show optical spectra which are seemingly simpler to understand Käfer and Witte (2005); Käfer et al. (2005); Kowarik et al. (2006).
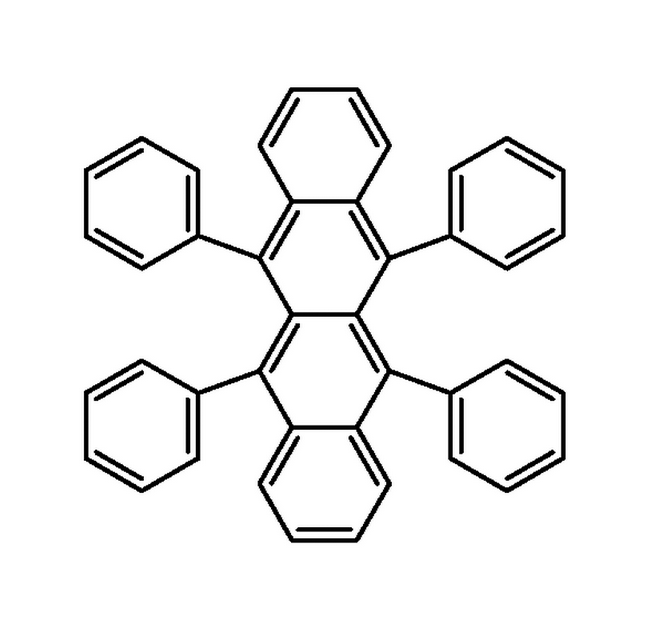
However, when considered in more detail the growth of amorphous materials may present its own complications. For example, studies of rubrene thin films on silicon uncovered a surprising growth behavior: Using X-ray reflectivity rubrene thin films are found to be relatively smooth and amorphous over a large thickness range Kowarik et al. (2006). Yet, an anomalous roughness evolution of the films is observed, i.e. a decrease of the film roughness at the beginning (below 20 nm) and a subsequent increase of the roughness at a later stage. Recent near edge X-ray absorption fine structure (NEXAFS) results indicate the existence of different rubrene isomers on SiO2 and Au(111) Käfer et al. (2005). At the early stage of growth both species were identified, i.e. the rubrene with the twisted and planar tetracene backbone, followed by the planar isomer only.
In the present study we focus on the optical properties of rubrene molecules in solution and amorphous thin films. In particular, we investigate whether the different isomers can be identified in the optical spectra. For this purpose we calculate the optical response of the different isomers of rubrene with time-dependent density functional theory (TD-DFT). The deformation in the relaxed excited geometry of each isomer found with TD-DFT is projected onto its internal vibrations. This allows an assignment of the observed sub-bands in the absorption spectra to an effective vibrational mode which is an average over the various internal vibrations elongated in the relaxed excited geometry. Furthermore, we use the calculations to assess the contribution of the different rubrene isomers to the observed spectra.
II Experiment
The material used in our experiments was purchased from Acros and purified by gradient sublimation. This procedure yields small rubrene crystallites which are relatively inert against oxidation in air Käfer and Witte (2005). To avoid well-known thermochromic effects – rubrene changes its color towards the red at elevated temperatures Schönberg et al. (1954) – we took all spectra at C.
The absorption spectra of rubrene in acetone solution were recorded using a UV-Vis spectrophotometer (Varian Cary 50). With an overall reproducibility of the optical constants being on a 1% level we verified that for the chosen concentrations ( mol/l) the absorbance data follow the Lambert-Beer law. The optical properties of rubrene thin films were measured in ultra-high vacuum using a spectroscopic rotating compensator ellipsometer (Wollam M-2000) with a broad band 75 W Xe lamp ( nm) and CCD based detection system with a spectral resolution of about 1.6 nm. The organic material was out-gassed in vacuum for several days at C in order to remove residual rubrene peroxide Wasserman et al. (1972). Well cleaned Si(100) substrates with a thermal oxide layer (thickness nm) were transferred into the growth chamber and kept at temperatures above C for several hours. Before deposition of the organic material we determined the thickness of the silicon oxide and the precise angle of incidence by ellipsometry. The rubrene films were deposited at room temperature via sublimation from a Knudsen cell at C. A typical deposition rate of 0.2 nm/min and a pressure of less than mbar during growth ensured reproducible results.
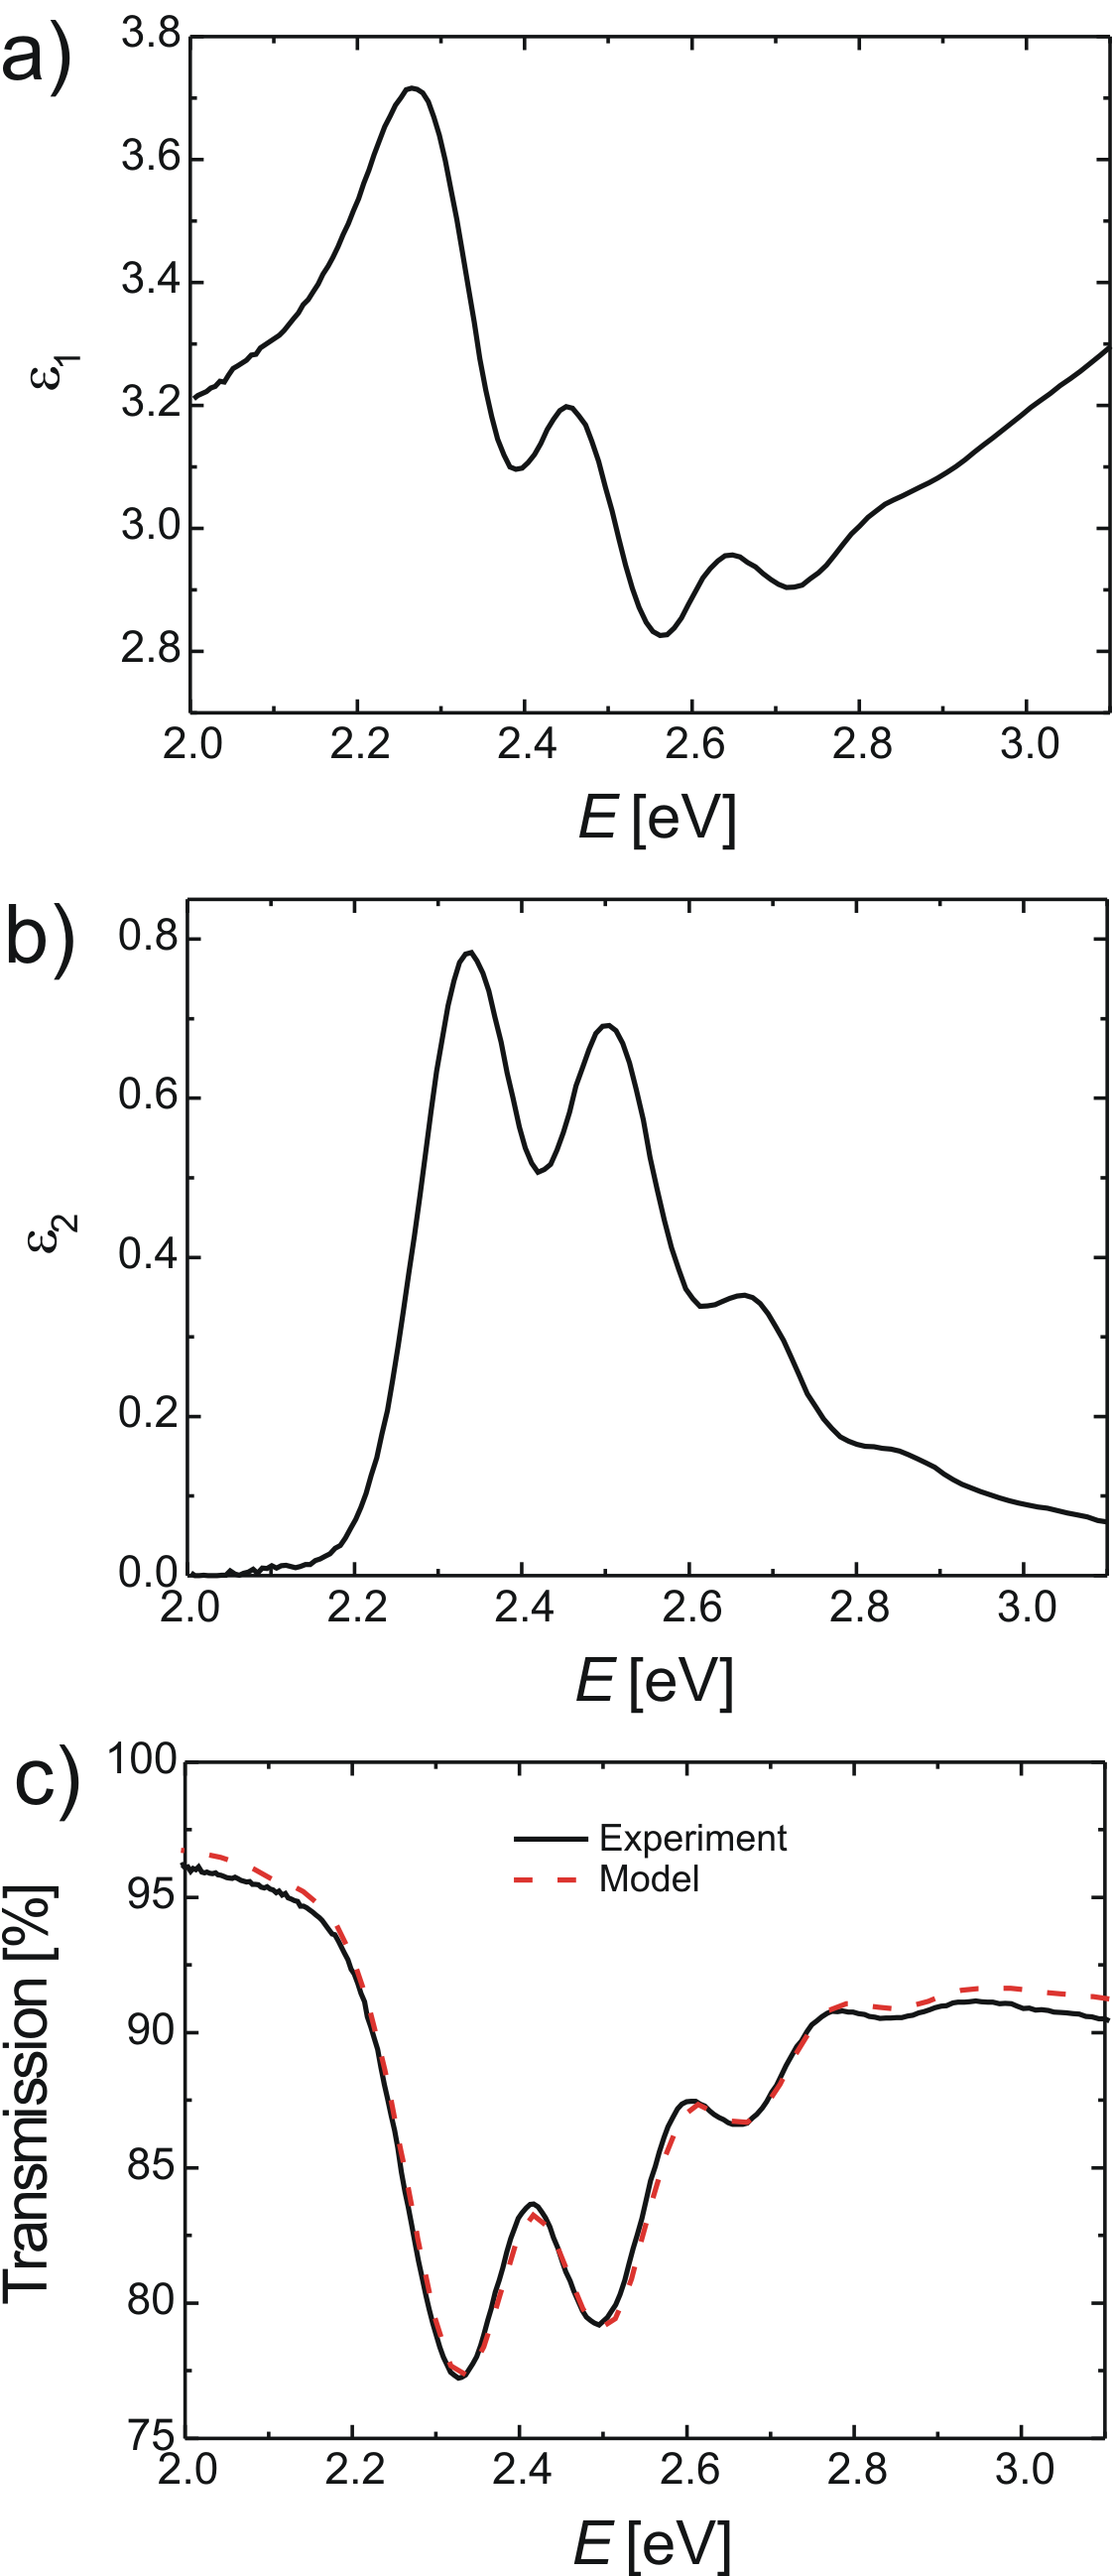
The experimental data were analyzed with the commercial WVASE software package Woollam (2005). Since rubrene grows in amorphous films, we used an isotropic model consisting of three layers, i.e. rubrene – silicon dioxide – silicon, with the optical constants of silicon and silicon dioxide taken from Ref. Herzinger et al. (1998). First, we determined the thickness of the rubrene film by employing a Cauchy model in the spectral range below 2 eV, where the absorption of the organic material is negligible. Then, we performed a point-by-point fit which yields the complex dielectric constant for each energy, see Fig. 2(a,b). To check the Kramers-Kronig consistency of the optical constants we also analyzed the experimental data with a general oscillator model. In this approach the imaginary part of the dielectric function is described by a sum of Gaussian peaks and the real part is derived by the Kramers-Kronig relation. Generally, we found excellent agreement of the results obtained either by point-by-point fits or the general oscillator model. To check the consistency of the results obtained by UV-Vis spectroscopy and spectroscopic ellipsometry we also measured transmission spectra of rubrene on glass, see Fig. 2c. We found that these data can be described very well using the optical constants of rubrene on silicon obtained by ellipsometry (and those of glass measured separately with variable angle ellipsometry). The minor differences between the data and the model might be due to oxidation of some rubrene molecules in air Mitrofanov et al. (2006); Kytka et al. (2007).
III Results
III.1 Analysis of the optical spectra
The imaginary part of the dielectric function (Fig. 2b) shows a pronounced vibronic progression with five clearly distinguishable sub-bands. The displaced harmonic oscillator model – a simplified scheme describing the dipole-allowed transitions between the electronic ground state () and the first excited state () including spatial deformations of the molecule (Fig. 3) – has been used to model the data.
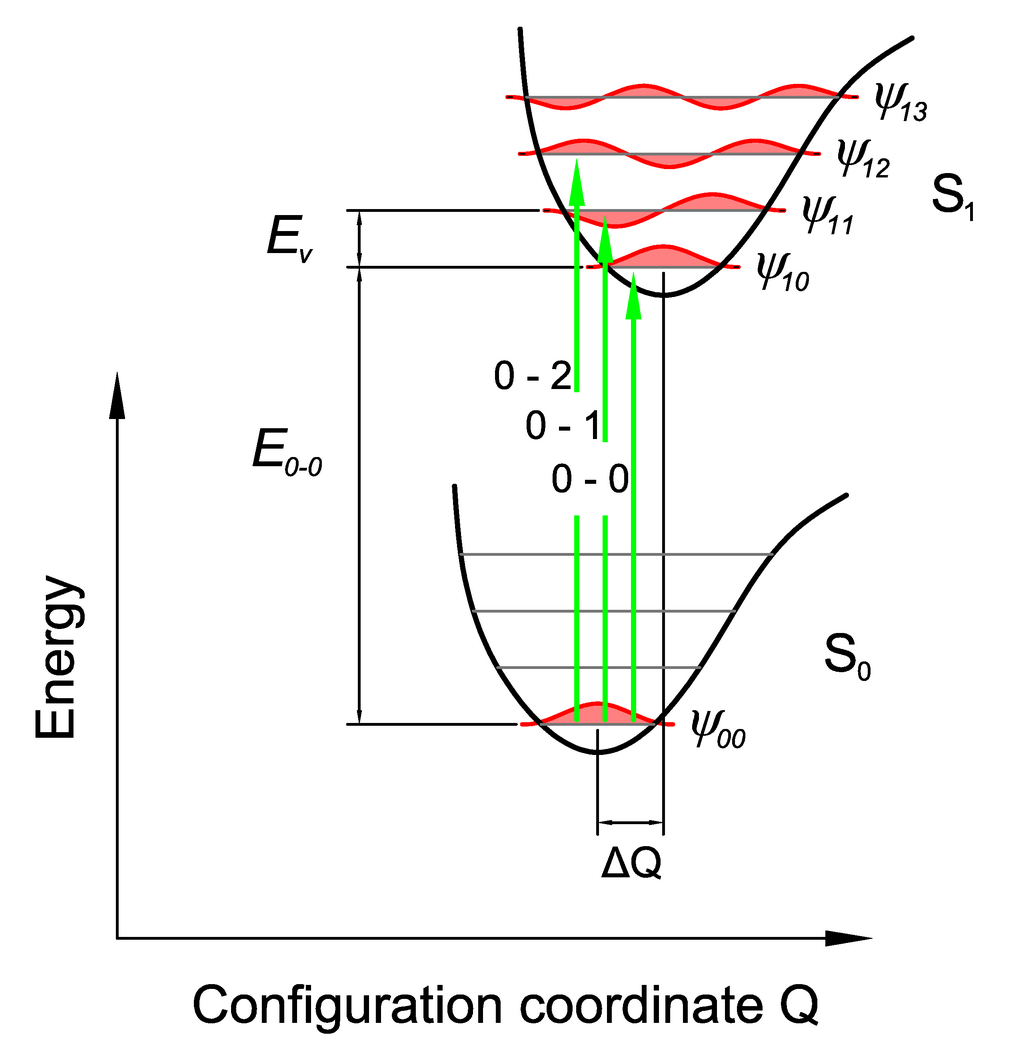
In this approximation the excitation energies are given by
| (1) |
where is the energy of the transition, the vibrational energy and the vibrational quantum number of the excited state. The intensities of the vibronic sub-bands contribute to the imaginary part of the dielectric function according to a Poisson progression
| (2) |
where is the electron-phonon coupling constant, also known as the Huang-Rhys factor. This coupling parameter essentially determines the shape of the absorption spectrum, i.e. the relative intensities of the vibronic sub-bands, which are given by the area under each peak.
In order to compare the data taken in solution with the thin film spectra the absorption coefficient of the solution has been converted to the dielectric function using the common approximation that the refractive index is virtually constant towards high energies and is then proportional to . Fig. 4a shows the normalized data for rubrene in acetone solution and thin films together with the corresponding least-square fits.
With the sub-band energies given by Eq. (1), their relative intensities according to the Poisson progression in Eq. (2), and a Gaussian for each sub-band, the imaginary part of the dielectric response can be expressed as
| (3) |
where the broadening parameters are related to the respective widths of each sub-band by . Since several internal modes might contribute to each sub-band, the linewidth are not necessarily constant. In the fitting algorithm all parameters except the width of the last two peaks (fixed at eV and eV) have been varied. The Huang-Rhys factor is then deduced from the intensities of the first four transition peaks using Eq. (2), see Fig. 4b 111In principle, the Huang-Rhys parameter can be derived already from the intensities of only two adjacent peaks. Our approach, however, is more robust and therefore gives reliable results..
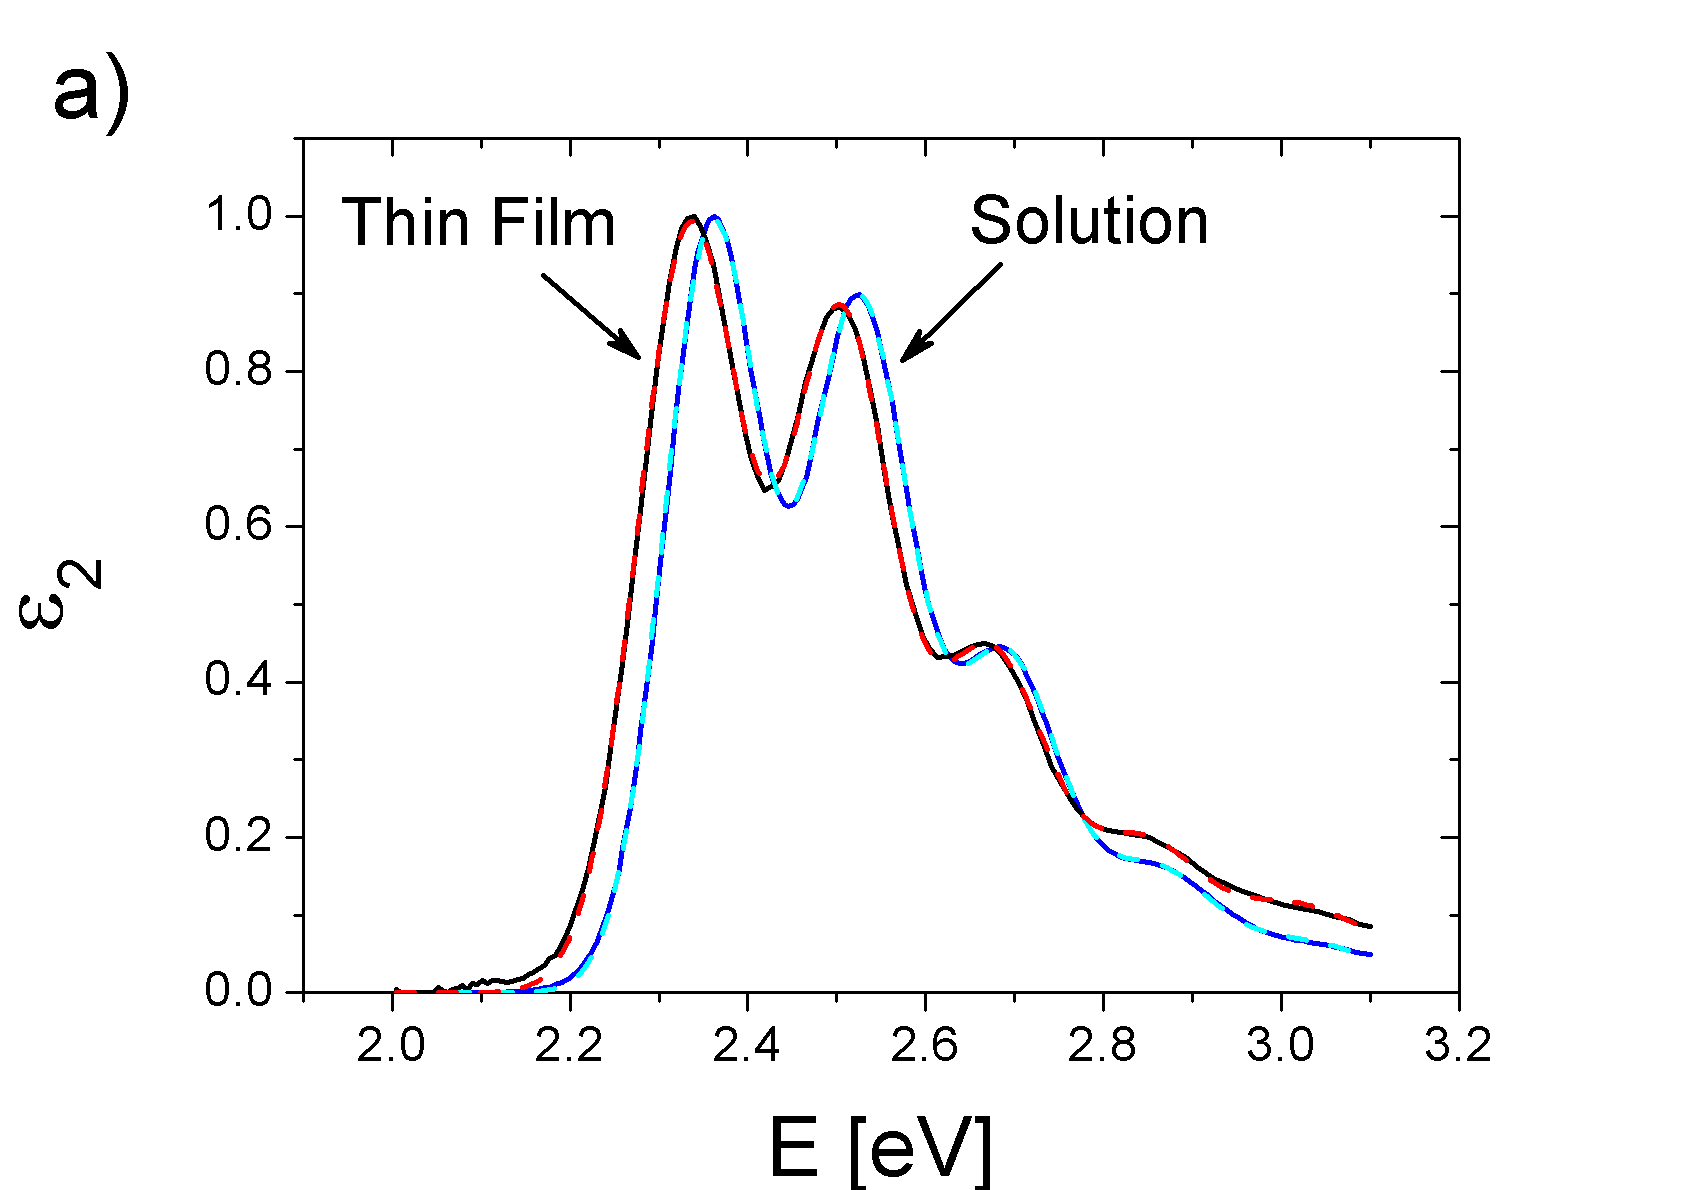
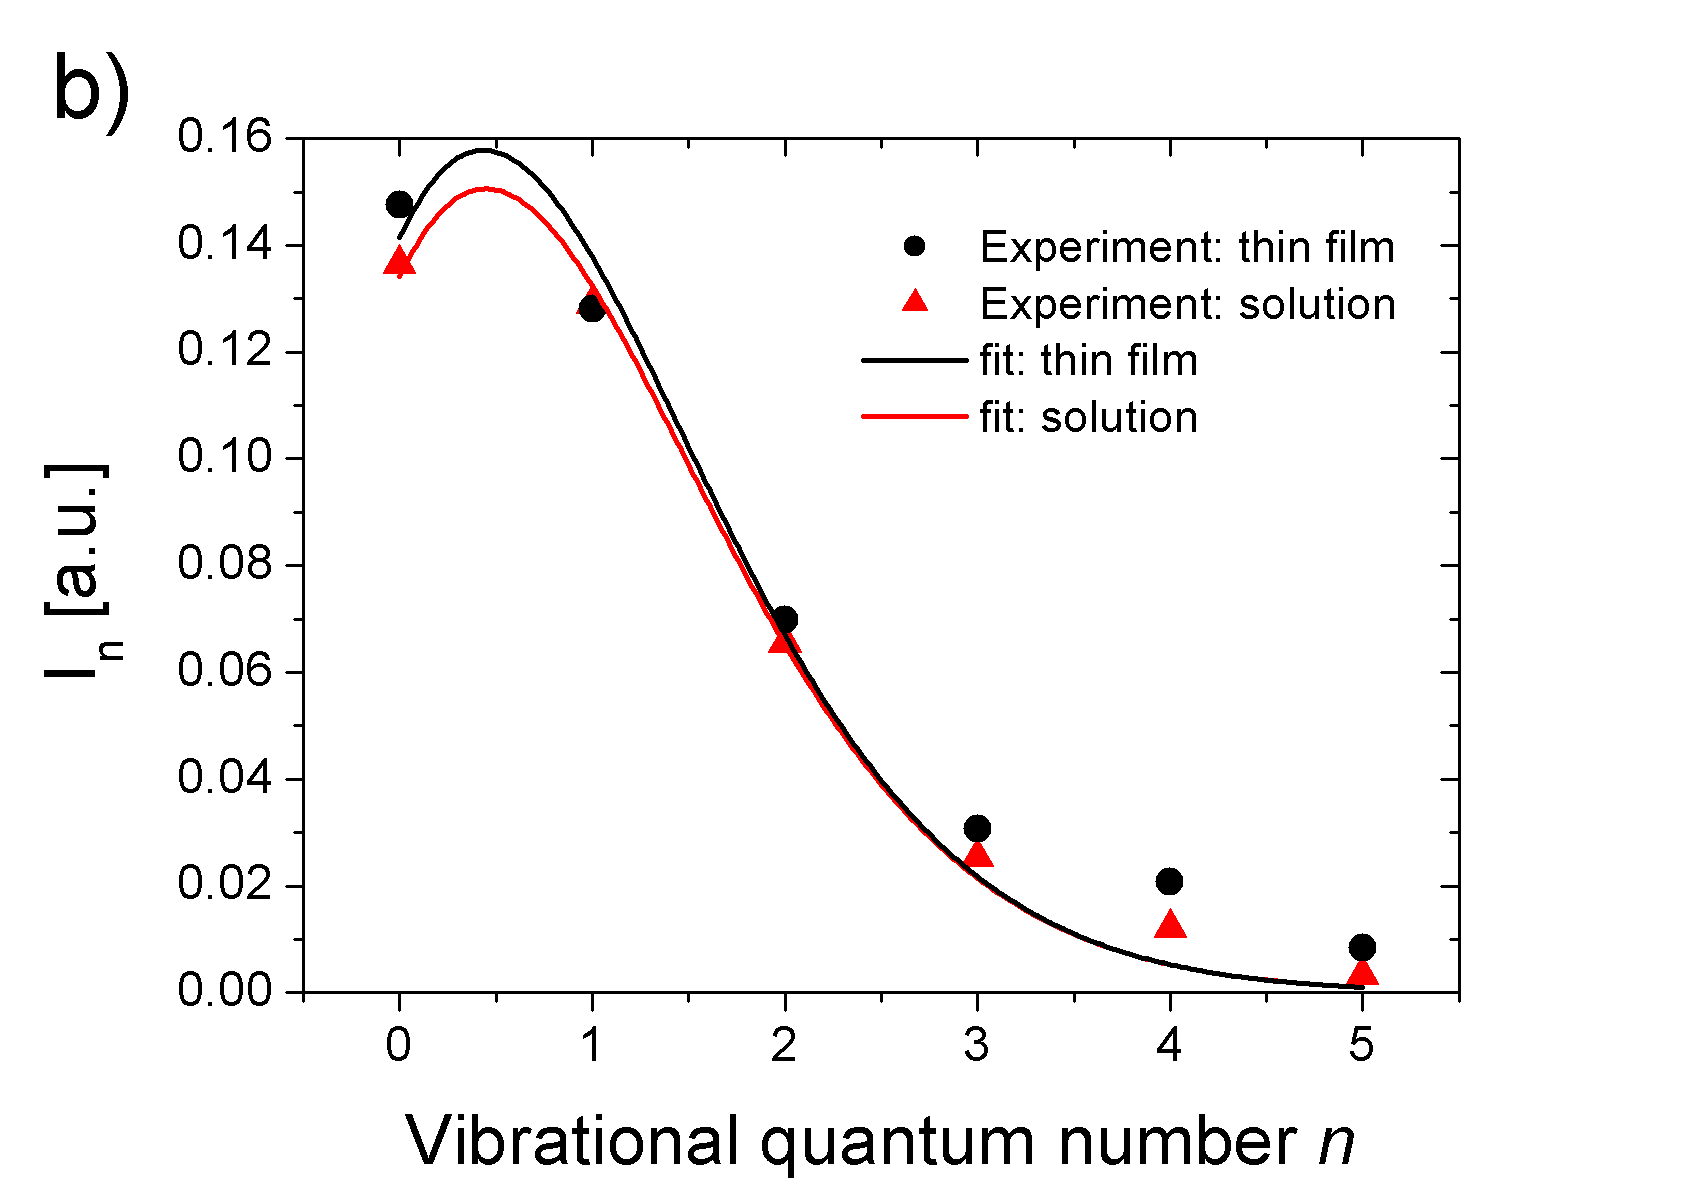
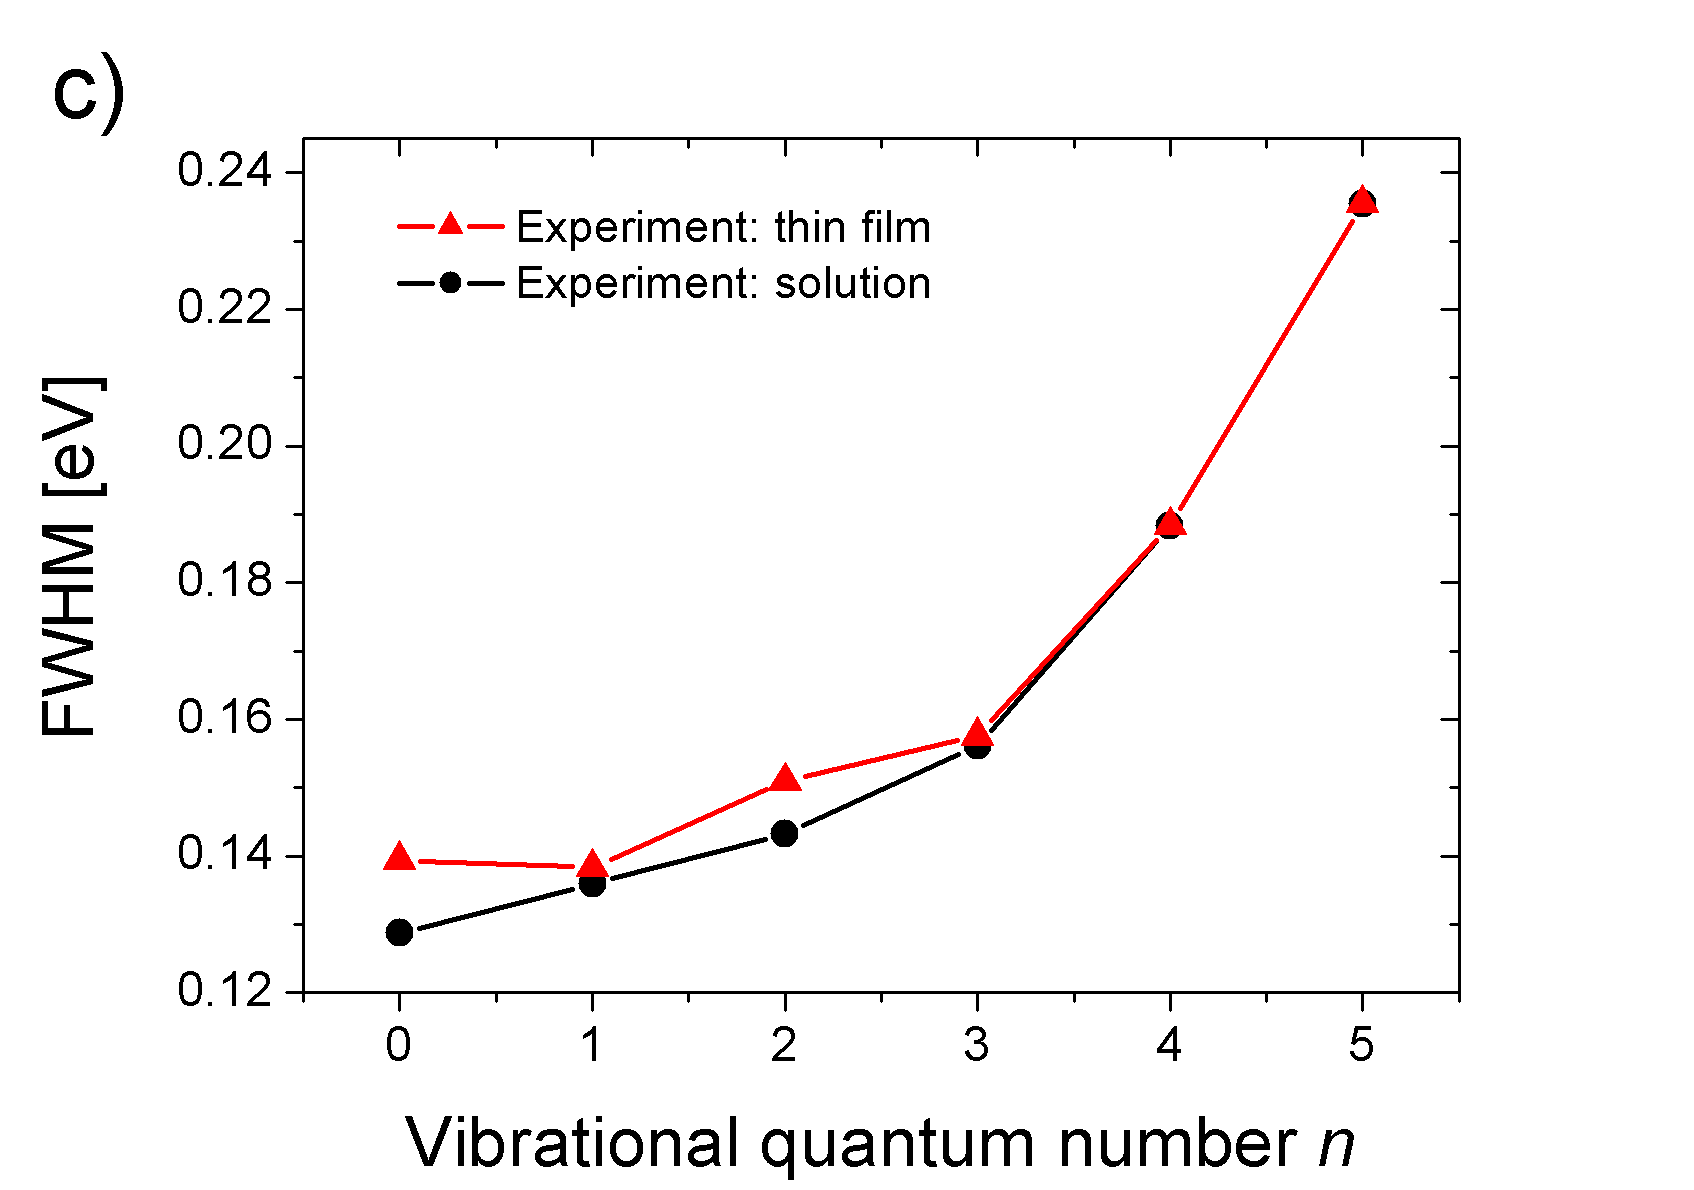
The results of the fitting procedure for the vibronic progression are summarized in Tab. 1.
| Solution | |||
|---|---|---|---|
| Thin Film |
III.2 DFT calculations
In order to study the effect of possible conformational changes of the molecule and to compare the experimental results with theory we have computed the excitation energies and the deformation in the lowest excited state of rubrene using the turbomole 5.7 program package Ahlrichs et al. (1989). We have chosen the B3LYP hybrid functional since it gives excellent molecular geometries of organic molecules together with rather precise transition energies resulting from a compensation between the systematic deviations arising from the underlying gradient-corrected density functional and the Hartree-Fock contribution Bauschlicher (1995). For the electronic orbitals, we use a triple- valence polarized (TZVP) basis Schäfer et al. (1994) throughout this article.
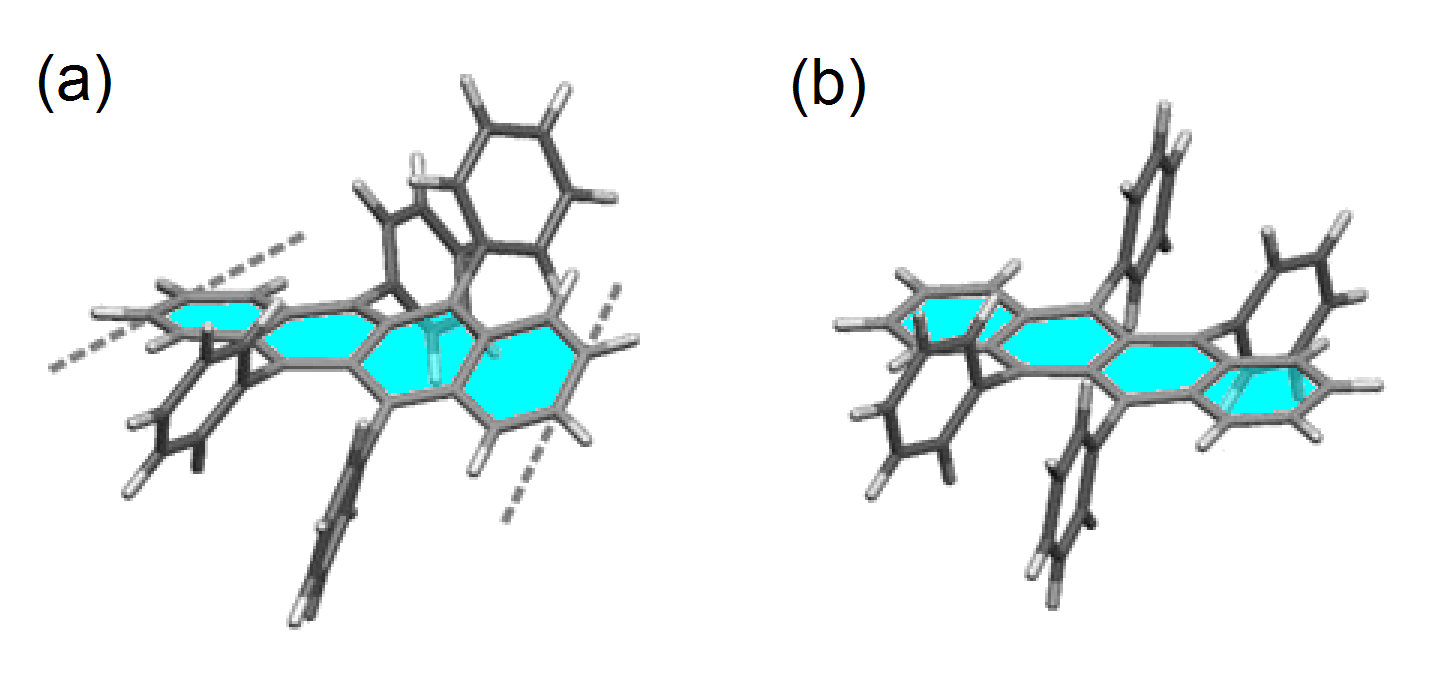
In order to cover the twisted and the planar isomers of rubrene, we have optimized both of them in their respective point groups, i.e. for the twisted isomer, and for the planar one, see Fig. 5. Our simulation reproduces the known fact that the twisted isomer is more stable Käfer et al. (2005), with an energetic difference of eV at the B3LYP/TZVP level.
In solution the charge distribution of the solute molecule polarizes the medium surrounding it, resulting in a further stabilization energy. This phenomenon can be handled with the conductor-like screening model (COSMO), where the solute is treated as lying inside a cavity surrounded by the polarizable medium Klamt and Schüürmann (1993). In this approach, the response of the dielectric medium is replaced by an ideal conductor, generating screening charges on the surface of the cavity. In a second step these screening charges are scaled by a factor depending on the dielectric constant of the solvent, . We have applied the respective routine as implemented in the turbomole 5.7 program package to a geometry optimization of each isomer in a medium with a dielectric constant of epsilon=20.7 corresponding to acetone. At the B3LYP/TZVP level we found stabilization energies of eV for the planar isomer, and eV for the twisted isomer. This is reducing the energetic difference between the two isomers by a small amount, but the twisted isomer still remains more stable by eV.
Even though the twisted isomer is more stable both as a free molecule and in solution, in the crystalline phase the planar isomer can be stabilized by a beneficial geometric arrangement between neighboring molecules, resulting in a large cohesive energy so that the energetic cost of the planarization is overcompensated by attractive inter-molecular interactions. In the amorphous phase of solid rubrene it is expected that the twisted geometry is conserved because the random positions and orientations of the neighboring molecules cannot stabilize an unfavorable isomer.
The different energies of both isomers raise the question if the planar isomer is stable, or if it can spontaneously transform into the more favorable twisted geometry. Using B3LYP and basis sets in the size range between 6-31G(d) and TZVP we found that the lowest symmetry-breaking mode in the point group received a small imaginary frequency. For the larger TZVP basis this apparent instability was found to depend on the integration grid: A calculation using the standard grid resulted in an imaginary frequency of cm-1, but based on a denser grid, this value decreased towards cm-1. Using a tighter convergence of Hartree, the energetic minimum along this imaginary mode occurs at 12 cm meV below the -symmetric isomer. However, independently of basis size and integration grid, for larger deformations along this vibrational eigenvector, the shape of the potential returns to an essentially parabolic minimum, with a tiny distortion for small deformations. Hence, this ultra-soft or even imaginary mode does not constitute a viable barrierless pathway from the planar isomer to the twisted configuration. For the twisted isomer we found positive frequencies for all vibrational modes, the lowest being a breathing mode at 26 cm-1.
In the twisted isomer the repulsion between the phenyl side groups achieves a rather larger distance between them as opposed to the planar isomer, where a relatively small distance between the phenyl groups is enforced by the rigidity of the bond connecting each side group to the tetracene core and by the more restrictive point group . Therefore, the twisted isomer gains a substantial amount of energy through a reduction of these repulsive interactions, allowing eventually to invest a part of this energy into the unfavorable twist of the tetracene backbone. The resulting angle between the two central rings of the tetracene core is in the electronic ground state, and the angle between the two final rings , compare Fig. 5b. In the relaxed excited state these angles increase to and , respectively.
For both isomers the relaxed excited geometries are computed with time-dependent density functional theory (TD-DFT) at the B3LYP/TZVP level, conserving in each case the point group of the electronic ground state. The resulting deformation pattern is projected onto the symmetry-conserving breathing modes of the respective isomer in its ground state, defining in turn a Huang-Rhys factor for each vibration . In contrast to the lowest symmetry-breaking vibration of the planar isomer the frequencies of the symmetry-conserving modes depend only weakly on variational basis set and integration grid, with the largest influence for the lowest breathing mode found at 19 cm-1 (B3LYP/TZVP, ) or 22 cm-1 (B3LYP/TZVP, ). Correspondingly, we have determined similar values for the Huang-Rhys factors obtained at these levels. Applying the projection scheme to the deformation pattern of a cationic molecule, we have reproduced the key features of previous calculations addressing the Huang-Rhys factors in the planar isomer da Silva Filho et al. (2005). Of course, when compared to the cationic geometry, a neutral excitation of a planar rubrene molecule produces a somewhat different set of Huang-Rhys factors.
By averaging over vibrations in the range between 900 and 1800 cm-1 we define an effective mode with a Huang-Rhys factor , a reorganization energy , and a mode energy of . The harmonic approximation to the potential energy surface results in slightly too large vibrational frequencies. In order to compensate for this deviation we apply a scaling factor of 0.973 adequate for the B3LYP functional to the vibrational frequencies Scott and Radom (1996); Halls et al. (2001), conserving however the reorganization energies assigned to each mode, so that the Huang-Rhys factors are increased by a factor of . The results of this computational procedure are reported in Tab. 2. We use two kinds of relaxed excited geometries: First, the result of the TD-DFT geometry optimization, and second, a modified excited geometry where changes of the twisting angle of each phenyl group around the bond connecting it to the tetracene core are eliminated. From similar investigations on other molecules containing phenyl groups we expect that this procedure minimizes artifacts arising from finite angle effects related to the relatively large changes of these angles in the relaxed excited geometry Scholz et al. (2009).
When basing our projection directly onto the TD-DFT geometry for the excited state, the sum over the reorganization energies assigned to each mode exceeds the available reorganization energies and deduced from the potential energy surfaces of ground and excited state, respectively. Using instead the modified excited state geometry where the orientation of the phenyl groups is adjusted to the ground state geometry, this artifact disappears, indicating that the non-orthogonality problems arising from the modified orientation of the phenyl rings are eliminated. Moreover, in the second projection scheme the frequency assigned to the effective mode is in better agreement with the observations.
| twisted | planar | |
|---|---|---|
| (TD-DFT) | ||
| (TD-DFT) | ||
| (no twisting) | ||
| (no twisting) |
IV Discussion
The spectra of rubrene in solution and rubrene thin films show a pronounced vibronic progression that we have analyzed using the displaced harmonic oscillator model. For evaluation of the results the parameters compiled in Tab. 1 should be compared with each other and with previous investigations: We find that the transition energy eV of rubrene in acetone solution deviates less than meV from a value reported earlier Badger and Pearce (1951). Based on the systematic study of solvent shifts presented in that work one can estimate that the HOMO-LUMO transition of rubrene dissolved in acetone is red-shifted by about eV with respect to a free molecule. Consequently, the lowest vibronic sub-band in the free molecule would be found at eV. This illustrates that the transition energy eV measured for rubrene in thin films shows a significant redshift which is caused by the environment. Since the Huang-Rhys factors for rubrene monomers dissolved in acetone and amorphous thin films show only minor differences, i.e. and , we conclude that the exciton-phonon coupling is not markedly influenced by aggregation of the molecules – most likely because the investigated thin films are amorphous and the phenyl side groups keep those neighboring tetracene backbones apart that are mainly involved in the transition.
Furthermore, we observe a continuous increase of the peak width in the vibronic progression of rubrene which indicates that more than one vibrational mode is involved. For the solution spectrum we find a simple monotonic dependency, whereas the thin film spectrum shows a different behavior with the width of the first peak being larger than the second one. One could speculate that this observation is related to the reported existence of a conformational rubrene isomer with a slightly different electronic transition energy Käfer et al. (2005). In order to verify whether two different isomers contribute to the optical spectra one might compare the experimental data with the results of the DFT calculations for the twisted and planar molecule (Tab. 2): Despite the excellent agreement of the calculated Huang-Rhys factors with our experimental values 222The fact that the calculated Huang-Rhys factor for the twisted isomer nearly coincides with the observed value is accidental: For other applications of the same functional and basis set to the relaxed excited geometry of poly-aromatic molecules larger deviations are found. their small difference (, ) cannot provide the required sensitivity to to distinguish both isomers. Our calculations, however, show that the transition energies of the twisted and planar monomer differ significantly with eV. Unlike spectra of the pure isomers a mixture of the two molecules therefore would have to show some unusual spectral features.
Based on the solution spectrum of rubrene, which itself represents the twisted isomer, we also model the spectrum of the planar isomer by blue shifting the spectrum by eV. By adding both spectra with different weights and normalizing them we simulate a corresponding mixture of planar and twisted molecules, see Fig. 6.
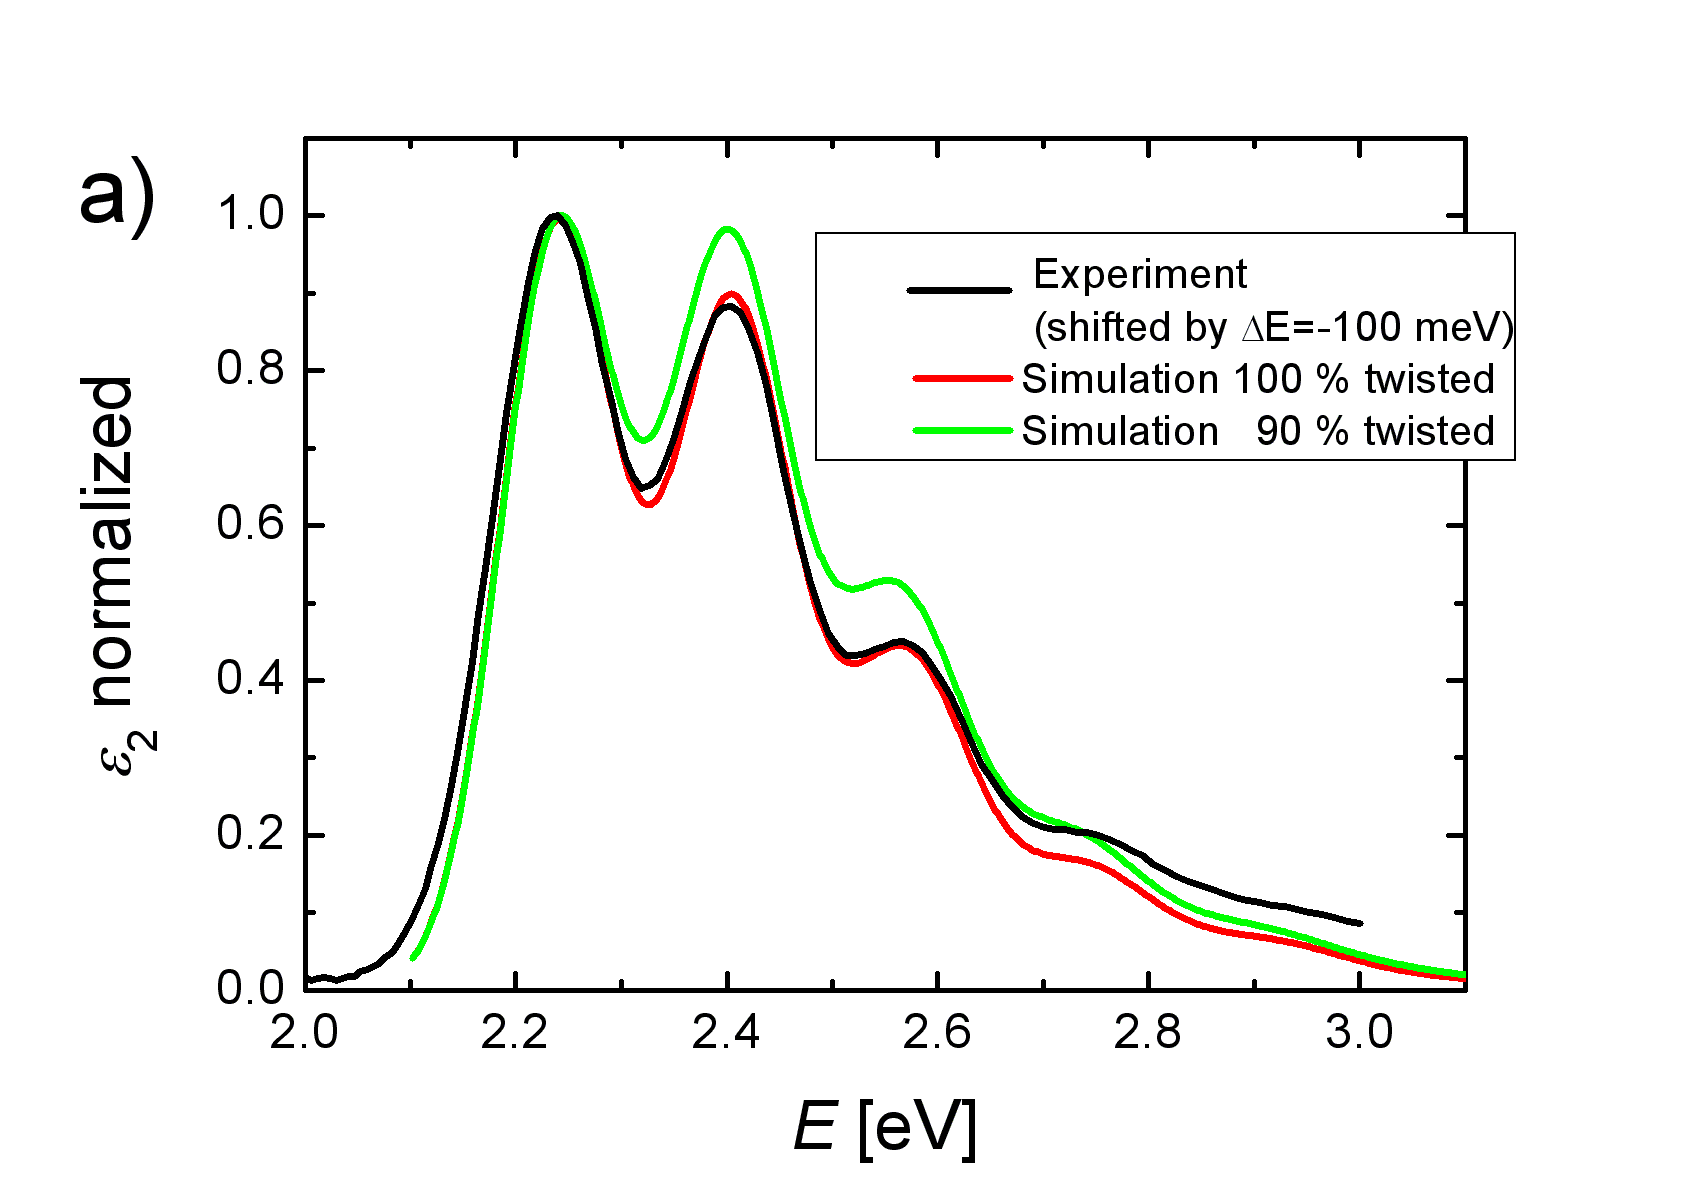
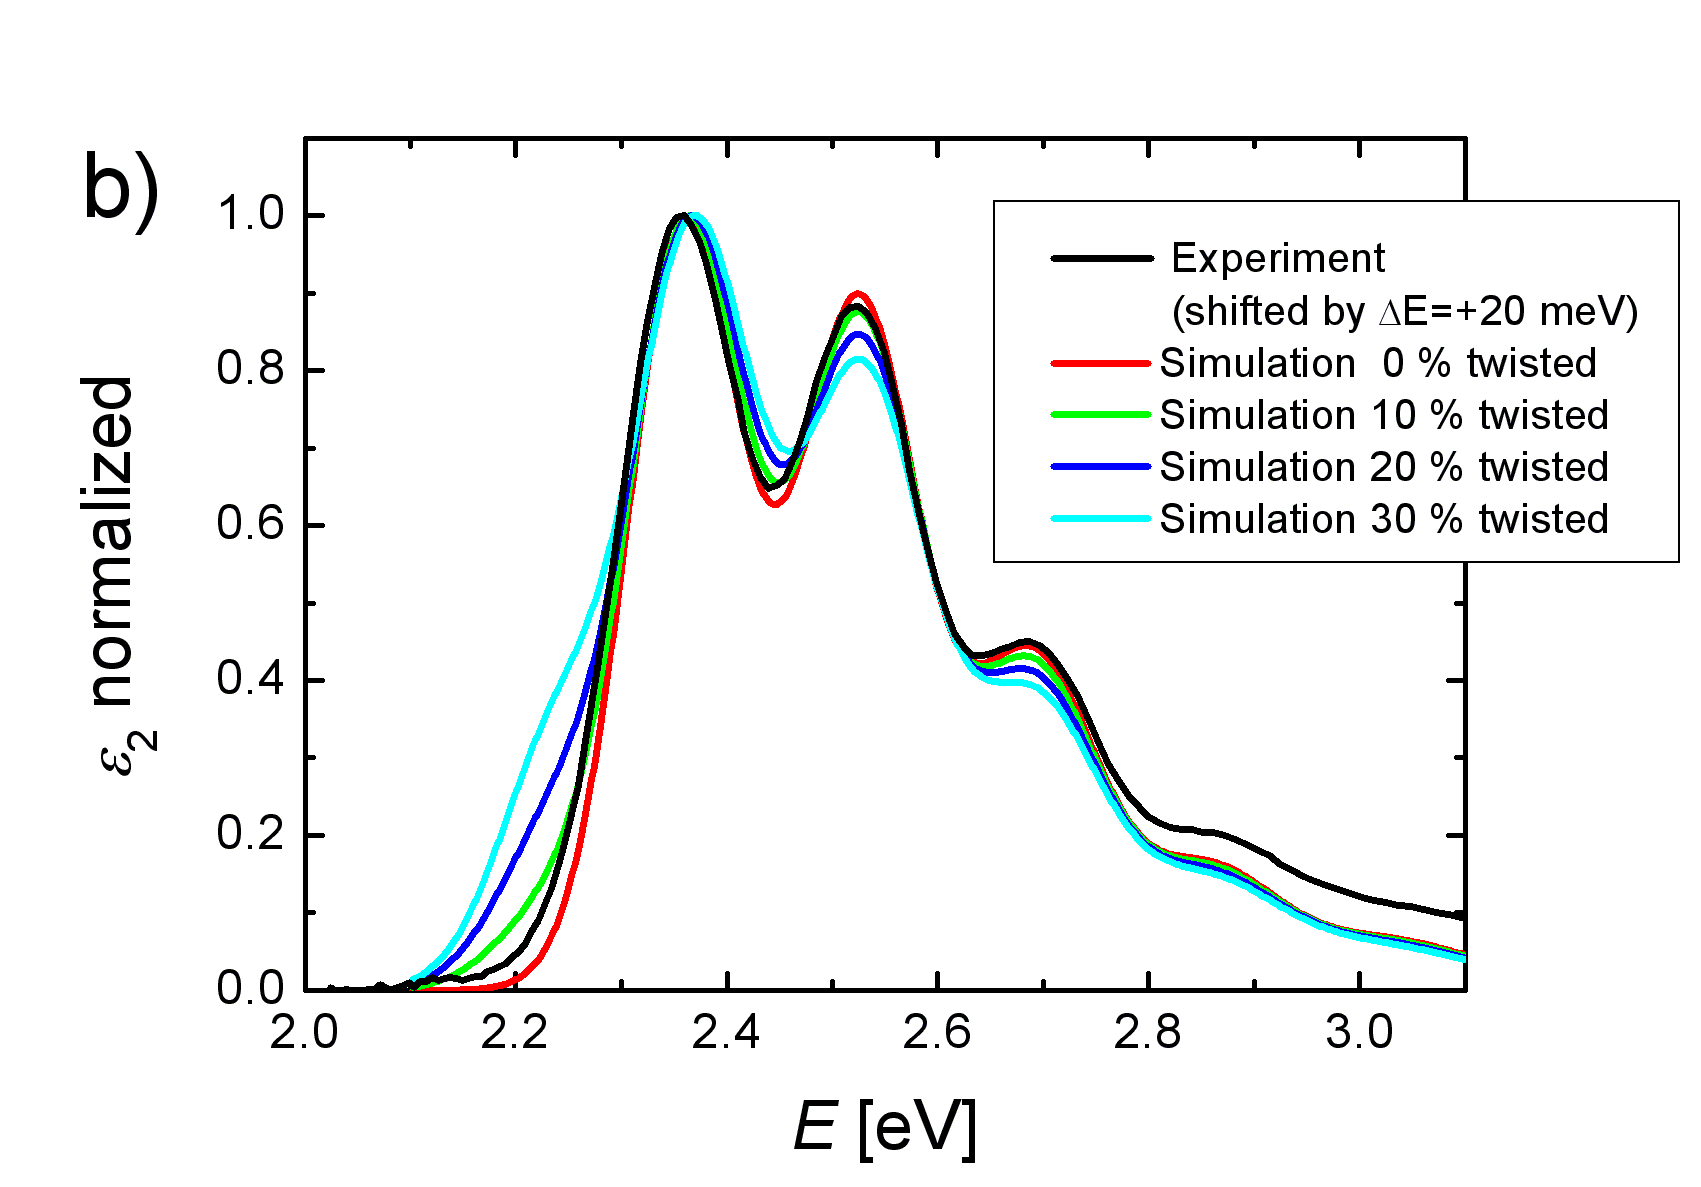
We find that the spectrum changes mainly in the low-energy range when the number of twisted molecules is increased from e.g. 10 to 30% (Fig. 6b), whereas in the other case increasing the number of planar molecules from 0 to 10% affects mainly the high-energy range (Fig. 6a). Overall the simulations indicate that a contribution of the second rubrene isomer is relative small, i.e. below 10%. Because the twisted isomer is energetically favorable we conclude that the thin film spectrum is dominated by the twisted molecule and a fraction of no more than 10% of planar molecules may contribute to the spectrum. The differences between the solution and the thin film spectrum in the high-energy range, however, cannot be explained by contributions of a small fraction of planar molecules alone. Additional coupling in the thin film, like exciton transfer, might be the origin of this deviation.
V Summary and Conclusions
The optical spectra of rubrene thin films and monomers in solution have been investigated experimentally by spectroscopic ellipsometry and UV-Vis spectroscopy. The analysis of the vibronic progression using the displaced harmonic oscillator model has revealed the subtle differences between the monomer and the thin film spectrum. Additionally, time-dependent DFT calculations have been performed for the planar and the twisted isomer in order to get more insight into possible conformational changes of the molecule as they are known from the literature. The theoretical results, notably the excitation energies and Huang-Rhys parameters for the planar and twisted molecule, are in excellent agreement with the experimental data. Since the two rubrene isomers show different transition energies, the optical spectra may reveal their existence. In fact a simulation, which studies the effect of mixing the two species, indicates that one isomer – most likely the more stable twisted isomer – dominates the thin film spectrum with a percentage of more than 90%.
Acknowledgments
The authors thank J. Pflaum for purifying rubrene, A. Mateasik for making the UV-Vis spectrometer available and G. Witte for discussing the results of our work. We gratefully acknowledge financial support by DFG, EPSRC, DAAD, Center of Excellence CENAMOST No. VVCE-0049-07 with support of project APVV-0290-06, VEGA 1/0689/09 and computational resources at LRZ Garching.
References
- Brütting (2005) W. E. Brütting, Physics of Organic Semiconductors (Wiley-VCH, Weinheim, 2005).
- Witte and Wöll (2008) G. Witte and C. Wöll, Phys. Stat. Sol. (a) 205, 497 (2008).
- Gerlach et al. (2008) A. Gerlach, S. Sellner, S. Kowarik, and F. Schreiber, Phys. stat. sol. (a) 205, 461 (2008).
- Park et al. (2007a) S.-W. Park, J. M. Hwang, J.-M. Choi, D. K. Hwang, M. S. Oh, J. H. Kim, and S. Im, Appl. Phys. Lett. 90, 153512 (2007a).
- Park et al. (2007b) S.-W. Park, S. H. Jeong, J.-M. Choi, J. M. Hwang, J. H. Kim, and S. Im, Appl. Phys. Lett. 91, 033506 (2007b).
- Hsu et al. (2007) C. H. Hsu, J. Deng, C. R. Staddon, and P. H. Beton, Appl. Phys. Lett. 91, 193505 (2007).
- Hinderhofer et al. (2007) A. Hinderhofer, U. Heinemeyer, A. Gerlach, S. Kowarik, R. M. J. Jacobs, Y. Sakamoto, T. Suzuki, and F. Schreiber, J. Chem. Phys. 127, 194705 (2007).
- Heinemeyer et al. (2008) U. Heinemeyer, R. Scholz, L. Gisslén, M. I. Alonso, J. O. Ossó, M. Garriga, A. Hinderhofer, M. Kytka, S. Kowarik, A. Gerlach, et al., Phys. Rev. B 78, 085210 (2008).
- Käfer and Witte (2005) D. Käfer and G. Witte, Phys. Chem. Chem. Phys. 7, 2850 (2005).
- Käfer et al. (2005) D. Käfer, L. Ruppel, G. Witte, and C. Wöll, Phys. Rev. Lett. 95, 166602 (2005).
- Kowarik et al. (2006) S. Kowarik, A. Gerlach, S. Sellner, F. Schreiber, J. Pflaum, L. Cavalcanti, and O. Konovalov, Phys. Chem. Chem. Phys. 8, 1834 (2006).
- Schönberg et al. (1954) A. Schönberg, A. Mustafa, and W. Asker, J. Am. Chem. Soc. 76, 4134 (1954).
- Wasserman et al. (1972) H. H. Wasserman, J. R. Scheffer, and J. L. Cooper, J. Am. Chem. Soc. 94, 4991 (1972).
- Woollam (2005) J. A. Woollam (2005).
- Herzinger et al. (1998) C. M. Herzinger, B. Johs, W. A. McGahan, J. A. Woollam, and W. Paulson, J. Appl. Phys. 83, 3323 (1998).
- Mitrofanov et al. (2006) O. Mitrofanov, D. V. Lang, C. Kloc, J. M. Wikberg, T. Siegrist, W.-Y. So, M. A. Sergent, and A. P. Ramirez, Phys. Rev. Lett. 97, 166601 (2006).
- Kytka et al. (2007) M. Kytka, A. Gerlach, F. Schreiber, and J. Kováč, Appl. Phys. Lett. 90, 131911 (2007).
- Ahlrichs et al. (1989) R. Ahlrichs, M. Bär, H. Häser, H. Horn, and C. Kölmel, Chem. Phys. Lett. 162, 165 (1989).
- Bauschlicher (1995) C. W. Bauschlicher, Chem. Phys. Lett. 246, 40 (1995).
- Schäfer et al. (1994) A. Schäfer, C. Huber, and R. Ahlrichs, J. Chem. Phys. 100, 5829 (1994).
- Klamt and Schüürmann (1993) A. Klamt and G. Schüürmann, J. Chem. Soc. Perkin Trans. 2, 799 (1993).
- da Silva Filho et al. (2005) D. A. da Silva Filho, E.-G. Kim, and J.-L. Brédas, Adv. Mater. 17, 1072 (2005).
- Scott and Radom (1996) A. P. Scott and L. Radom, J. Phys. Chem. 100, 16502 (1996).
- Halls et al. (2001) M. D. Halls, J. Velkovski, and H. B. Schlegel, Theo. Chem. Acc. 105, 413 (2001).
- Scholz et al. (2009) R. Scholz, L. Gisslén, C. Himcinschi, I. Vragogić, E. M. Calzado, E. Louis, E. S. F. Maroto, and M. A. Díaz-García, J. Phys. Chem. A 113, 315 (2009).
- Badger and Pearce (1951) G. M. Badger and R. S. Pearce, Spectrochim. Acta 4, 280 (1951).