Institutt for Teoretisk Astrofysikk, Oslo University, Oslo, Norway
Solar Spectroscopy and (Pseudo-)Diagnostics of the Solar Chromosphere
Abstract
I first review trends in current solar spectrometry and then concentrate on comparing various spectroscopic diagnostics of the solar chromosphere. Some are actually not at all chromospheric but just photospheric or clapotispheric and do not convey information on chromospheric heating, even though this is often assumed. Balmer H is the principal displayer of the closed-field chromosphere, but it is unclear how chromospheric fibrils gain their large H opacity. The open-field chromosphere seems to harbor most if not all coronal heating and solar wind driving, but is hardly seen in optical diagnostics.
1 Solar spectroscopy
During this wide-ranging conference I gave a wide-ranging review covering spectroscopy of the solar photosphere, chromosphere, and corona including condensed tutorials111 http://www.astro.uu.nl/~rutten/Lectures_on.html; for a non-condensed syllabus see http://www.astro.uu.nl/~rutten/Lecture_notes.html. of line formation theory for these disparate domains. Being page-limited, I only summarize some major review points here and then concentrate on optical diagnostics of the solar chromosphere – arguably the hardest solar nut to crack (Judge & Peter (1998)).
Solar atmosphere physics.
A major quest of solar physics is to understand the intricate interplay between solar magnetism, gas dynamics, and radiation that makes the solar atmosphere such an outstanding research laboratory and also governs our space environment. The photosphere, chromosphere, and corona represent optically thick, effectively thin, and optically thin interaction domains with much variation in plasma-. They differ much in research techniques and in researcher specialisms, but do require holistic synthesis.
Spectroscopy is a key research tool in this endeavor. It differs from other astronomy in that the solar atmosphere displays its interactions in resolvable fine structure that varies on short time scales. Solar spectroscopy therefore requires high time resolution, both observationally and interpretationally, in addition to high angular resolution and large diagnostic diversity.
Solar physics now.
Solar physics is experiencing a tremendous boost from three developments: wavefront correction enabling 0.1′′ resolution from meter-class optical telescopes, continuous multi-wavelength high-cadence monitoring from space, and increasing realism of numerical MHD simulations of solar-atmosphere fine structure. Photosphere–chromosphere–corona coupling is a key research topic and becomes addressable at the level of detailed understanding rather than wishful cartoon/mechanism thinking.
Classical spectroscopy.
Traditionally, solar spectroscopy concentrated on abundance determination using solar spectrum atlases and assuming LTE with a best-fit plane-parallel hydrostatic-equilibrium model photosphere (review: Rutten (2002)). This practice and the resulting standards in helioseismology and stellar evolution theory have been upset by Asplund’s turning to 3D time-dependent Nordlund-Stein granulation simulations and obtaining significantly smaller abundance values for key elements such as oxygen, carbon and nitrogen (e.g., Asplund et al. (2004); review: Nordlund et al. (2009)).
Trends in observation.
The emphasis of current solar spectrometry is on imaging spectroscopy with high image quality, improving spatial and temporal coverage and resolution by limiting the spectral sampling to only moderate spectral resolution in only specific diagnostic lines. Optically this is done best with Fabry-Pérot interferometers (IBIS, Cavallini (2006), Reardon & Cavallini (2008); CRISP, Scharmer (2006), Scharmer et al. (2008); the new Göttingen one, Bello González & Kneer (2008)). They sample selected line profiles sequentially in time. Instantaneous integral-field spectrometry using fiber and/or lenslet arrays for field reformatting is highly desirable but remains on the horizon (Rutten (1999b); Lin et al. (2004); Sankarasubramanian et al. (2009)). Slit spectrometers are still in use, but only for precision spectropolarimetry and for ultraviolet emission-line measurement from space, in both cases for want of suited integral-field technology. Slits are no good because they always sample the wrong place at the wrong time. In ground-based observation, they also inhibit wavefront restoration by algorithms such as the very effective MOMFBD of van Noort et al. (2005), a must in addition to adaptive optics. In space-based observation, multi-layer mirror technology has enabled the fruitful narrow-passband EUV imaging of SOHO, TRACE, STEREO and the comprehensive monitoring promised by SDO, but, unfortunately, ultraviolet integral-field spectrometry remains a too distant hope.
Trends in interpretation.
Solar-atmosphere radiative transfer modeling is presently split between data inversions and simulatory forward modeling. Inversion codes initiated by Ruiz-Cobo et al. (1990, 1992) replace the classical “semi-empirical” (= best-fit) “one-dimensional” (= plane-parallel hydrostatic-equilibrium) modeling that either assumed LTE and CRD (Holweger (1967); revised into HOLMUL by Holweger & Müller (1974)) or relaxed these assumptions to NLTE and PRD (VALC, Vernazza et al. (1981), revised into FALC by Fontenla et al. (1993)). The data inversions obtain such best-fit stratifications per pixel on the solar surface and are applied particularly in photospheric spectropolarimetry. Just as for the standard models, they loose credibility higher up where clapotispheric (see below) and chromospheric fluctuations are too wild for smooth spline-function fitting or temporal averaging and vertical columns too poor a sample of 3D structure. Chromospheric line formation requires forward modeling in the form of NLTE line synthesis within numerical simulations including non-equilibrium ionization evaluation (see below). A major task is to implement 3D time-dependent radiative transfer in 3D time-dependent MHD codes. A major challenge is to make such codes fast.
[width=80mm]./rutten-2levelpairs
2 Solar line formation
Fig. 1 displays all radiative excitation–deexcitation process combinations for idealized two-level atoms. Their competition defines different radiation-physics domains of spectral line formation:
-
–
LTE = large collision frequency
-
–
up: mostly collisional = thermal creation (d + e);
-
–
down: mostly collisional = large destruction probability (a);
-
–
photon travel: “honorary gas particles” or negligible leak.
-
–
-
–
NLTE = statistical equilibrium or time-dependent
-
–
up and down: mostly radiative = non-local sources;
-
–
two-level scattering: coherent/complete/partial redistribution;
-
–
multi-level travel: pumping, suction, sensitivity transcription.
-
–
-
–
coronal equilibrium = hot tenuous
-
–
up: only collisional = thermal creation (only d);
-
–
down: only spontaneous (only d);
-
–
photon travel: escape / drown / scatter bf H I, He I, He II.
-
–
that also characterize line formation in solar-atmosphere domains:
-
–
Photosphere. Optical continuum and weak-line photon escape. High density makes LTE (= Saha–Boltzmann population ratios producing ) valid for optical continua and reasonable for most subordinate lines. “Height of formation” is a valid concept. The major trick is the Eddington-Barbier approximation for quick insight and inversion constraining. Upper-photosphere resonance lines such as the Na I D lines, K I 7699 Å, and Ba II 4554 Å darken from simple resonance scattering (Uitenbroek & Bruls (1992)).
-
–
Chromosphere. Strong-line photon escape. LTE is invalid, statistical equilibrium is invalid, complete redistribution is invalid, instantaneous ionization equilibrium is invalid, single-fluid description is likely to be invalid. Height of formation: fibrils somewhere between the photosphere and the telescope (Rutten (2007)). The major trick is the four-parameter (, , , ) cloud model of Beckers (1964), but all applications deriving temperature and density using H have erred in assuming instantaneous ionization/recombination balancing (see below).
-
–
Corona. Immediate photon escape. Optical thinness plus the (d)-only equilibrium (but adding dielectronic recombination into the bound-free analogon) give the major trick: “emission measure”. Resonance scattering may affect the strongest lines. Bound-free scattering out of EUV-line filtergraph passbands makes neutral-hydrogen clouds appear thickly black against bright EUV-line backgrounds in EUV filtergrams (see the cartoon in Fig. 10 of Rutten (1999a)).
3 Clapotisphere versus chromosphere
The LTE line-fitting HOLMUL model favored by pre-Asplund abundance determiners has no chromosphere whatsoever but a temperature stratification close to radiative equilibrium to avoid non-observed reversals (emission cores) in strong Fe I lines. Admitting realistic NLTE departures delivers the same apparent line-core excitation temperatures when there is a chromospheric temperature rise above km (Rutten & Kostik (1982)), and therefore the NLTE VALC/FALC models fudged the ultraviolet line haze (Zwaan (1975)) to resemble HOLMUL LTE lines by imposing a gradual transition from pure absorption to pure scattering over the upper photosphere (Rutten (1988)), so that they don’t feel the VALC/FALC temperature rise which became known as “the chromosphere”. However, Carlsson & Stein (1997) showed that such a global temperature rise is unlikely to occur below km in quiet-Sun internetwork, where intermittent shocks momentarily raise the temperature in brief spikes that dominate the time-averaged ultraviolet emissivity. I called this shock-ridden regime the “clapotisphere” (Rutten (1995)) using a nautical term for fierce wave interaction. It is cartoonized in Fig. 2.

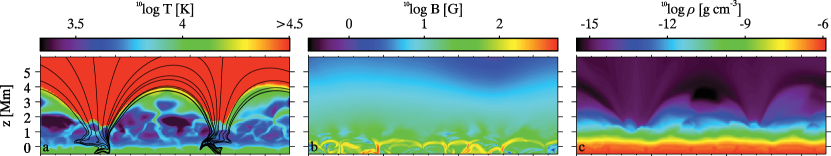
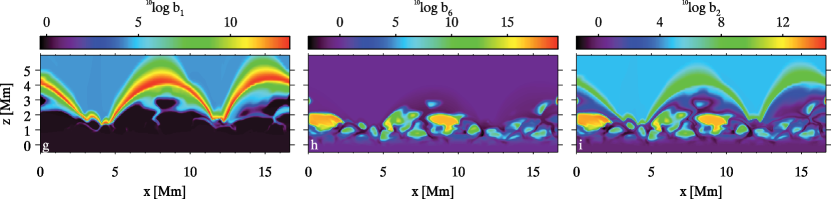
Such cartoons are now being vindicated by the numerical STAGGER simulations performed in Oslo (Hansteen et al. (2007)). The STAGGER snapshot in Fig. 3 shows smooth field at heights above the canopies outlined by high arches of exceedingly large internetwork hydrogen and NLTE overpopulations. Clapotispheric shocks interact and dominate beneath these arches. The intershock phases are cool (first panel) and have large ion and overpopulations (last two panels). These arise from sluggish recombination. Hydrogen ionizes fast in the hot shocks, but does not recombine quickly enough in the cool aftermath to settle its ion/atom balancing before the next shock comes along. The overpopulation of the level, which sets the opacity of H , follows the ground-state overpopulations in the arches and the ion overpopulations in the clapotisphere.
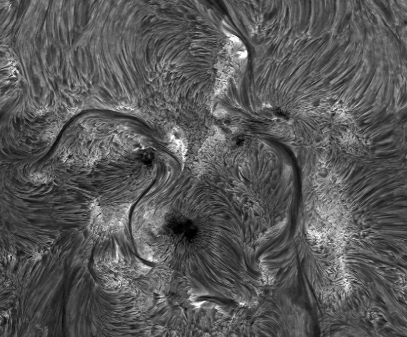
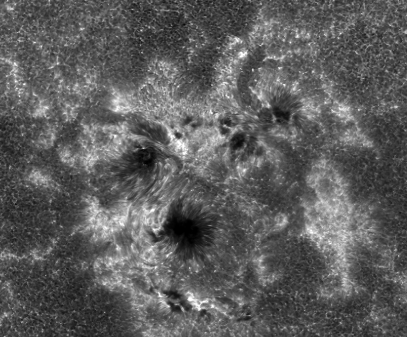
So what is the chromosphere? Classically, the name denotes the thin H -dominated pink crescents around the eclipsed Sun glimpsed just after second and just before third contact222As on July 22 this year here in India if the weather suits.. The H image in Fig. 4 shows that this pink emission is dominated by long fibrils that connect various parts of active regions. In quieter areas, such H fibrils typically connect network across cell interiors. These fibrils constitute the chromosphere. The parallel Ca II H image maps them only in the active region and only partially even there. Elsewhere it displays clapotispheric sub-canopy shocks and H2V grains. Thus, the H image shows the chromosphere whereas the Ca II H image is partly clapotispheric and partly chromospheric (but mostly pseudo, see below).
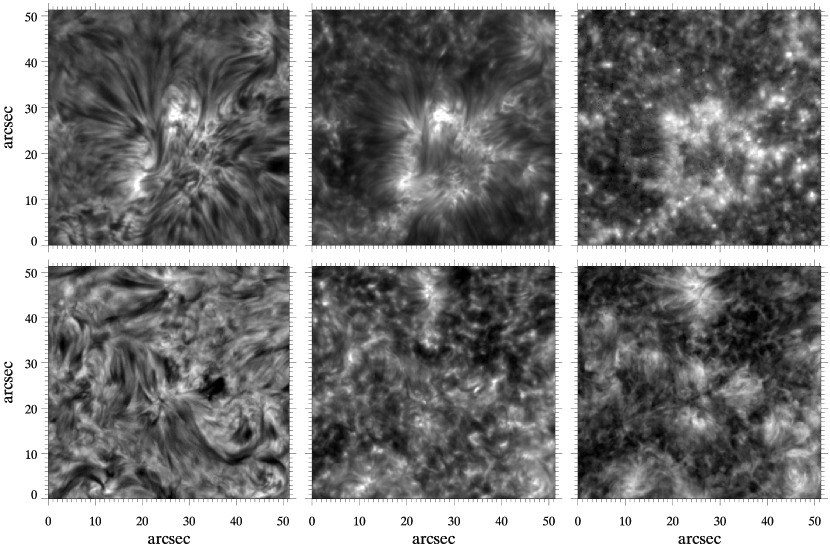
Fig. 5 shows similar comparisons. The active network again shows long network-spanning fibrils in H , but the quiet region has the clapotisphere poking through away from network even in H (cf. Rouppe van der Voort et al. (2007); Rutten et al. (2008)). The upper Ca II 8542 Å image shows the fibrils partially, the lower one is mostly clapotispheric away from the network. The Na I D1 image (third panel) also, or not even clapotispheric but just upper-photospheric since the IBIS spectroscopy shows virtually no shock signatures (Kevin Reardon, private communication). The final panel is discussed below.
4 Pseudo diagnostics of the chromosphere
Many spectral features that are commonly supposed to be chromospheric actually are “below-the-surface viewers” for which enhanced brightness has nothing to do with chromospheric emissivity or heating but with deep photon escape. The viewing pipes are Spruit fluxtubes, slender kilogauss magnetic concentrations that occur only sparsely and intermittently in quiet-Sun supergranulation cell interiors (De Wijn et al. (2005)) but assemble more stably in supergranular cell boundaries to form the magnetic network. At yet larger density they constitute plage. Fig. 6 explains how they appear as “bright points” near disk center and as “faculae” towards the limb.


Also this old cartoon has been vindicated by recent simulations, for continuum faculae by Keller et al. (2004), for G-band faculae by Carlsson et al. (2004), for bright points in the wings of strong lines by Leenaarts et al. (2006), and for bright points in the unusually wide lines of Mn I by Vitas et al. (2009). The latter analysis, summarized in Fig. 7, explains why the brightening seems less in all other, less wide, photospheric lines: it is not, but they show the outside granulation brighter from convective Dopplershift wash-out and so loose fluxtube contrast.
These fluxtubes have near-radiative-equilibrium stratifications across the upper photosphere, at least up to km as sampled by the wings of Ca II H & K (Sheminova et al. (2005)), just as the mean outside photosphere above the granulation. No significant mechanical heating therefore: photospheric fluxtubes brighten through deeper viewing. All solar irradiance modeling efforts that regard faculae as hot stick-up stalks and mimic such with raised-temperature upper photospheres are inherently wrong (e.g., Unruh et al. (1999); Fontenla et al. (2006); Danilović et al. (2007)).
The Na I D1 image in Fig. 5 suggests that also the network brightening in this line is mostly hole-in-the-surface viewing. The outside surface is formed in the upper photosphere and very dark from scattering (Uitenbroek & Bruls (1992)), the tube inside is likely to be as bright as the continuum from ionization. This is now verifiable with Oslo STAGGER simulations.
The 5th panel of Fig. 5 suggests that also Ca II 8542 Å gains network brightening from surface-hole viewing when not obscured by fibrils. The STAGGER simulation of Leenaarts et al. (2009) supports this notion. The fluxtube at left in their Fig. 4 obtains large brightness from deep line-center formation and Doppler brightening in a post-shock downdraft, a likely occurrence in deep-shocking fluxtubes (Steiner et al. (1998)).
The Ca II H & K lines have larger opacity than Ca II 8542 Å in any imaginable structure and reach larger opacity than H in classical LTE modeling333http://www.astro.uu.nl/~rutten/rrweb/rjr-material/bachelor/ssa. and in one-dimensional NLTE modeling (Vernazza et al. (1981)). One would therefore expect to observe a denser fibril forest at right in Fig. 4 than at left. However, the DOT Ca II H filter and all other H & K filtergraphs have far too wide passbands to isolate the line core, even the narrowest ones at 0.3 Å (Brandt et al. (1992); Hoekzema et al. (1998); Wöger et al. (2006)). In addition, fibrils are very dark in H & K (Rutten et al. (2008)), so that the addition of bright structures in the inner wings dominates the scene. Magnetic concentrations are likely to again function as hole-in-the-surface viewers, with the outside surface clapotispherically cool and dark except in shocks, and the tube inside and close surroundings bright by scattering photons from below (cf. Fig. 8 of Rutten (1999a), another old cartoon).
Thus, I contend that the apparent network brightness in Na I D1 and Ca II 8542 Å imaging spectroscopy and much of the apparent network brightness in Ca II H & K filtergrams has less to do with chromospheric heating than with hole-in-the-surface viewing. Corollaries are that the Mount-Wilson Ca II H & K stellar activity monitoring (e.g., Rutten (1986); Duncan et al. (1991)) delivers counts of such holes on the stellar surface, not the amount of chromospheric heating, and that the good correspondence between the various diagnostics of Loukitcheva et al. (2009) follows naturally because they are all hole counters. And I repeat that the basal flux (review: Schrijver (1995)) is most likely clapotispheric (Rutten (1999a)).
5 Heating in the chromosphere
So how to diagnose chromospheric heating, or rather, the onset of coronal heating taking place in the chromosphere? My contention that most network emissivity in Na I D1, Ca II 8542 Å and Ca II H in Figs. 4 and 5 stems from photospheric or clapotispheric view-pipe photon escape leads to the suggestion that not much chromospheric heating is seen in these images. The H fibrils do display chromospheric fine-structure morphology, but whether these appear dark or bright is a matter of fortuitous combination of the four cloud parameters , , , . Only senses the temperature directly because the small atomic mass of hydrogen favors thermal over nonthermal broadening. The final panel of Fig. 5 therefore displays a measure of chromospheric temperature. It evidences heating in and near network (Cauzzi et al. (2009)).
It seems likely that this network heating occurs through open-field chromospheric structures, i.e., more vertical than H fibrils and connecting less closely than across network cells. They are barely visible in H but were discovered as fast-waving “straws” in DOT Ca II H near-limb movies, appearing bright against the very dark internetwork clapotisphere (Rutten (2006)), and subsequently as fast-waving “spicules-II” in Hinode Ca II H off-limb movies by De Pontieu et al. (2007b). De Pontieu et al. (2007c) identified Alfvén waves as their modulation agent and estimated that these accelerate the solar wind. Being very slender and very fast-moving, straws/spicules-II are very hard to observe on-disk (Langangen et al. (2008)), but ongoing work (De Pontieu et al. (2008)) suggests that they occur ubiquitously above unipolar network and plage and may supply heating through component reconnection, reminiscent of the separatrix shear proposed by Van Ballegooijen et al. (1998, 1999) and marked as cross-dashes in my old cartoon in Fig. 2. I suggest that unresolved straw heating causes the network patches of large H core width in the last panel of Fig. 5, some of the Ca II 8542 Å near-network fibril brightness in the second panel of Fig. 5, and the diffuse bright aureoles seen in DOT Ca II H movies around network that seem to resolve into straws in the very sharpest one444 http://dot.astro.uu.nl/albums/movies/2006-04-24-NW-ca.avi or .mov.
Another speculation is that straw dynamics also contributes to the solar-wind FIP fractionation.
6 Discussion
There are striking and disconcerting similarities between the visibility of the corona in the form of EUV-line loops and of the chromosphere in the form of H fibrils. Both types of structure seem to map the large-scale magnetic field topology, although there is no direct proof of direct correspondence. In both cases it is a misconception to regard them as magnetic fluxtubes embedded in field-free plasma (or vacuum). Loops and fibrils chart bundles of field that for some reason contain more gas containing atoms and ions in the right state for emissivity and/or extinction in the pertinent lines than the surrounding, otherwise very similar field bundles. The actual field topology is probably more uniform than the fine-scaled emissivity/extinction structuring suggests (Judge (2006)). The mass loading and dynamics of these narrow bundles are likely structured on the scales of intergranular fluxtubes by thermodynamical processes affecting these magnetic footpoints, but the actual connection topology may be as complicated as in Fig. 18 of De Pontieu et al. (2003).
A disconcerting similarity of coronal loops and chromospheric fibrils is that neither structure has yet been produced naturally in MHD simulations. Acoustic oscillations have been shown to drive and probably mass-load short dynamic fibrils jutting out from network and plage (Hansteen et al. (2006); De Pontieu et al. (2007a)), but the mass loading of the long network-spanning fibrils and yet longer coronal loops remains unexplained. The overpopulation arches in Fig. 3 are promisingly similar to actual H fibrils, but they contain insufficient H opacity, notwithstanding their enormous overpopulation, to produce the thickness in H that is characteristic of fibrils. This simulation was 2D only, but also the newer 3D Oslo STAGGER simulations have not produced fibrils or loops so far. Perhaps the simulation volumes are still too small, or perhaps they are too unipolar, or perhaps longer history is needed, perhaps to let trickling siphon flows build up appreciable mass loads.
Another disconcerting similarity is that both coronal loops and chromospheric fibrils delineate closed fields whereas the action lies in the open-field components, respectively driving the fast wind and heating the corona. Their visibility is meager: coronal holes are indeed holes in emissivity and chromospheric straws/spicules-II were discovered only recently. The natural emphasis on higher-visibility loops and fibrils seems to target red herrings qua importance and role.
Finally, it seems likely that the so-called transition region exists mostly as hot evaporation sheaths around these ephemeral structures (McIntosh et al. (2008); Judge & Centeno (2008); Koza et al. (2009)), a far cry from the stable spherical shell invoked in one-dimensional modeling or the radial stratification wishfully assumed in many transition-region oscillation propagation studies.
References
- Asplund et al. (2004) Asplund, M., Grevesse, N., Sauval, A. J., Allende Prieto, C., Kiselman, D. 2004, A&A, 417, 751
- Beckers (1964) Beckers, J. M. 1964, A Study of the Fine Structures in the Solar Chromosphere, AFCRL Environmental Research Paper No. 49, PhD thesis Utrecht University
- Bello González & Kneer (2008) Bello González, N., Kneer, F. 2008, A&A, 480, 265
- Brandt et al. (1992) Brandt, P. N., Rutten, R. J., Shine, R. A., & Trujillo Bueno, J. 1992, Cool Stars, Stellar Systems, and the Sun, ASP Conf. Ser., 26, 161
- Carlsson & Stein (1997) Carlsson, M., Stein, R. F. 1997, ApJ, 481, 500
- Carlsson et al. (2004) Carlsson, M., Stein, R. F., Nordlund, Å., Scharmer, G. B. 2004, ApJ, 610, L137
- Cauzzi et al. (2009) Cauzzi, G., Reardon, K., Rutten, R., Tritschler, A., Uitenbroek, H. 2009, A&A, in press, arXiv:0906.2083
- Cavallini (2006) Cavallini, F. 2006, Solar Phys., 236, 415
- Danilović et al. (2007) Danilović, S., Solanki, S. K., Livingston, W., Krivova, N., Vince, I. 2007, in Modern solar facilities - advanced solar science, eds. F. Kneer, K. G. Puschmann, & A. D. Wittmann, 189
- De Pontieu et al. (2008) De Pontieu, B., Carlsson, M., McIntosh, S., Hansteen, V., Tarbell, T. 2008, 12th European Solar Physics Meeting, http://espm.kis.uni-freiburg.de, 2.15
- De Pontieu et al. (2007a) De Pontieu, B., Hansteen, V. H., Rouppe van der Voort, L., van Noort, M., Carlsson, M. 2007a, ApJ, 655, 624
- De Pontieu et al. (2007b) De Pontieu, B., McIntosh, S., Hansteen, V. H., et al. 2007b, PASJ, 59, 655
- De Pontieu et al. (2007c) De Pontieu, B., McIntosh, S. W., Carlsson, M., et al. 2007c, Science, 318, 1574
- De Pontieu et al. (2003) De Pontieu, B., Tarbell, T., Erdélyi, R. 2003, ApJ, 590, 502
- De Wijn et al. (2005) De Wijn, A. G., Rutten, R. J., Haverkamp, E. M. W. P., Sütterlin, P. 2005, A&A, 441, 1183
- Duncan et al. (1991) Duncan, D. K., Vaughan, A. H., Wilson, O. C., et al. 1991, ApJS, 76, 383
- Fontenla et al. (2006) Fontenla, J. M., Avrett, E., Thuillier, G., Harder, J. 2006, ApJ, 639, 441
- Fontenla et al. (1993) Fontenla, J. M., Avrett, E. H., Loeser, R. 1993, ApJ, 406, 319
- Hansteen et al. (2007) Hansteen, V. H., Carlsson, M., Gudiksen, B. 2007, in The Physics of Chromospheric Plasmas, eds. P. Heinzel, I. Dorotovič, & R. J. Rutten, ASP Conf. Ser., 368, 107
- Hansteen et al. (2006) Hansteen, V. H., De Pontieu, B., Rouppe van der Voort, L., van Noort, M., Carlsson, M. 2006, ApJ, 647, L73
- Hoekzema et al. (1998) Hoekzema, N. M., Rutten, R. J., Brandt, P. N., & Shine, R. A. 1998, A&A, 329, 276
- Holweger (1967) Holweger, H. 1967, Zeitschrift fur Astrophysik, 65, 365
- Holweger & Müller (1974) Holweger, H., Müller, E. A. 1974, Solar Phys., 39, 19
- Judge (2006) Judge, P. 2006, in Solar MHD Theory and Observations: A High Spatial Resolution Perspective, eds. J. Leibacher, R. F. Stein, & H. Uitenbroek, ASP Conf. Ser., 354, 259
- Judge & Centeno (2008) Judge, P., Centeno, R. 2008, ApJ, 687, 1388
- Judge & Peter (1998) Judge, P. G., Peter, H. 1998, Space Science Reviews, 85, 187
- Keller et al. (2004) Keller, C. U., Schüssler, M., Vögler, A., Zakharov, V. 2004, ApJ, 607, L59
- Koza et al. (2009) Koza, J., Rutten, R. J., Vourlidas, A. 2009, A&A, 499, 917
- Langangen et al. (2008) Langangen, Ø., De Pontieu, B., Carlsson, M., et al. 2008, ApJ, 679, L167
- Leenaarts et al. (2009) Leenaarts, J., Carlsson, M., Hansteen, V., Rouppe van der Voort, L. 2009, ApJ, 694, L128
- Leenaarts et al. (2007) Leenaarts, J., Carlsson, M., Hansteen, V., Rutten, R. J. 2007, A&A, 473, 625
- Leenaarts et al. (2006) Leenaarts, J., Rutten, R. J., Carlsson, M., Uitenbroek, H. 2006, A&A, 452, L15
- Lin et al. (2004) Lin, H., Kuhn, J. R., Coulter, R. 2004, ApJ, 613, L177
- Lites et al. (1996) Lites, B. W., Leka, K. D., Skumanich, A., Martínez Pillet, V., Shimizu, T. 1996, ApJ, 460, 1019
- Loukitcheva et al. (2009) Loukitcheva, M., Solanki, S. K., White, S. M. 2009, A&A, 497, 273
- McIntosh et al. (2008) McIntosh, S. W., De Pontieu, B., Tarbell, T. D. 2008, ApJ, 673, L219
- Nordlund et al. (2009) Nordlund, Å., Stein, R. F., Asplund, M. 2009, Living Reviews in Solar Physics, 6, 2
- Reardon & Cavallini (2008) Reardon, K. P., Cavallini, F. 2008, A&A, 481, 897
- Rouppe van der Voort et al. (2007) Rouppe van der Voort, L. H. M., De Pontieu, B., Hansteen, V. H., Carlsson, M., van Noort, M. 2007, ApJ, 660, L169
- Ruiz Cobo & del Toro Iniesta (1992) Ruiz Cobo, B., del Toro Iniesta, J. C. 1992, ApJ, 398, 375
- Ruiz Cobo et al. (1990) Ruiz Cobo, B., del Toro Iniesta, J. C., Collados, M., Sánchez Almeida, J. 1990, Ap&SS, 170, 113
- Rutten (1986) Rutten, R. G. M. 1986, A&A, 159, 291
- Rutten (1988) Rutten, R. J. 1988, in Physics of Formation of FeII Lines Outside LTE, eds. R. Viotti, A. Vittone, & M. Friedjung, IAU Coll. 94, Reidel, Dordrecht, 185
- Rutten (1995) Rutten, R. J. 1995, in Helioseismology, eds. J. T. Hoeksema, V. Domingo, B. Fleck, & B. Battrick, ESA SP–376 Vol. 1, 151
- Rutten (1999a) Rutten, R. J. 1999a, in Magnetic Fields and Oscillations, eds. B. Schmieder, A. Hofmann, & J. Staude, ASP Conf. Ser., 184, 181
- Rutten (1999b) Rutten, R. J. 1999b, in High Resolution Solar Physics: Theory, Observations, and Techniques, eds. T. R. Rimmele, K. S. Balasubramaniam, R. R. Radick, ASP Conf. Ser., 183, 296
- Rutten (2002) Rutten, R. J. 2002, J. Astron. Data, 8, 8
- Rutten (2003) Rutten, R. J. 2003, Radiative Transfer in Stellar Atmospheres, http://www.astro.uu.nl/~rutten, Lecture notes Utrecht University
- Rutten (2006) Rutten, R. J. 2006, in Solar MHD Theory and Observations: A High Spatial Resolution Perspective, eds. J. Leibacher, R. F. Stein, H. Uitenbroek, ASP Conf. Ser., 354, 276
- Rutten (2007) Rutten, R. J. 2007, in The Physics of Chromospheric Plasmas, eds. P. Heinzel, I. Dorotovič, R. J. Rutten, ASP Conf. Ser., 368, 27
- Rutten & Kostik (1982) Rutten, R. J., Kostik, R. I. 1982, A&A, 115, 104
- Rutten et al. (2008) Rutten, R. J., van Veelen, B., Sütterlin, P. 2008, Solar Phys., 251, 533
- Sankarasubramanian et al. (2009) Sankarasubramanian, K., Hasan, S. S., Rangarajan, K. E. 2009, in Magnetic Coupling between the Interior and the Atmosphere of the Sun, eds. S. S. Hasan, R. J. Rutten, Springer, Heidelberg, in press
- Scharmer (2006) Scharmer, G. B. 2006, A&A, 447, 1111
- Scharmer et al. (2008) Scharmer, G. B., Narayan, G., Hillberg, T., et al. 2008, ApJ, 689, L69
- Schrijver (1995) Schrijver, C. 1995, A&A Rev., 6, 181
- Sheminova et al. (2005) Sheminova, V. A., Rutten, R. J., Rouppe van der Voort, L. H. M. 2005, A&A, 437, 1069
- Solanki & Brigljevic (1992) Solanki, S. K., Brigljevic, V. 1992, A&A, 262, L29
- Spruit (1976) Spruit, H. C. 1976, Solar Phys., 50, 269
- Steiner et al. (1998) Steiner, O., Grossmann-Doerth, U., Knölker, M., Schüssler, M. 1998, ApJ, 495, 468
- Uitenbroek & Bruls (1992) Uitenbroek, H., Bruls, J. H. M. J. 1992, A&A, 265, 268
- Unruh et al. (1999) Unruh, Y. C., Solanki, S. K., Fligge, M. 1999, A&A, 345, 635
- van Ballegooijen & Nisenson (1999) van Ballegooijen, A. A., Nisenson, P. 1999, in High Resolution Solar Physics: Theory, Observations, and Techniques, eds. T. R. Rimmele, K. S. Balasubramaniam, R. R. Radick, ASP Conf. Ser., 183, 30
- van Ballegooijen et al. (1998) van Ballegooijen, A. A., Nisenson, P., Noyes, R. W., et al. 1998, ApJ, 509, 435
- van Noort et al. (2005) van Noort, M., Rouppe van der Voort, L., Löfdahl, M. G. 2005, Solar Phys., 228, 191
- Vernazza et al. (1981) Vernazza, J. E., Avrett, E. H., Loeser, R. 1981, ApJS, 45, 635
- Vitas et al. (2009) Vitas, N., Viticchiè, B., Rutten, R. J., Vögler, A. 2008, A&A, 499, 301
- Wöger et al. (2006) Wöger, F., Wedemeyer-Böhm, S., Schmidt, W., von der Lühe, O. 2006, A&A, 459, L9
- Zwaan (1975) Zwaan, C. 1975, Solar Phys., 45, 115