On discrepancy between ATIC and Fermi data
Abstract
Either ATIC or Fermi-LAT data can be fitted together with the PAMELA data by three components: primary background , secondary background , and an additional source of electrons . We find that the best fits for ATIC + PAMELA and for Fermi + PAMELA are approximately the same, and GeV. However, the ATIC data have a narrow bump between 300 GeV and 600 GeV which contradicts the smooth Fermi spectrum. An interpretation of the ATIC bump as well as the featureless Fermi spectrum in terms of dark matter models and pulsars is discussed.
pacs:
96.50.S-, 98.70.SaThe question of interpretation of Fermi-LAT Abdo:2009zk , HESS Collaboration:2008aaa ; Aharonian:2009ah , and ATIC data :2008zzr can be split into two parts: general properties of the flux and the presence of features. If one takes into account PAMELA data Adriani:2008zr , then both Fermi and ATIC require the existence of an additional flux of electrons and positrons complementary to the standard primary and secondary backgrounds.
We will consider the following form for the additional flux
| (1) |
The general properties of the flux will be parameterized by the index and the exponential cutoff . Significant deviations from this form will be considered as “features”.
We will assume the primary background , the index can be estimated from the electron injection index due to shock acceleration in the supernovae explosions 1991ApJEllison ; 1992ApJReinolds (a similar estimation for the shock acceleration in gamma ray bursts can be found in Achterberg:2001rx ; Piran:2004ba ). The shift of the index from to is due to cooling during propagation Longair1992 . Secondary background of electrons and positrons is produced by collisions of high energy protons and nuclei Strong:2007nh ; Amsler:2008zzb with the dust. We will assume the secondary background , where the difference in the indices is again due to cooling. Since the normalization and the indices of the backgrounds are known only approximately, we will treat them as independent parameters in the fits.
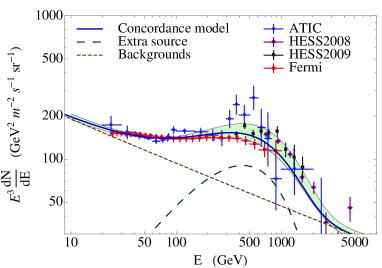
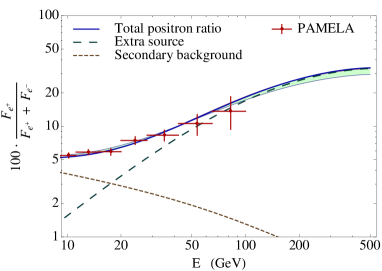
In order to find the properties of the additional flux, we will use the ATIC data, the Fermi data, and the PAMELA data above 10 GeV (the points below 10 GeV are assumed to suffer from solar modulation and we will discard them for the purposes of current analysis). The results of the fits to ATIC + PAMELA and to Fermi + PAMELA are presented in Figs. 1 and 2 and in Table 1. Both ATIC + PAMELA and Fermi + PAMELA are fitted best by an additional flux with and GeV, i.e., these experiments are consistent with each other from the point of view of general properties of the flux parameterized by Eq. (1). It should be noted that without PAMELA data, the ATIC bump is better fitted with a harder additional flux, , while the Fermi data are consistent with the primary background Abdo:2009zk ; Grasso:2009ma .
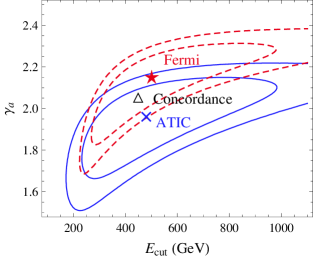
The second question is the presence of features. The Fermi data are well approximated by the additional source in Eq. (1) while the ATIC data have a deviation from (1) between 300 GeV and 600 Gev. Thus, although the parameters of the additional flux in Eq. (1) necessary to fit ATIC and Fermi data are similar, the ATIC data have a bump while the Fermi data don’t have any features, i.e., there is a disagreement between the two data sets at energies 300 - 600 GeV. As one can see in Table 1, the best fit for Fermi + PAMELA has a better reduced chi-squared, , than the best fit for ATIC + PAMELA, .
In the following we will summarize the properties of dark matter (DM) models and pulsars necessary to reproduce both the flux with features and the flux without features. Due to energy losses, the source of high energy electrons should be close to Earth, within approximately 1 - 3 kpc. For the purposes of flux calculation, the DM distribution can be viewed as homogeneous and constant Kuhlen:2009is (unless there is a significant contribution from a local DM substructure such as a clump Hooper:2008kv ; Brun:2009aj ; Kuhlen:2009is ). The flux from a homogeneous source is Longair1992
| (2) |
where is the energy losses. At GeV the energy losses are due to Inverse Compton Scattering and synchrotron radiation in the galactic magnetic field, thus Longair1992 . is the source function for produced by annihilating or decaying DM, .
| Data | ||||||
| (GeV) | () | |||||
| ATIC + PAMELA | 3.27 | 3.63 | ||||
| Fermi + PAMELA | 3.31 | 3.63 | ||||
| Concordance model | 1.3 | 3.29 | 3.63 |
The cutoff energy is the energy where the integral on the right hand side of Eq. (2) is saturated. For energies the integral is insensitive to the variations of the lower limit and . Thus an index is a universal prediction of DM. Local clumps of DM result in a harder spectrum Hooper:2008kv ; Kuhlen:2009is . The dependence on the host halo profile leads to a softer spectrum at low energies Kuhlen:2009is . In models with small diffusion height, there may be some hardening at low energies due to leakage of electrons from the Galaxy (see, e.g., model M2 in Figure 3 of Chen:2008fx ).
For a given GeV, the DM mass and the shape of the spectrum depend on the DM model. In general, DM annihilation is followed by a sequence of decays leading to electrons and positrons together with other stable particles in the end. Models with many steps in the decay process have smooth spectrum and a large DM mass Kuhlen:2009is ; Mardon:2009rc . These models are favored Meade:2009iu ; Bergstrom:2009fa by featureless Fermi spectrum. Models with decay channels through , gauge bosons and quarks have stricter constraints due to absence of significant deviations from the expected backgrounds for anti-protons Adriani:2008zq and diffuse gamma rays from the Galactic center Aharonian:2006au ; Aharonian:2006wh . The flux of gamma rays from DM clumps assuming annihilation channel was also estimated Kuhlen:2008aw . DM models with small DM mass GeV (e.g., Bergstrom:2008gr ; Grajek:2008pg ) seem to be in tension with Fermi data due to absence of significant step-like features below or around 500 Gev.
DM models with few decay steps have a sharper cutoff and Kuhlen:2009is ; Mardon:2009rc ; Meade:2009rb . These models give reasonable fits to the Fermi data for TeV Grasso:2009ma , however, due to a sharp cutoff near they, generally, fit better the ATIC data Mardon:2009rc . These models may have additional constrained due to final state radiation from the Galactic center and the Galactic ridge Mardon:2009rc ; Meade:2009rb .
Local clumps may produce additional features at high energies. The presence of a large local clump is disfavored by Fermi but consistent with ATIC Kuhlen:2009is . Furthermore, in models with many decay steps, a significant contribution from a local clump may be necessary to fit the ATIC bump.
Thus, the Fermi data favor dark matter with many decay steps and a large DM mass while ATIC requires either a DM model with few decay steps or a significant local substructure in DM density distribution.
Let us now turn to pulsars. In the calculation of electron and positron fluxes, pulsars can be considered as point-like instantaneous sources Malyshev:2009tw , . The main reason is that the typical propagation time ( kyr) is much larger than the characteristic time scale when a pulsar loses most of its rotational energy and the electrons and positrons are released to the interstellar medium (ISM).
For every pulsar, we will consider two energy scales Malyshev:2009tw ; Grasso:2009ma : the cutoff in the injection spectrum of electrons and positrons from the pulsar into the ISM, , which can be between few hundred GeVs and tens of TeVs (see, e.g., Arons1996 and references in Malyshev:2009tw ), and the cooling break , obtained by integrating the energy losses during the propagation time , where is approximately the age of the pulsar. At GeV the energy losses can be estimated as Kobayashi:2003kp . At energies GeV the coefficient slightly decreases with the energy Kobayashi:2003kp , since the Thompson approximation to inverse Compton scattering between electrons and the starlight becomes inapplicable.
For pulsars with age Myr, the cooling break is GeV. In the ATNF catalog there are several hundred pulsars within 3 kpc from Earth and an age Myr Manchester:2004bp . Below approximately 300 GeV, the corresponding flux is well approximated by the flux from a continuous distribution of pulsars in the Galactic plane Malyshev:2009tw . An index requires an index in the electron injection spectrum from pulsars Hooper:2008kg ; Yuksel:2008rf ; Profumo:2008ms ; Ioka:2008cv ; Shaviv:2009bu ; Malyshev:2009tw ; Kawanaka:2009dk .
At energies GeV, the flux receives contributions only from young pulsars Myr within a smaller distance kpc (since the propagation time is smaller). One may expect only of order ten such pulsars Manchester:2004bp . There is also a lower bound on the age of pulsars, a few tens of kyr, due to the fact that the electrons may still be trapped by the Pulsar Wind Nebulae.
Depending on the relative value of and , there are two possibilities for the flux from pulsars:
-
•
, then the observed spectrum is naturally flat if we assume that the injection spectrum from pulsars is flat. This possibility is favored by the Fermi data Grasso:2009ma .
-
•
, then the cutoff in the observed spectrum is due to the cooling break which is much sharper than an exponential cutoff. One should also expect a series of steps due to consecutive cooling break cutoffs from different pulsars Malyshev:2009tw . This possibility is consistent with ATIC but may be in tension with Fermi.
To summarize, both Fermi and ATIC require an additional source of electrons and positrons with an index at low energies and a cutoff GeV. However the presence of a bump at high energies in ATIC data contradicts the smooth spectrum of Fermi and HESS. The sources that produce featureless spectrum include the DM models with TeV and several steps in DM annihilation process as well as pulsars with an injection cutoff . The sources that can produce ATIC bump include DM models with and few decay steps or DM models with and a significant contribution from a local clump. Pulsars with may give a sharp cutoff in the observed flux and, possibly, step-like features due to a series of cooling break cutoffs from the youngest nearby pulsars. This possibility is in tension with the Fermi data but consistent with the ATIC.
Acknowledgments.
The author is thankful to Mirko Boezio, Ilias Cholis, Joseph Gelfand, Lisa Goodenough, Michael Kuhlen, Neal Weiner, and Weiqun Zhang for valuable discussions. This work is supported in part by the Russian Foundation of Basic Research under grant RFBR 09-02-00253 and by the NSF grants PHY-0245068 and PHY-0758032.
References
- (1) The Fermi LAT Collaboration, A. A. Abdo et. al., Measurement of the Cosmic Ray e+ plus e- spectrum from 20 GeV to 1 TeV with the Fermi Large Area Telescope, arXiv:0905.0025.
- (2) H.E.S.S. Collaboration, F. Aharonian et. al., The energy spectrum of cosmic-ray electrons at TeV energies, Phys. Rev. Lett. 101 (2008) 261104, [arXiv:0811.3894].
- (3) H.E.S.S. Collaboration, F. Aharonian et. al., Probing the ATIC peak in the cosmic-ray electron spectrum with H.E.S.S, arXiv:0905.0105.
- (4) J. Chang et. al., An excess of cosmic ray electrons at energies of 300.800 GeV, Nature 456 (2008) 362–365.
- (5) O. Adriani et. al., Observation of an anomalous positron abundance in the cosmic radiation, arXiv:0810.4995.
- (6) D. C. Ellison and S. P. Reynolds, Electron acceleration in a nonlinear shock model with applications to supernova remnants, Astrophys. J. 382 (1991) 242–254.
- (7) S. P. Reynolds and D. C. Ellison, Electron acceleration in Tycho’s and Kepler’s supernova remnants - Spectral evidence of Fermi shock acceleration, Astrophys. J. 399 (1992) L75–L78.
- (8) A. Achterberg, Y. A. Gallant, J. G. Kirk, and A. W. Guthmann, Particle acceleration by ultra-relativistic shocks: Theory and simulations, Mon. Not. Roy. Astron. Soc. 328 (2001) 393, [astro-ph/0107530].
- (9) T. Piran, The physics of gamma-ray bursts, Rev. Mod. Phys. 76 (2004) 1143–1210, [astro-ph/0405503].
- (10) M. S. Longair, High-energy astrophysics. Cambridge University Press, 1992.
- (11) A. W. Strong, I. V. Moskalenko, and V. S. Ptuskin, Cosmic-ray propagation and interactions in the Galaxy, Ann. Rev. Nucl. Part. Sci. 57 (2007) 285–327, [astro-ph/0701517].
- (12) Particle Data Group Collaboration, C. Amsler et. al., Review of particle physics, Phys. Lett. B667 (2008) 1.
- (13) FERMI-LAT Collaboration, D. Grasso et. al., On possible interpretations of the high energy electron-positron spectrum measured by the Fermi Large Area Telescope, arXiv:0905.0636.
- (14) M. Kuhlen and D. Malyshev, ATIC, PAMELA, HESS, Fermi and nearby Dark Matter subhalos, arXiv:0904.3378.
- (15) D. Hooper, A. Stebbins, and K. M. Zurek, The PAMELA and ATIC Excesses From a Nearby Clump of Neutralino Dark Matter, arXiv:0812.3202.
- (16) P. Brun, T. Delahaye, J. Diemand, S. Profumo, and P. Salati, The cosmic ray lepton puzzle in the light of cosmological N-body simulations, arXiv:0904.0812.
- (17) C.-R. Chen, K. Hamaguchi, M. M. Nojiri, F. Takahashi, and S. Torii, Dark Matter Model Selection and the ATIC/PPB-BETS anomaly, arXiv:0812.4200.
- (18) J. Mardon, Y. Nomura, D. Stolarski, and J. Thaler, Dark Matter Signals from Cascade Annihilations, arXiv:0901.2926.
- (19) P. Meade, M. Papucci, A. Strumia, and T. Volansky, Dark Matter Interpretations of the Electron/Positron Excesses after FERMI, arXiv:0905.0480.
- (20) L. Bergstrom, J. Edsjo, and G. Zaharijas, Dark matter interpretation of recent electron and positron data, arXiv:0905.0333.
- (21) O. Adriani et. al., A new measurement of the antiproton-to-proton flux ratio up to 100 GeV in the cosmic radiation, arXiv:0810.4994.
- (22) H.E.S.S. Collaboration, F. Aharonian et. al., Discovery of Very-High-Energy Gamma-Rays from the Galactic Centre Ridge, Nature 439 (2006) 695–698, [astro-ph/0603021].
- (23) H.E.S.S. Collaboration, F. Aharonian et. al., HESS observations of the galactic center region and their possible dark matter interpretation, Phys. Rev. Lett. 97 (2006) 221102, [astro-ph/0610509].
- (24) M. Kuhlen, J. Diemand, and P. Madau, The Dark Matter Annihilation Signal from Galactic Substructure: Predictions for GLAST, arXiv:0805.4416.
- (25) L. Bergstrom, T. Bringmann, and J. Edsjo, New Positron Spectral Features from Supersymmetric Dark Matter - a Way to Explain the PAMELA Data?, Phys. Rev. D77 (2008) 103520, [arXiv:0808.3725].
- (26) P. Grajek, G. Kane, D. Phalen, A. Pierce, and S. Watson, Is the PAMELA Positron Excess Winos?, arXiv:0812.4555.
- (27) P. Meade, M. Papucci, and T. Volansky, Dark Matter Sees The Light, arXiv:0901.2925.
- (28) D. Malyshev, I. Cholis, and J. Gelfand, Pulsars versus Dark Matter Interpretation of ATIC/PAMELA, arXiv:0903.1310.
- (29) J. Arons, Pulsars as Gamma-Rays Sources: Nebular Shocks and Magnetospheric Gaps, Space Sci. Rev. 75 (1996) 235–255.
- (30) T. Kobayashi, Y. Komori, K. Yoshida, and J. Nishimura, The most likely sources of high energy cosmic-ray electrons in supernova remnants, Astrophys. J. 601 (2004) 340–351, [astro-ph/0308470].
- (31) R. N. Manchester, G. B. Hobbs, A. Teoh, and M. Hobbs, The ATNF Pulsar Catalogue, astro-ph/0412641. http://www.atnf.csiro.au/research/pulsar/psrcat.
- (32) D. Hooper, P. Blasi, and P. D. Serpico, Pulsars as the Sources of High Energy Cosmic Ray Positrons, JCAP 0901 (2009) 025, [arXiv:0810.1527].
- (33) H. Yuksel, M. D. Kistler, and T. Stanev, TeV Gamma Rays from Geminga and the Origin of the GeV Positron Excess, arXiv:0810.2784.
- (34) S. Profumo, Dissecting Pamela (and ATIC) with Occam’s Razor: existing, well-known Pulsars naturally account for the ’anomalous’ Cosmic-Ray Electron and Positron Data, arXiv:0812.4457.
- (35) K. Ioka, A Gamma-Ray Burst/Pulsar for Cosmic-Ray Positrons with a Spectral Cutoff and Line, arXiv:0812.4851.
- (36) N. J. Shaviv, E. Nakar, and T. Piran, Natural explanation for the anomalous positron to electron ratio with supernova remnants as the sole cosmic ray source, arXiv:0902.0376.
- (37) N. Kawanaka, K. Ioka, and M. M. Nojiri, Cosmic-Ray Electron Excess from Pulsars is Spiky or Smooth?: Continuous and Multiple Electron/Positron injections, arXiv:0903.3782.