On the stellar content of the starburst galaxy IC1011affiliation: Based on observations collected with the ACS and the WFPC2 on board of the HST.
Abstract
We investigate the stellar content of the starburst dwarf galaxy IC10 using accurate and deep optical data collected with the Advanced Camera for Surveys and with the Wide Field Planetary Camera 2 on board the Hubble Space Telescope. The comparison between theory and observations indicates a clear change in age distribution when moving from the center toward the external regions. Moreover, empirical calibrators and evolutionary predictions suggest the presence of a spread in heavy element abundance of the order of one-half dex. The comparison between old and intermediate-age core He-burning models with a well defined overdensity in the color-magnitude diagram indicates the presence of both intermediate-age, red clump stars and of old, red horizontal branch stars.
Subject headings:
galaxies: individual (IC10) — galaxies: stellar content — Local Group — stars: evolution1. Introduction
Dwarf galaxies are ubiquitous stellar systems outnumbering giant systems in the Local Group (LG, Mateo 1998), in the Local Volume ( Mpc, Vaduvescu & McCall 2008), and in the nearby Universe (Popesso et al. 2006; Milne et al. 2007). Recent evidence indicates that the Local Group includes at least 62 dwarfs and among them % are dwarf irregulars (dIrrs, Grebel 2003; McConnachie et al. 2008). However, we still lack firm criteria discriminating between dIrrs and Blue Compact Galaxies (BCDs). According to Thuan (1985) and to van den Bergh (2000) the BCDs are dIrrs that are experiencing a significant burst of star formation. On the other hand, Richer & McCall (1995) found that the metal abundance of BCDs is more similar to dwarf spheroidals than to dIrrs, and Papaderos et al. (1996) pointed out the lack of an evolutionary link among BCDs, dIrrs and dwarf ellipticals (dEs). This key issue is far from being settled, and indeed in a recent detailed photometric and spectroscopic investigation Vaduvescu & McCall (2008) suggested that BCDs, dIrrs and dEs define the same fundamental plane.
Dwarf irregulars also play a key role in constraining the impact that structural parameters and intrinsic properties have on the evolution (initial mass function, star formation history) of complex systems (Massey et al. 2007). Moreover, they are fundamental laboratories for investigating the evolution of massive stars in systems that are undergoing significant bursts of star formation (Crowther 2007).
Among the nearby dIrrs IC10 is an interesting system, since it is one of the most massive (=8.49, Vaduvescu et al. 2007), and the comparison between the and the -band luminosity indicates that it is experiencing a starburst phase (Hunter et al. 1993). Moreover, it has been suggested that IC10 harbors a large number of young Wolf-Rayet stars (Massey & Holmes 2002) and intermediate-age carbon stars (Demers et al. 2004). However, we still lack detailed knowledge of the stellar content of IC10. In particular, Vacca et al. (2007), using deep optical and near-infrared data, proposed that the isochrone fit to IC10—at fixed distance and metal content—would require different reddening values for Main Sequence (MS) and Red Giant Branch (RGB) stars.
In a previous investigation (Sanna et al. 2008) we provided a new estimate of the distance modulus (=24.60 mag) based on a new calibration of the tip of the RGB, and of the reddening (E(-)=1.16 mag) based on empirical calibrators. Here we address the galaxy’s stellar content.
2. Results and discussion
The photometric catalog we adopt is based on archival optical images from the Advanced Camera for Surveys (ACS) and the Wide Field Planetary Camera 2 (WFPC2; see top panel of Fig. 1 and Sanna et al. 2008). The final catalog includes stars with at least one measurement in each of two different bands. The ACS data in the and bands were placed on the VEGAMAG system following Sirianni et al. (2005). The -band images collected with the ACS were transformed into the -band using local standards, and the same approach was adopted to transform the and the images collected with WFPC2 into the corresponding ACS bands. On average the star-to-star precision of the above transformations is better than 0.02 mag (Sanna et al. 2009, in preparation). The final catalog was split into two different regions: region C) covers the galaxy center and includes both ACS and WFPC2 data, while region E) lies at a radial distance greater than two arcminutes and only includes ACS data (see the blue and red polygons in the top panel of Fig. 1 and Sanna et al. 2008).

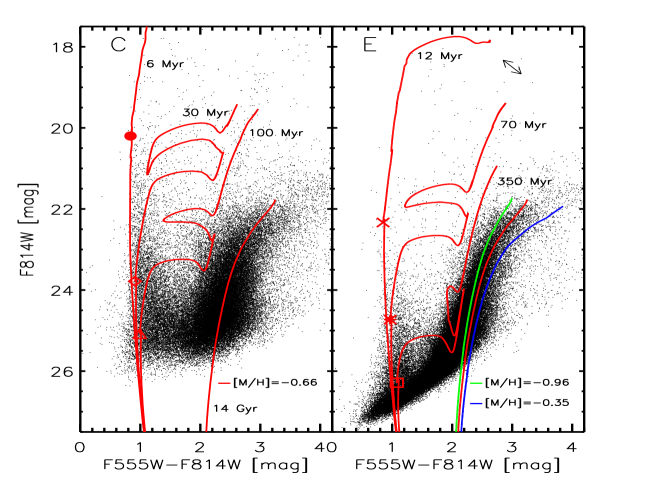
Spectroscopic estimates of IC10’s metallicity, based on HII regions, indicate a metal content (, Lee et al. 2003) similar to the Small Magellanic Cloud (SMC, , Zaritsky et al. 1994 also based on HII regions or , Romaniello et al. 2008, based on Cepheids). To characterize the stellar content of IC10 we adopted different sets of both scaled-solar (young and intermediate ages) and -enhanced (old ages) isochrones from the BaSTI database111http://www.oa-teramo.inaf.it/BASTI plus a few young isochrones specifically computed for this project. In particular, we adopted isochrones based on evolutionary tracks accounting for mass-loss (=0.4), neglecting both convective overshooting during the core H-burning phases and atomic diffusion (Pietrinferni et al. 2004, 2006). We have assumed a true distance modulus of =24.60 and a reddening E(-)=1.16 mag. Data plotted in the bottom left panel of Fig. 1 show that young scaled-solar isochrones (red lines) at fixed metal and helium content (=–0.66, =0.251) and ages ranging from 6 Myr ( 30.5) to 100 Myr ( 4.3) properly fit young MS stars in IC10. The same conclusion applies to the fit of RGB stars with the old -enhanced isochrone (t14 Gyr). Note that the global metallicity of this isochrone is =–0.66 with =–1.01 and 0.4 (Pietrinferni et al. 2006). The data plotted in the bottom panel of Fig. 1 were selected according to photometric error (= 0.1), separation ( 4) and sharpness (0.3). The separation index quantifies the degree of crowding (Stetson et al. 2003). The current value corresponds to stars that have required a correction of less than a few percent for light contributed by known neighbours. The sharpness index quantifies the similarity between the shape of the measured objects and of the Point-Spread-Function (PSF). It is the quadrature difference between the one-sigma-half-width of the measured object and the one-sigma-half-width of the core of the PSF (Stetson & Harris 1988). The bottom right panel of Fig. 1 shows that the CMD of the external regions is deeper, since these regions are less affected by crowding. The comparison with the central regions indicates a significant change in age distribution, and indeed, massive MS stars almost disappear when moving toward the external regions. The MS stars are well fit by isochrones with ages ranging from 12 Myr ( 14.2) to 350 Myr ( 2.5). These findings and the continuous stellar distribution along the MS indicate that IC10 experienced ongoing star formation during the last half Gyr. Fig. 1 also indicates that IC10’s stellar populations show a spread in metal content. The width in color of RGB stars is well fit by isochrones with a single age (14 Gyr) and metal contents ranging from (0.248, green line) to (0.256, blue line). The above comparison between theory and observations has to be considered as a preliminary guideline. These estimates of age and metal content are affected by empirical (distance modulus, reddening, photometric zero-points) and theoretical (mixing length, color-temperature relations) uncertainties. Firm constraints on these parameters require deep and accurate photometry down to the TO of the old population. Note that the possible presence of differential reddening amounting to 10% would not account for the observed spread in color (see the arrows in the right panel of Fig. 1 and Sanna et al. 2008). However, IC10 has an extended HI envelope, a large number of HII regions (Hidalgo-Gamez 2005) and molecular clouds (Leroy et al. 2006). This means that internal spatial variations of the reddening are quite probable. To partially overcome this problem, we adopted as representative of the IC10 stellar content the stars located in a small external region (E, see the red polygon in the top panel of Fig. 1).

To further characterize the stellar content of IC10 we also adopted empirical tracers. Fig. 2 shows the comparison between field E) of IC10 and the ACS photometry of an SMC field provided by Sabbi et al. (2007; red dots). Note that in this figure we plotted a number of IC10 stars, randomly selected, similar to the number of stars present in the SMC field. The SMC sample was plotted by assuming for the SMC a true distance modulus of and a reddening of mag. The ages of the main stellar components in this SMC field range from a few tens of Myr (bright MS) to a few Gyr (red clump, RC). To investigate the possible presence of an old stellar population we also compared IC10 to the globular cluster NGC 6362. The -band photometry (Stetson 2000) for this cluster was transformed into the ACS photometric system using the transformations by Sirianni et al. (2005). NGC 6362 is an almost metal-rich cluster (, -0.75, see Table 1) and its Horizontal Branch (HB) morphology is characterized by both red and blue stars (Brocato et al. 1999). Data plotted in this figure, in particular in the helium burning region (i.e., RC and red HB stars, 25.825.2, 1.72.1), indicate that IC10 hosts both intermediate-mass stars (RC) and candidate old low-mass (red HB) stars. To further constrain these key points Fig. 3 shows the comparison of the same field with three GCs with different metal contents (–0.47, 47 Tuc; –0.85, NGC 2808; –0.93, NGC 1851, see references listed in Table 1) and HB morphologies (only red HB stars, 47 Tuc; red, blue HB and RR Lyrae stars, NGC 1851; red, blue HB and extreme HB stars, NGC 2808). Note that in this figure we plotted a number of IC10 stars, randomly selected, similar to the number of stars present in the GC NGC 2808. Data in Fig. 3 further support the evidence (see Fig. 1) that RGs in IC10 cover at least one-half dex in metal content (–0.4–1). Moreover, a fraction of the stars located near 26 and 1.51.8 appear to be candidate RR Lyrae stars. Finally, we note that the comparison with empirical calibrators indicates that both metal-intermediate and metal-rich candidate RGB bump stars (see Table 1) should be systematically fainter than our current limiting magnitude at the color typical of RGB bump stars (2.1–2.2 mag, see the arrows in Fig. 3).

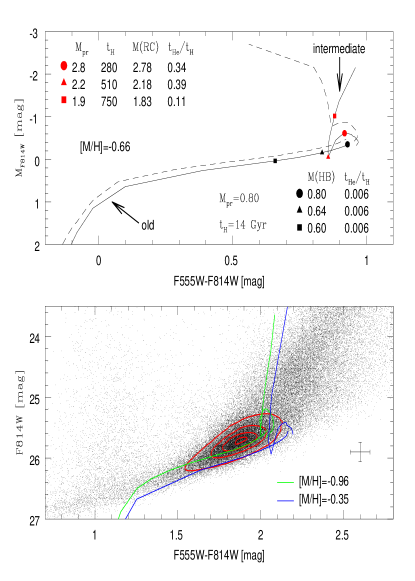
To investigate the properties of He-burning stars we adopted different sets of evolutionary models constructed assuming both old and intermediate-age progenitors. The top panel of Fig. 4 shows -enhanced Zero-Age-Horizontal-Branch (ZAHB, solid line) models together with the He-exhaustion locus (dashed, 10% of central He still available) at fixed metal and helium content (=–0.66, =0.251) for an old ( Gyr) progenitor (=0.80 ). To cover the age range of IC10 stars we also adopted core He-burning (solid) and He-exhaustion (dashed, 10% of He left) models for a set of intermediate-age (160 Myr 6.6 Gyr) progenitors (1.03.5 ). The evolutionary properties of He-burning, low-to-intermediate mass stars have been thoroughly investigated in the literature (Sweigart, Greggio & Renzini 1990; Castellani et al. 2000; Pietrinferni et al. 2004,2006; Bertelli et al. 2008). Here we note that the ratio between He- and H-burning lifetimes is quite constant (=0.006) when moving from =0.60 to 0.80 (old progenitor). On the other hand, the same ratio changes from =0.11 (=1.83) to 0.39 (=2.18) and to 0.34 (=2.78)222The use of He lifetimes at He-exhaustion, i.e., no He left in the core, changes the quoted ratios by a few thousandths and a few hundredths for old and intermediate-age progenitors, respectively. for scaled-solar, intermediate-mass progenitors (see top panel of Fig. 4). This stark difference is caused by the fact that when moving from 0.8 to 2.2 the core He-ignition takes place in structures that are less and less affected by electron degeneracy. This means that the He core mass at He-ignition, and in turn the luminosity during core He-burning, decreases from =0.485 (=0.80 , =–0.35 mag, 14 Gyr) to =0.467 (=2.2 , =–0.05 mag, =750 Myr). More massive structures are characterized by a convective core during H-burning phases and a further increase in stellar mass causes a steady increase in the He core mass and in luminosity (=2.80 , =0.370 , =–1.02 mag, =280 Myr). The above difference implies that the expected star count ratio between MS and He-burning structures increases by 1–2 orders of magnitude when moving from old to intermediate-mass stars.
Therefore, we decided to perform a more detailed comparison between theory and observations. We selected stars in the external regions using severe criteria (= 0.07 mag, 6, 0.2). Data plotted in the bottom panel of Fig. 4 show that the well defined overdensity centered on 25.72 and 1.90 agrees quite well with the expected position of old, red HB stars and of intermediate-age red clump stars. The solid lines display the ZAHBs for two different metal contents (=–0.96, 0.248; =–0.35, ) and for old and intermediate-age progenitors. The stellar masses and the ages of the progenitors are quite similar to the models plotted in the top panel. Note that the spread in magnitude and color of the He-burning region is larger than the typical photometric errors (see error bars). The range in color covered by the stellar overdensity is also systematically bluer and larger than the color range covered by typical low-mass RGB bump stars. The RGB bump in a metal-rich (47Tuc) and in a metal-intermediate (NGC 1851) globular cluster is, indeed, fainter and redder (see the arrows in Fig. 3). This comparison also supports the hypothesis that the stars with 26 and 1.7 are candidate RR Lyrae stars. Note that corrections for completeness of the current photometry would go in the direction of increasing the number of candidate old HB stars.
The photometric accuracy in the region around the peak does not allow us to distinguish RC from old HB stars. However the occurrence of warm HB stars, once confirmed by independent experiments, will provide a robust identification of the so-called Baade’s red sheet, i.e., evidence for an old stellar population (Baade 1963) in a starburst galaxy. Current circumstantial evidence is, indeed, based on intermediate-age (RC) He-burning stars (Aparicio et al. 1997; Schulte-Ladbeck et al. 1998). Moreover, the identification of massive MS stars, old (HB), and intermediate age (RC) helium burning stars indicates that IC10 underwent several star formation episodes during its life. A CMD a couple of magnitudes deeper and with a stronger temperature sensitivity could provide firm constraints on whether the star formation activity of this interesting system has been continuous or sporadic.
References
- (1) Aparicio, A., Gallart, C., Bertelli, G. 1997, AJ, 114, 669
- (2) Baade, W. 1963, in Evolution of Stars and Galaxies, ed. C. Payne-Gaposchkin, (Cambridge: Harvard University Press)
- (3) Bedin, L. R., Piotto, G., Zoccali, M., Stetson, P. B., Saviane, I., Cassisi, S., Bono, G. 2000, A&A, 363, 159
- (4) Bertelli, G., Girardi, L., Marigo, P., Nasi, E. 2008, A&A, 484, 815
- (5) Bono, G., Stetson, P. B., Sanna, N. et al. 2008, ApJL, 686, 87
- (6) Brocato, E., Castellani, V., Raimondo, G., Walker, A. R. 1999, ApJ, 57, 230
- (7) Carretta, E. 2006, AJ, 131, 1766
- (8) Carretta, E. & Gratton, R. G. 1997, A&AS, 121, 95
- (9) Castellani, V., degl’Innocenti, S., Girardi, L., Marconi, M., Prada Moroni, P. G., Weiss, A. 2000, A&A, 354, 150
- (10) Castellani, V., Iannicola, G., Bono, G., Zoccali, M., Cassisi, S., Buonanno, R. 2006, A&A, 446, 569
- (11) Crowther, P. A. 2007, ARA&A, 45, 177
- (12) Demers, S., Battinelli, P., Letarte, B. 2004, A&A, 424, 125
- (13) Gratton, R. G. 1987, A&A, 179, 181
- (14) Grebel, E. K., Gallagher, J. S., Harbeck, D. 2003, AJ, 125, 1926
- (15) Hidalgo-Gamez, A. M. 2005, A&A, 442, 443
- (16) Hunter, D. A., Hawley, W. N., Gallagher, J. S. 1993, AJ, 106, 1797
- (17) Koch, A. & McWilliam, A. 2008, AJ, 135, 1551
- (18) Lee, H., McCall, M. L., Kingsburgh, R. L., Ross, R., Stevenson, C. C. 2003, AJ, 125, 146
- (19) Leroy, A., Bolatto, A., Walter, F., Blitz, L. 2006, ApJ, 643, 825
- (20) Massey, P. & Holmes, S. 2002, ApJ, 580, 35
- (21) Massey, P., Olsen, K. A., Hodge, P. W., Jacoby, G. H., McNeil, R. T., Smith, R. C., Strong, S. B. 2007, AJ, 13, 2393
- (22) Mateo, M. 1998, ARA&A, 36, 435
- (23) McConnachie, A. W., Huxor, A., Martin, N. F. et al. 2008, ApJ, 688, 1009
- (24) Milne, M. L., Pritchet, C. J., Poole, G. B. et al. 2007, AJ, 133, 177
- (25) Papaderos, P., Loose, H. -H., Fricke, K. J., Thuan, T. X. 1996, A&AS, 120, 207
- (26) Pietrinferni, A. et al. 2004, ApJ, 612, 168
- (27) Pietrinferni, A. et al. 2006, ApJ, 642, 797
- (28) Popesso, P., Biviano, A., Boehringer, H., Romaniello, M. 2006, A&A, 445, 29
- (29) Richer, M. G., McCall, M. L. 1995, ApJ, 445, 642
- (30) Romaniello, M., Primas, F., Mottini, M., Pedicelli, S., Lemasle, B., Bono, G., Francois, P., Groenewegen, M. A. T., Laney, C. D. 2008, A&A, 488, 713
- (31) Rutledge, G. A., Hesser, J. E., Stetson, P. B. 1997, PASP, 109, 907
- (32) Sabbi, E., Sirianni, M., Nota, A., Tosi, M., Gallagher, J., Meixner, M., Oey, M. S., Walterbos, R., Pasquali, A., Smith, L. J., Angeretti, L. 2007, AJ, 133, 44
- (33) Salaris, M., Chieffi, A. & Straniero, O. 1993, ApJ, 414, 580
- (34) Salaris, M., Held, E. V., Ortolani, S., Gullieuszik, M., Momany, Y. 2007, A&A, 476, 243
- (35) Sanna, N., Bono, G., Stetson, P. B. et al. 2008, ApJ, 688, L69
- (36) Saviane, I., Piotto, G., Fagotto, F., Zaggia, S., Capaccioli, M., Aparicio, A. 1998, A&A, 333, 479
- (37) Schulte-Ladbeck, R. E., Crone, M. M., Hopp, U. 1998, ApJ, 493, 23
- (38) Sirianni, M. et al. 2005, PASP, 117, 1049
- (39) Stetson, P. B. 2000, PASP, 112, 925
- (40) Stetson, P. B., Bruntt, H., Grundahl, F. 2003, PASP, 115, 413
- (41) Stetson, P. B. & Harris, W. E. 1988, AJ, 96, 909
- (42) Sweigart, A. V., Greggio, L., Renzini, A. 1990, ApJ, 364, 527
- (43) Thuan, T. X. 1985, ApJ, 299, 881
- (44) Vacca, W. D.; Sheehy, C. D., Graham, J. R. 2007, ApJ, 662, 272
- (45) Vaduvescu, O., McCall, M. L. 2008, A&A, 487, 147
- (46) Vaduvescu, O., McCall, M. L., Richer, M., G. 2007, AJ, 134, 604
- (47) van den Bergh, S. 1999, A&ARv, 9, 273
- (48) Yong, D., Grundahl, F., D’Antona, F., Karakas, A. I., Lattanzio, J. C., Norris, J. C. 2009, ApJ, 695, 62
- (49) Zaritsky, D., Kennicutt, R. C., Jr., Huchra, J. 1994, ApJ, 420, 87
- (50) Zinn, R., West, M. J. 1984, ApJS, 55, 45
| ID | aaCluster true distance modulus (mag). | bbCluster reddening (mag). | eeGlobal metallicity based on spectroscopic iron abundances and assuming (Salaris et al. 1993). | RGB bumpffThe Johnson-Cousins magnitudes of the RGB bump provided by Di Cecco et al. (2009, in preparation) were transformed into the ACS -band (VEGAMAG) following Sirianni et al. (2005). | |||
|---|---|---|---|---|---|---|---|
| 47Tuc | ggBono et al. (2008). hSalaris et al. (2007). iKoch et al. (2008). jBrocato et al. (1999). kGratton (1987). lCastellani et al. (2006). mBedin et al. (2000). nCarretta (2006). oSaviane et al. (1998). pYong et al. (2009). | hhfootnotemark: | iifootnotemark: | ||||
| NGC6362 | jjfootnotemark: | jjfootnotemark: | kkfootnotemark: | ||||
| NGC2808 | llfootnotemark: | mmfootnotemark: | nnfootnotemark: | ||||
| NGC1851 | oofootnotemark: | oofootnotemark: | ppfootnotemark: |