Monitoring campaign of 1RXS J171824.2–402934,
the low-mass X-ray binary with the lowest mass accretion rate
An X-ray monitoring campaign with Chandra and Swift confirms that 1RXS J171824.2–402934 is accreting at the lowest rate among the known persistently accreting low-mass X-ray binaries. A thermonuclear X-ray burst was detected with the all-sky monitor on RXTE. This is only the second such burst seen in 1RXS J171824.2–402934 in more than 20 Ms of observations done over 19 years. The low burst recurrence rate is in line with the low accretion rate. The persistent nature and low accretion rate can be reconciled within accretion disk theory if the binary system is ultracompact. An unprecedentedly short orbital period of less than minutes would be implied. An ultracompact nature, together with the properties of the type I X-ray burst, suggests, in turn, that helium-rich material is accreted. Optical follow-up of the Chandra error region does not reveal an unambiguous counterpart.
Key Words.:
X-rays: binaries – X-rays: bursts – accretion, accretion disks – stars: neutron – X-rays: individual: 1RXS J171824.2–402934, RX J1718.440291 Introduction
1RXS J171824.2–402934, also known as RX J1718.44029 (and hereafter as J1718) is an exceptional low-mass X-ray binary (LMXB). The measured X-ray flux history of the source yields an inferred mass accretion rate that is the lowest among all persistently accreting LMXBs with a proven neutron star primary, by an order of magnitude (in ’t Zand et al. 2007).
J1718 was first detected in the ROSAT all-sky survey in 1990 (Voges et al. 1999) and re-observed in 1994. Optical follow up of the X-ray position failed to identify a counterpart (Motch 1994). In 2000, a thermonuclear X-ray burst was reported from observations with the BeppoSAX Wide Field Cameras (WFCs; Kaptein et al. 2000), establishing that the source is an LMXB with a neutron star accretor. The burst was relatively long in duration compared to typical bursts (i.e., longer than 3 min) and exhibited photospheric radius expansion, implying that the Eddington limit was reached during the peak of the burst. For a given Eddington luminosity and measured flux, one infers a source distance of 6.5 kpc or 9 kpc for a hydrogen-rich or poor photosphere, respectively (Kaptein et al. 2000; in ’t Zand et al. 2005).
A 15 ksec Chandra ACIS-S exposure taken in 2004 shows a 0.5–10 keV flux of 5 erg cm-2 s-1 corresponding to a luminosity of erg s-1 after correction for interstellar absorption (in ’t Zand et al. 2005). This is 0.03% of the Eddington limit, which is relatively low within the LMXB population. The latter fraction is independent of distance or Eddington limit value, because it is simply the flux normalized to the bolometric unabsorbed burst peak flux). The low flux is roughly two times fainter than during the ROSAT observations in 1990 and 1994, and is consistent with non-detections by other instruments such as the BeppoSAX-WFC. The X-ray absorption is fairly high with an equivalent hydrogen number column density of cm-2 while the continuum could be described by a power law with a photon index of . No modulation was detected in the Chandra-measured light curve with an upper limit to the amplitude of 10% (full bandpass) for periods between 10 and 5000 s.
The low luminosity points to a low mass accretion rate. This is supported by the fact that previously only a single burst was detected. The burst recurrence time is longer than 15 d (in ’t Zand et al. 2007), which is at least two orders of magnitude longer than the recurrence times measured for sources accreting at approximately 10% of Eddington (e.g., Galloway et al. 2008). The implied mass accretion rate (% of Eddington) is the lowest of all persistently accreting LMXBs. We define ’persistent’ here as accreting for longer than the typical (few-months) viscous time scale of the accretion disk. The apparent persistent nature in combination with the low luminosity suggests that J1718 is actually an ultracompact X-ray binary (in ’t Zand et al. 2007). Ultracompact X-ray binaries (UCXBs) are characterized by an orbital period shorter than 80 min, implying that the Roche lobe the donor star is so small that the donor must have lost all or most of its hydrogen (Nelson et al. 1986; Savonije et al. 1986). For the small accretion disk expected in such a binary it is probable that even a low-luminosity X-ray source would keep the disk entirely ionized and, therefore, the viscosity in the disk at a level sufficient to sustain accretion onto the compact object. This could allow the accretion disk instability to be avoided and the source to emit persistently instead of transiently (van Paradijs 1996).
No good-quality long-term light curve has been available for J1718, precluding the accurate determination of the long-term average of the flux. The source is too faint for current monitoring instruments and programs. Therefore, we carried out a highly sensitive monitoring program with Chandra and Swift. Furthermore, we performed optical follow up of the previously determined position of the X-ray source (in ’t Zand et al. 2005) to search for an optical counterpart. The results are the subject of this paper.
2 Observations
| ObsID | Date | Exposure | # | Off-axis |
| (sec) | photons | angle (′) | ||
| Chandra HRC-S | ||||
| 6571 | 2006-05-16 | 5166 | 366 | 0.3 |
| 6572 | 2007-01-28 | 5000 | 305 | 0.3 |
| Chandra ACIS-S | ||||
| 7464 | 2007-05-01 | 2423 | 537 | 0.3 |
| 7465 | 2007-10-02 | 2517 | 613 | 0.3 |
| Swift XRT | ||||
| 35716001 | 2006-09-25 | 2493 | 136 | 2.181 |
| 35716002 | 2007-01-28 | 3210 | 166 | 0.465 |
| 90056001 | 2008-04-02 | 3320 | 541 | 0.852 |
| 90056002 | 2008-04-09 | 2926 | 569 | 0.543 |
| 90056003 | 2008-04-16 | 2061 | 261 | 0.754 |
| 90056004 | 2008-04-23 | 1548 | 272 | 1.118 |
| 90056005 | 2008-04-30 | 1603 | 186 | 1.183 |
| 90056006 | 2008-05-07 | 2058 | 166 | 2.518 |
| 90056007 | 2008-05-14 | 2267 | 104 | 1.411 |
| 90056008 | 2008-05-26 | 1432 | 64 | 2.394 |
| 90056009 | 2008-05-28 | 2137 | 54 | 1.257 |
| 90056010 | 2008-06-04 | 678 | 19 | 2.438 |
| 90056011 | 2008-06-07 | 466 | 17 | 3.968 |
| 90056012 | 2008-06-11 | 1892 | 73 | 0.491 |
| 90056013 | 2008-06-14 | 1420 | 47 | 2.180 |
| 90056014 | 2008-06-21 | 2129 | 62 | 2.939 |
| 90056015 | 2008-06-25 | 2380 | 79 | 1.904 |
| 90056016 | 2008-06-28 | 1672 | 85 | 3.330 |
| 90056017 | 2008-07-02 | 2055 | 104 | 2.995 |
| 90056018 | 2008-07-05 | 2061 | 122 | 1.087 |
| 90056019 | 2008-07-09 | 1339 | 46 | 2.069 |
| 90056020 | 2008-07-12 | 1905 | 72 | 0.771 |
| 90056021 | 2008-07-19 | 2371 | 107 | 2.488 |
| 90056022 | 2008-07-23 | 2096 | 81 | 2.888 |
| 90056023 | 2008-07-26 | 2273 | 102 | 2.339 |
| 90056024 | 2008-07-30 | 1981 | 71 | 2.764 |
| 90056025 | 2008-08-02 | 2441 | 126 | 1.996 |
| 90056026 | 2008-08-06 | 1992 | 64 | 2.271 |
| 90056027 | 2008-08-13 | 2286 | 98 | 1.846 |
| 90056028 | 2008-08-20 | 2224 | 83 | 1.781 |
| 90056029 | 2008-08-27 | 2159 | 113 | 2.305 |
| 90056030 | 2008-09-03 | 3282 | 129 | 2.163 |
| 90056031 | 2008-09-10 | 1816 | 69 | 3.620 |
| 90056032 | 2008-09-17 | 2043 | 92 | 3.889 |
| 90056033 | 2008-09-24 | 2183 | 103 | 2.884 |
| 90056034 | 2008-10-01 | 1008 | 50 | 2.815 |
| 90056035 | 2008-10-08 | 2245 | 104 | 1.122 |
| 90056036 | 2008-10-15 | 816 | 17 | 3.246 |
| 90056037 | 2008-10-21 | 1680 | 63 | 4.714 |
| 90056038 | 2008-10-29 | 522 | 22 | 4.087 |
| 90056039 | 2009-01-28 | 2208 | 145 | 2.072 |
| 35716003 | 2009-01-30 | 3189 | 96 | 1.346 |
| 90056040 | 2009-02-04 | 2125 | 136 | 1.870 |
| 90056041 | 2009-02-11 | 2320 | 86 | 0.233 |
| 90056042 | 2009-02-25 | 1633 | 90 | 1.963 |
| 90056043 | 2009-03-04 | 1783 | 114 | 0.830 |
| 90056044 | 2009-03-11 | 1845 | 64 | 1.271 |
| 90056045 | 2009-03-25 | 2317 | 132 | 1.348 |
Chandra observations were obtained on four occasions during 2006 and 2007. Later, the source was observed with Swift once a week over the course of a year (between April 2008 and April 2009), except for a period of 3 months when observations were done twice a week. The observation log is presented in Table 1.
Of the 4 Chandra observations, two were done with ACIS-S (Garmire et al. 2003) and two with HRC-S (Zombeck et al. 1995; Murray et al. 1998). ACIS-S was employed for spectral resolution and HRC-S for time resolution. The two Chandra ACIS-S observations were carried out in the Timed Exposure mode with ACIS CCDs S1-S4 on, with the aimpoint on the back-illuminated S3 chip. We selected a 128-rows sub-array starting at row 449. The resulting time resolution is 0.741 s. The spectral resolution is roughly 5% (FWHM). The detector resolution is while the mirror point-spread function (PSF) has a half-power density radius of 05 for off-axis angles smaller than 15. The HRC-S multi-channel-plate detector was chosen for two Chandra observations to obtain the best time resolution ( s0.153 s) at the expense of nearly all energy resolution. The detector pixel size is in a field of view.
The Swift-XRT observations were all carried out in Photon Counting mode. This preserves the full imaging resolution ( over a field of view with a half-power diameter of the PSF of 18-22″) while the time resolution is 2.5 s. The total exposure time obtained with Swift-BAT (15-150 keV) up to April 3, 2009, is 11.4 Msec 111http://swift.gsfc.nasa.gov/docs/swift/results/transients/. Not a single detection was obtained in these observations, in daily or orbital exposures.
J1718 is monitored by the All-Sky Monitor (ASM) on RXTE. This instrument consists of three Shadow Scanning Cameras (SSCs), sensitive between 1.5 and 12 keV, that dwell at a certain position on the sky for 90 s after which they rotate slightly to a neighboring position and dwell there for 90 s (Levine et al. 1996). Up to March 26, 2009, the ASM carried out 37470 dwells with J1718 in the field of view of at least one SSC. The total exposure time of these dwells amounts to about 3.4 Msec. The 3 detection threshold is about 300 mCrab per dwell which translates to erg cm-2 s-1 (2-10 keV). J1718 was detected in two dwells, see Sect. 3.3. No other X-ray ¡instrument was observing J1718 at the time of these dwells.
The total exposure time obtained with BeppoSAX-WFC (2-28 keV) is 7.20 Msec. These data reveal the detection of one burst (Kaptein et al. 2000) while any non-burst emission is below the detection threshold.
There is no mention of any detection of J1718 with INTEGRAL, for instance in the most recent IBIS catalog (Bird et al. 2007) nor in data that are available online222http://isdc.unige.ch/index.cgi?Data+sources, http://isdc.unige.ch/Science/BULGE/. We estimate that the source was in the ISGRI field of view for 5870 science windows which would translate to approximately 12 Msec up to October 24, 2006.
J1718 is covered by the semi-weekly Galactic bulge scan program performed with the RXTE-PCA (Swank & Markwardt 2001; Markwardt 2006). Between mid 2004 and March 31, 2009, 347 scans were performed, yielding 10.4 ks exposure time. The source was never detected above a detection threshold of erg cm-2 s-1 (2-10 keV).
J1718 was observed in the optical with the Inamori-Magellan Areal Camera and Spectrograph (IMACS) on the 6.5 m Magellan-Baade telescope on July 7, 2005, under photometric conditions with seeing. Of the eight 4k2k detectors we only analyzed the detector containing the X-ray source position. Observations were obtained with binning, giving a pixel scale of pix-1. Two 5 min images in the -band were obtained, as well as two shorter images of 2 and 10 sec exposure times. The standard field SA 110 (Landolt 1992) was observed for photometric calibration. All images were corrected for bias and flat-fielded using domeflats according to standard methods.

3 Data analysis
3.1 Chandra
We employed ciao version 4.1.1 for our analysis. For the ACIS-S observations, source photons were extracted from a circular region with a radius of resulting in the numbers of photons listed in Table 1. For the background region photons were extracted in an annulus centered on the source position with an inner radius of and an outer radius of . The spectra and response files were extracted with the standard ciao analysis threads for a CCD temperature of 120 oC and the spectral bins were grouped so that each bin contains at least 15 photons to ensure applicability of the statistic. The spectra between 1 and 8 keV are satisfactorily modeled by an absorbed power law, with the hydrogen column density fixed to the value cm-2 found by in ’t Zand et al. (2005). The power law photon index is (1 error) for ObsID 7464 and for ObsID 7465 ( and 0.83, respectively, with and 33). The unabsorbed 0.5-10 keV power law flux is and erg cm-2 s-1, respectively. We note that the effect of pile up is smaller than the statistical uncertainty for a CCD readout time of 0.741 s and a photon rate at the PSF peak of 0.05 s-1.
For the HRC-S observations we employed a source extraction radius of . There are no adequate response data available for the HRC because of its extremely limited spectral resolution. Therefore, we refrain from a spectral analysis and merely use webpimms to calculate 0.5-10 keV fluxes based on the absorbed power-law spectrum measured with ACIS-S. The flux results from both HRC and ACIS-S are given in Fig. 1. While the HRC data have fine time resolution, we find no periodicity in the data. The upper limit on the amplitude of a sinusoidal variation is approximately 20% between 1 mHz and 1 KHz.
3.2 Swift
We exploited the ’cleaned’ event files as supplied by the Swift archive. Cleaning here refers to, for example, accounting for bad pixels, coordinate transformations, reconstruction of events, computation of energy channel values, elimination of partially exposed pixels and filtering out times of bad attitude data. All events of grades 0 to and including 12 were included in the analysis (the grade refers to the configuration of pixel values per event). After examining each observation image, we found that a circular region of radius 198 encompasses most source photons. Formally, this size is equal to that containing the half-power density of the PSF. Exposure maps were constructed with xrtexpomap, to allow for a correction for bad CCD pixels. The effective area was calculated with xrtmkarf.
For the Swift-XRT PSF and the readout time of 2.5 s in PC mode, pile-up losses exceed the 5% level for point source photon counting rates of 0.32 s-1 (Vaughan et al. 2006). The peak rate observed for J1718 is 0.2 s-1 implying a pile-up loss of 3 to 4%. This is similar to the statistical uncertainty. For 45 out of 48 observations the photon rate is less than 0.06 s-1 implying pile-up losses of less than 1%, compared to statistical errors of about 10%. A rough limit for pile-up effects to become important in spectral analyses of XRT data in PC mode is 0.6 c s-1 (Godet et al. 2009). Thus, we neglect pile up.
We extracted spectra for each observation and constructed response matrices. Subsequently, we satisfactorily modeled the data with an absorbed power law function. First, we modeled the high flux data and low-flux data separately (ObsIDs 90056001-6 and the remainder respectively), tying to a single value for both spectra. We find cm-2, a photon index of and for the high and low-flux state, respectively with for . is consistent with the value found by in ’t Zand et al. (2005) ( cm-2). Fitting a single value of to both spectra jointly results in for . The F-test yields a chance probability to obtain such a change in by chance of , indicating that the photon index indeed changes between the high and low state. Next, we modeled each observation separately. For the low-state data we allowed only the power law normalization to float freely. For the high state data the photon index was also allowed to float freely. The resulting 0.5-10 keV absorbed fluxes are shown in Fig. 1. These translate to an unabsorbed 0.5-10 keV flux range of 0.4 to 3.5 erg cm-2 s-1.
3.3 RXTE-ASM

A burst was detected with the RXTE-ASM on March 13, 2009, at 20:55 UT (MJD 54903.872). Figure 2 shows the photon flux measurements of J1718 per ASM dwell in the full bandpass (1.5-12 keV). The source is bright in two consecutive dwells of SSC2 (SSCs being numbered 1 through 3). Each dwell encompasses an exposure of 89 s and the gap between the two dwells is 7 s. J1718 was not detected in the closest prior dwell to the burst, 6.7 h earlier, nor in the dwell which follows the burst, 18.5 h later. We note that there was a PCA slew over J1718 as part of the Galactic Bulge scan program (see Sect. 2) 1.68 h before the burst. The source was not detected above a detection threshold of erg cm-2 s-1 (2-10 keV).
The middle panel of Fig. 2 shows the spectral hardness ratio defined as the ratio of the photon flux in the 5-12 keV band to that in the 1.5-5 keV band (formally, the ratio of ASM channel 3 to channels 1+2). If we model the hardness ratio by absorbed black body radiation (for a detailed example of a spectral ASM analysis, see Keek et al. 2008) with cm-2 (see above), then the two measurements imply temperatures of k and keV. This cooling is what is expected from a thermonuclear X-ray burst.
If one assumes that the decay from the first to the second dwell is exponential, the implied e-folding decay time in the full bandpass is s. Extrapolating the exponential decay backwards, a flux level equal to that of the peak of the WFC-detected burst (Kaptein et al. 2000) is reached s prior to the start of the first high dwell (the photon flux in the peak ASM dwell is a factor of 1.9 lower than the peak WFC flux). Assuming a similar behavior, the burst probably started between that time and one minute earlier since the WFC burst started with a 1-min long flat phase at the peak flux.
The total count rate detected in SSC2 during the first dwell (bottom panel of Fig. 2) does not show a clear decay. Comparing the total rates in the two halves of this dwell, they differ by an insignificant 2.3. The exponential decay expected from the burst in this first dwell (dashed curve) is not clearly detected, but it is consistent with the data ( for ).
Given the peculiarity of the source and the lack of an observation simultaneous to the first X-ray burst sensitive enough to detect the persistent emission, one might question whether the ROSAT source is really the origin of the X-ray burst. The burst might have occurred from a nearby transient source. However, we argue against that interpretation for the following reasons. First, no other bright source was ever detected within the 09-radius error region of the first burst, even including the highest spatial resolution and highly sensitive Chandra observations (the deepest detection threshold is provided by the 2004 Chandra observation and has a value of erg cm-2 s-1 in 0.5-10 keV). Second, there is a sensitive imaging measurement only 2.15 d before the second burst with Swift (ObsID 90056044) and it does not show any other bright source within 100. We believe these two findings enforce the association between the bursts and J1718. The thermonuclear nature of the first burst identifies the accretor as a neutron star and the binary as a LMXB. One possible alternative explanation, an X-ray flash (Heise & in’t Zand 2006), is much less likely because X-ray flashes do not exhibit thermal spectra, nor do they repeat.
3.4 Optical
Astrometric standards from the 2nd version of the USNO CCD Astrograph Catalog (Zacharias et al. 2004) were matched against stars on the 2 sec -band image. Of the 21 stars overlapping with the image, three are saturated. The remaining stars yield an astrometric solution with rms residuals of in right ascension and in declination. This calibration was transferred to the average of the two 5 min exposures using some 650 secondary standards determined from the 2 sec image. This gives rms residuals of in both right ascension and declination.
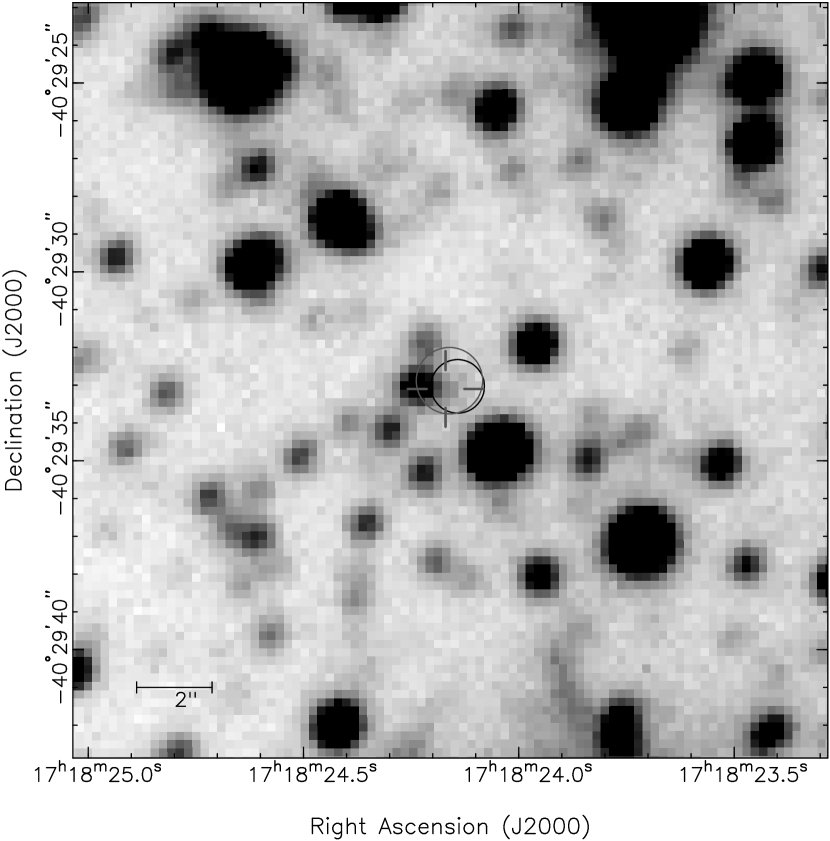
From the positions of X-ray sources detected with the ACIS S3 chip in 2004 by the wavdetect algorithm (in ’t Zand et al. 2005), we find that the 5th brightest X-ray source (14 counts) coincides with a bright star (2UCAC 14672492). Based on the UCAC2 position of this star, the boresight of the X-ray frame needs to be corrected by and . Though the boresight correction is not significant by itself, we show in Fig. 3 both the corrected error circle and the uncorrected error circle. The boresight-corrected error circle has a 95% confidence radius of . The uncorrected error circle, assuming a uncertainty in the boresight (90% confidence, Aldcroft et al. 2000), has a radius of (95% confidence). Both error circles contain a single star located at and . The probability that a physically unrelated star could appear by chance in the 071-radius Chandra error circle is 16%, which is relatively high).
Instrumental magnitudes were determined from the 10 sec image and the average of the two 5 min images through PSF fitting using DAOphot II (Stetson 1987). These instrumental magnitudes were calibrated against 19 photometric standards from the SA 110 standard field, using calibrated magnitudes from Stetson (2000). Only a zero-point was fitted, since no color information is provided by the present single filter observations. The rms residual on the zeropoint was 0.1 mag. In the absence of extinction coefficients, no correction for the difference in airmass was made. We note, though, that the difference in airmass between the standard and science field is only 0.12 airmass, and that a typical -band extinction coefficient of 0.1 mag airmass-1 would lead to a change in the zeropoint of only 0.01 mag. An aperture correction was determined from isolated bright stars in the 10 s -band image, and the photometric calibration was then transferred to the average of the two 5 min images. Finally, we compared our calibrated -band magnitudes with Gunn -band magnitudes of some 700 stars from the DENIS333http://cdsweb.u-strasbg.fr/denis.html catalog, and found an offset in magnitude of only mag. We note that the detection threshold of the image is at unconfused locations.
The star located inside both error circles has , taking into account the mag uncertainty in the zeropoint. For the hydrogen column density of cm-2, the model by Predehl & Schmitt (1995) predicts or (using the extinction coefficients by Schlegel et al. 1998). For the distance of 9 kpc, the absolute magnitude of the star is .
4 Discussion
We find that J1718 appears to be persistently active for at least 19 years. The unabsorbed flux level in the 0.5 to 10 keV band was never measured to be above erg cm-2 s-1. The average unabsorbed flux is erg cm-2 s-1which translates to an average luminosity of (d/9 kpc)2 erg s-1. Assuming a bolometric correction of a factor of 2 (e.g., in ’t Zand et al. 2007), the ratio of the luminosity to the Eddington limit is . This confirms the unique status of this object. Assuming a radiation efficiency between 10 and 100%, the accretion rate is between 0.04 and 0.4% of the Eddington limit. J1718 is the persistent LMXB with the lowest mass accretion rate currently known.
The detection of a second burst from J1718 provides a handle on the recurrence time and accretion rate. If we combine the exposure times of all most relevant instruments that have been or are sensitive to X-ray bursts from J1718 (7.2 Msec with BeppoSAX/WFC, 3.4 Msec with RXTE/ASM, 1 Msec with INTEGRAL/JEM-X, and 10 Msec with HETE-II/WXM), the average wait time between bursts is d. For a pure helium burst, , where is the ratio of the gravitational energy released per nucleon (195 MeV for a canonical NS) to the nuclear energy released (1.6 MeV per nucleon for helium burning; see review by Lewin et al. 1993). For a burst energy of erg, the rate of the released gravitational energy is erg s-1. This is consistent with the measured average bolometric luminosity we report above. The measurements translate to a radiation efficiency between 30% and 100%, or an inclination angle between 0 and 73o (if the apparent luminosity decreases by a projection factor perpendicular to the line of sight of cos).
From the persistent nature and low luminosity it is possible to obtain a constraint on using accretion disk theory. van Paradijs (1996) defines a threshold for the accretion luminosity as a function of above which the accretion process is likely to be persistent (see also Sect. 1): log( (for neutron star accretors). According to this relationship, J1718 should have a period hr. However, that relationship has been refined by Lasota et al. (2008) and previous to that by Deloye & Bildsten (2003) to log( for a solar-composition disk and log( for a pure helium disk. Lasota et al. express these relationships in terms of mass accretion rate which we translate to luminosity assuming a gravitational energy release per nucleon of 195 MeV, a 100% radiation efficiency and a mass ratio between the donor and accretor . The threshold luminosities in these refined expressions are up to 2 orders of magnitude higher for hr. The luminosity derived from the burst energetics of erg s-1 is consistent with a persistently accreting helium disk only if is smaller than 6 min (1 confidence), or 7 min (2 confidence). For a carbon-oxygen-rich disk, this limit would be even more extreme because of higher ionization potentials of these atoms (Lasota et al. 2008; Menou et al. 2002). For a hydrogen disk would be smaller than min, which is impossible because a hydrogen dwarf would not fit within such an orbit (e.g., Nelson et al. 1986; Nelemans 2008). The luminosity derived from the average flux yields an even more extreme limit. The 6-7 min upper limit is shorter than the 11 min for the present low record holder 4U 1820-30 (Stella et al. 1987). However, a word of caution is appropriate. Lasota et al. (2008) point out that three UCXBs do not adhere to the above thresholds (4U 1850-087, M15 X-2 and 4U 1916-05) and consider small amounts of hydrogen in the donor atmosphere as the most likely explanation. That explanation meets another challenge though: the 20 min orbital periods for 4U 1850-087 (Homer et al. 1996) and M15 X-2 (Dieball et al. 2005) preclude the presence of any hydrogen (Nelson et al. 1986).
If the mass transfer rate is governed by angular momentum losses due to gravitation radiation, the low rate of M⊙ yr-1 suggests a donor mass less than 0.03 M⊙ for an orbital period of less than 1 hr and a NS mass of 1.4 M⊙, which points to a hydrogen-poor white dwarf donor star (Verbunt 1993). If the burst is fueled by helium, the donor probably is a white dwarf with a helium-rich atmosphere which would imply that the binary came into contact after the donor left the main sequence (e.g., in ’t Zand et al. 2005).
Measurement of the brightness of an optical counterpart can aid the confirmation or rejection of an ultracompact binary hypothesis. van Paradijs & McClintock (1994) determine the relation between the absolute visual magnitude , the accretion rate in terms of the Eddington limit and the orbital period for actively accreting LMXBs. They find log(. The calibration of this relation includes UCXBs. The contribution of donor stars in UCXBs to the optical flux is expected to be negligible since white dwarfs are thought to have absolute visual magnitudes fainter than about 8 (e.g., Bergeron et al. 1995). Assuming a blue B0-A0 stellar spectrum for the active accretion disk (van Paradijs & McClintock 1995), and translate to log(. This is inconsistent with the source being a UCXB. Therefore, and because of the high probability (16%) of chance alignment of an optical source with the X-ray source, the case for this star being the optical counterpart is not strong. The unconfused detection threshold is, for the same and distance as J1718, equivalent to . At the location of J1718 the detection threshold is higher because there is a bright star immediately next to the error region. For and hr, one expects . For the assumed spectral shape for B0-A0, . This is below the detection threshold. Therefore, better seeing and deeper imaging are likely to be required to detect the optical counterpart. One would at least have to obtain images with limiting magnitudes of to search for the counterpart. A spectrum of the current candidate counterpart could be useful to verify that it is not the spectrum of an accretion disk. For instance, if the star is a cool main sequence star, the Ca II triplet near 8500Å is by far the strongest feature in the red/near-IR spectrum (Munari 2002).
J1718 is associated with the class of ’Burst-Only Sources’ (Cocchi et al. 2001; Cornelisse et al. 2002; in ’t Zand et al. 2005) or ’Very Faint X-ray Transients’ (’VFXT’; Muno et al. 2005; Wijnands et al. 2006; Degenaar & Wijnands 2009). King & Wijnands (2006) suggest that these transients either have hydrogen-poor donors, were born with very low companion masses, or evolve more quickly than standard theory predicts. A VFXT particularly similar to J1718 is XMMU J174716.1-281048 (e.g., Sidoli & Mereghetti 2003; Del Santo et al. 2007a, b): since 2003, it has been seen at the faint level of erg cm-2 s-1 (2-10 keV). Before that it was quiescent as shown by several XMM-Newton and Chandra observations). A long X-ray burst was detected (Brandt et al. 2006) and the persistent spectrum is a power law with a photon index of 2.1 (Del Santo et al. 2007b). There may be more (quasi) persistent X-ray sources that are similar in nature to J1718 but have not exhibited an X-ray burst yet (remember that only two bursts were seen in J1718 in the course of 19 years despite more than 20 Msec of monitoring observations, see § 2). Possible examples are 4U 1543-624 and 4U 1556-605 (Farinelli et al. 2003). The similarity to VFXTs and other unidentified persistent sources illustrates that sources like J1718 may be rather common. This has not been fully appreciated yet, because it is difficult to catch the rare and brief X-ray bursts. Operation of surveying X-ray programs and all-sky X-ray monitors is crucial in advancing our understanding of these objects.
5 Conclusion
We confirm the LMXB nature of J1718 through the detection of a second X-ray burst in the absence of any other bright source in the neighborhood. In addition, we have determined an accurate value for the long-term average flux of J1718. This value translates to the lowest luminosity known for a persistently accreting LMXB. This luminosity is consistent with accretion disk theory if the orbital period is less than about 7 min. We find a candidate optical counterpart that is too bright for a UCXB. A spectral study of this counterpart is needed to check whether it is consistent with an UCXB, or deep optical images, reaching at least , obtained under seeing conditions better than 075, to search for a weaker nearby counterpart.
Acknowledgements.
We thank the anonymous referee for making excellent suggestions for improving the paper.References
- Aldcroft et al. (2000) Aldcroft, T. L., Karovska, M., Cresitello-Dittmar, M. L., Cameron, R. A., & Markevitch, M. L. 2000, in Proc. SPIE Vol. 4012, p. 650-657, X-Ray Optics, Instruments, and Missions III, Joachim E. Truemper; Bernd Aschenbach; Eds., ed. J. E. Truemper & B. Aschenbach, 650–657
- Bergeron et al. (1995) Bergeron, P., Wesemael, F., & Beauchamp, A. 1995, PASP, 107, 1047
- Bird et al. (2007) Bird, A. J., Malizia, A., Bazzano, A., et al. 2007, ApJS, 170, 175
- Brandt et al. (2006) Brandt, S., Budtz-Jørgensen, C., Chenevez, J., et al. 2006, The Astronomer’s Telegram, 970, 1
- Cocchi et al. (2001) Cocchi, M., Bazzano, A., Natalucci, L., et al. 2001, A&A, 378, L37
- Cornelisse et al. (2002) Cornelisse, R., Kuulkers, E., in ’t Zand, J. J. M., Verbunt, F., & Heise, J. 2002, A&A, 382, 174
- Degenaar & Wijnands (2009) Degenaar, N. & Wijnands, R. 2009, A&A, 495, 547
- Del Santo et al. (2007a) Del Santo, M., Chenevez, J., Brandt, S., Bazzano, A., & Ubertini, P. 2007a, The Astronomer’s Telegram, 1207, 1
- Del Santo et al. (2007b) Del Santo, M., Sidoli, L., Mereghetti, S., et al. 2007b, A&A, 468, L17
- Deloye & Bildsten (2003) Deloye, C. J. & Bildsten, L. 2003, ApJ, 598, 1217
- Dieball et al. (2005) Dieball, A., Knigge, C., Zurek, D. R., et al. 2005, ApJ, 634, L105
- Farinelli et al. (2003) Farinelli, R., Frontera, F., Masetti, N., et al. 2003, A&A, 402, 1021
- Galloway et al. (2008) Galloway, D. K., Muno, M. P., Hartman, J. M., Psaltis, D., & Chakrabarty, D. 2008, ApJS, 179, 360
- Garmire et al. (2003) Garmire, G. P., Bautz, M. W., Ford, P. G., Nousek, J. A., & Ricker, Jr., G. R. 2003, in Society of Photo-Optical Instrumentation Engineers (SPIE) Conference Series, Vol. 4851, Society of Photo-Optical Instrumentation Engineers (SPIE) Conference Series, ed. J. E. Truemper & H. D. Tananbaum, 28–44
- Godet et al. (2009) Godet, O., Beardmore, A. P., Abbey, A. F., et al. 2009, A&A, 494, 775
- Heise & in’t Zand (2006) Heise, J. & in’t Zand, J. 2006, in Compact stellar X-ray sources, ed. W. H. G. Lewin & M. van der Klis, 267–278
- Homer et al. (1996) Homer, L., Charles, P., Naylor, T., et al. 1996, MNRAS, 282, L37
- in ’t Zand et al. (2005) in ’t Zand, J. J. M., Cornelisse, R., & Méndez, M. 2005, A&A, 440, 287
- in ’t Zand et al. (2007) in ’t Zand, J. J. M., Jonker, P. G., & Markwardt, C. B. 2007, A&A, 465, 953
- Kaptein et al. (2000) Kaptein, R. G., in ’t Zand, J. J. M., Kuulkers, E., et al. 2000, A&A, 358, L71
- Keek et al. (2008) Keek, L., in ’t Zand, J. J. M., Kuulkers, E., et al. 2008, A&A, 479, 177
- King & Wijnands (2006) King, A. R. & Wijnands, R. 2006, MNRAS, 366, L31
- Landolt (1992) Landolt, A. U. 1992, AJ, 104, 340
- Lasota et al. (2008) Lasota, J.-P., Dubus, G., & Kruk, K. 2008, A&A, 486, 523
- Levine et al. (1996) Levine, A. M., Bradt, H., Cui, W., et al. 1996, ApJ, 469, L33+
- Lewin et al. (1993) Lewin, W. H. G., van Paradijs, J., & Taam, R. E. 1993, Space Science Reviews, 62, 223
- Markwardt (2006) Markwardt, C. B. 2006, in American Institute of Physics Conference Series, Vol. 840, The Transient Milky Way: A Perspective for MIRAX, ed. F. D’Amico, J. Braga, & R. E. Rothschild, 45–49
- Menou et al. (2002) Menou, K., Perna, R., & Hernquist, L. 2002, ApJ, 564, L81
- Motch (1994) Motch, C. 1994, A&A, 284, 827
- Munari (2002) Munari, U. 2002, in EAS Publications Series, Vol. 2, EAS Publications Series, ed. O. Bienayme & C. Turon, 39–54
- Muno et al. (2005) Muno, M. P., Lu, J. R., Baganoff, F. K., et al. 2005, ApJ, 633, 228
- Murray et al. (1998) Murray, S. S., Chappell, J. H., Kenter, A. T., et al. 1998, in Society of Photo-Optical Instrumentation Engineers (SPIE) Conference Series, Vol. 3356, Society of Photo-Optical Instrumentation Engineers (SPIE) Conference Series, ed. P. Y. Bely & J. B. Breckinridge, 974–984
- Nelemans (2008) Nelemans, G. 2008, in Astronomical Society of the Pacific Conference Series, Vol. 391, Hydrogen-Deficient Stars, ed. A. Werner & T. Rauch, 273–+
- Nelson et al. (1986) Nelson, L. A., Rappaport, S. A., & Joss, P. C. 1986, ApJ, 304, 231
- Predehl & Schmitt (1995) Predehl, P. & Schmitt, J. 1995, A&A, 293, 889
- Schlegel et al. (1998) Schlegel, D. J., Finkbeiner, D. P., & Davis, M. 1998, ApJ, 500, 525
- Sidoli & Mereghetti (2003) Sidoli, L. & Mereghetti, S. 2003, The Astronomer’s Telegram, 147, 1
- Stella et al. (1987) Stella, L., Priedhorsky, W., & White, N. E. 1987, ApJ, 312, L17
- Stetson (1987) Stetson, P. B. 1987, PASP, 99, 191
- Stetson (2000) Stetson, P. B. 2000, PASP, 112, 925
- Swank & Markwardt (2001) Swank, J. & Markwardt, C. 2001, in Astronomical Society of the Pacific Conference Series, Vol. 251, New Century of X-ray Astronomy, ed. H. Inoue & H. Kunieda, 94–+
- van Paradijs (1996) van Paradijs, J. 1996, ApJ, 464, L139+
- van Paradijs & McClintock (1994) van Paradijs, J. & McClintock, J. E. 1994, A&A, 290, 133
- van Paradijs & McClintock (1995) van Paradijs, J. & McClintock, J. E. 1995, in X-ray binaries, p. 58 - 125, ed. W. H. G. Lewin, J. van Paradijs, & E. P. J. van den Heuvel, 58–125
- Vaughan et al. (2006) Vaughan, S., Goad, M. R., Beardmore, A. P., et al. 2006, ApJ, 638, 920
- Verbunt (1993) Verbunt, F. 1993, ARA&A, 31, 93
- Voges et al. (1999) Voges, W., Aschenbach, B., Boller, T., et al. 1999, A&A, 349, 389
- Wijnands et al. (2006) Wijnands, R., in ’t Zand, J. J. M., Rupen, M., et al. 2006, A&A, 449, 1117
- Zacharias et al. (2004) Zacharias, N., Urban, S. E., Zacharias, M. I., et al. 2004, AJ, 127, 3043
- Zombeck et al. (1995) Zombeck, M. V., Chappell, J. H., Kenter, A. T., et al. 1995, in Society of Photo-Optical Instrumentation Engineers (SPIE) Conference Series, Vol. 2518, Society of Photo-Optical Instrumentation Engineers (SPIE) Conference Series, ed. O. H. Siegmund & J. V. Vallerga, 96–106