Dynamical signature of a domain phase transition in a perpendicularly-magnetized ultrathin film
Abstract
Domain phases in ultrathin Fe/Ni/W(110) films with perpendicular anisotropy have been studied using the ac magnetic susceptibility. Dynamics on time scales of minutes to hours were probed by quenching the system from high temperature to the stripe phase region, and varying the constant rate of temperature increase as the susceptibility traces were measured. The entire susceptibility peak is observed to relax slowly along the temperature axis, with the peak temperature increasing as the rate of heating is decreased. This is precisely opposite to what would happen if this slow relaxation was driven by changes in the domain density within the stripe phase. The data are instead consistent with a simple model for the removal of a significant density of pattern defects and curvature trapped in the quench from high temperature. A quantitative analysis confirms that the relaxation dynamics are consistent with the mesoscopic rearrangement of domains required to remove pattern defects, and that the experiment constitutes a “dynamical” observation of the phase transition from a high temperature, positionally disordered domain phase to the low temperature, ordered stripe phase.
pacs:
75.70.-i, 75.30.Kz, 75.40.CxI Introduction
The study of domain pattern formation in two-dimensional systems with strong short-range attractive interactions and weak, long-range repulsive dipole interactions links disparate fields such as molecular membranes,sagui crystals exhibiting high temperature superconductivity,kivelson and ultrathin film magnetism.debell In all these cases, the phase diagram is influenced by the strong fluctuations in two dimensions, which lead to novel phases and phase transitions. The domain patterns of ultrathin ferromagnetic films with weak perpendicular anisotropy have been studied intensely because this system is amenable to precise experimental control. Even so, the predicted phases and phase transitions have proven difficult to observe because imaging techniques average over the fluctuations. The purpose of the present article is to report observations of the slow relaxation of domain patterns that have been quenched from high temperature, using the ac magnetic susceptibility. The relaxation is consistent with the resolution of pattern defects as the low temperature stripe phase is formed.
Ultrathin films possess a surface magnetic anisotropy that may favour the alignment of the magnetic moments normal to the surface. In this case, a demagnetization field can cancel much of the surface anisotropy, leaving a weak, temperature-dependent, residual perpendicular anisotropy. The resulting small domain wall energy permits magnetic domain patterns to form despite the weakness of the long-range dipole interaction. Numerous theoretical analysesyafet ; kashuba ; abanov ; politi and computer simulationsbooth ; macisaac ; stoycheva ; sampaio indicate that a “stripe” pattern is stable at low temperature. Great progress has been made in understanding this phase using magnetic microscopy techniques.allenspach ; speckmann ; won ; portmann ; saratz At higher temperature (lower anisotropy), fluctuations in the domain walls become important, and stripe domains may meander and “pinch off” to create pairs of dislocations. As the dislocations proliferate, theory predictskashuba ; abanov a Kosterlitz-Thouless transition to a domain phase that is characterized by pattern defects, domain segmentation, and the loss of long-range positional order. At even higher temperature, the loss of orientational order, and finally paramagnetism are predicted. As a group, these phases may be termed “positionally disordered” phases. Only a few experiments have produced magnetic images showing relevent defect structures.vaterlaus ; portmann2 Caution is required in interpreting these essentially static images of phases driven by fluctuations. For example, images showing a loss of domain contrast may indicate a transition to the paramagnetic state, or simply a dynamic effect that averages out the image contrast.
A complementary method to study the domain phases is through their dynamics. This offers access to a wide range of time scales where different relaxation processes are active, at the expense of a pictorial representation of the domain pattern. There are very few studies of the intrinsic dynamics of these magnetic systems. Early work concentrated on the relaxation from the magnetically saturated state.berger Work measuring the magnetic susceptibility studied the transition from the stripe phase to a “glassy” stripe phase due to pinning of the domain walls by structural defects.venus ; venus2 More recently, numerical simulations have suggested that the transitions between the various phases have distinctive dynamic signatures. Starting from a magnetically saturated initial state, simulations find very long equilibration times for the creation of the stripe phase, but much shorter equilibration times for the positionally disordered phase.bromley Simulations of quenching from a positionally disordered state indicate a discontinuous transition with long-lasting metastability before the stripe phase is established.cannas
The present article reports experimental studies of ultrathin Fe/Ni/W(110) films aimed at quantifying the dynamics of domain pattern relaxation across a range of time scales by altering the constant rate of temperature change, R, as the magnetic susceptibility is scanned. Following a controlled quenching from high temperature, the evolution of the susceptibility shows that the system as a whole slowly relaxes towards equilibrium through activated dynamics. It is then argued that this does not represent the relaxation of the stripe domain density (which occurs on a shorter time scale), but is rather due to the activation barriers for the mesoscopic domain wall rearrangements required for the removal of dislocations and defects as the quenched pattern moves toward a low temperature equilibrium stripe phase. This represent a “dynamical” observation of the transition from a positionally disordered phase to the equilibrium, stripe domain phase.
II Theory
The competition between the short range exchange interaction and the long range dipole interaction in a two dimensional magnetic system with perpendicular anisotropy leads to the spontaneous formation of magnetic domains. A detailed study of a two dimensional system of domain walls, in the presence of a substrate that induces preferred directions of domain wall alignment, has outlined the expected phase diagram of the domain phases.kashuba ; abanov ; politi At low temperature, the system forms positionally and orientationally ordered stripes (also termed the “smectic” phase) with a mean linear density
| (1) |
where is the domain wall width, is the domain wall energy per unit length, is a constant that sets the scale of the dipole energy, and is the number of monolayers in the thin film. The residual perpendicular anisotropy is reduced by spin fluctuations, so that the domain wall energy depends sensistively on temperature. This causes the domain density to increase exponentially with temperature.
When a magnetic field is applied perpendicular to the surface, the domains with moments parallel to the field grow at the expense of those with moments in the antiparallel direction, creating a net moment. In the stripe phase, where the bending of the domain walls is unfavourable, the equilibrium dc susceptibility is determined by the induced changes in domain wall spacing, and is directly related to the effective spring constant for stripe compression,abanov ; venus , where
| (2) |
is the film thickness. The phenomenological parameters and represent the zeroth and first order expansion of the exponential dependence of the domain density on temperature.
When an ac field is applied, the oscillating motion of the domain walls occurs through Barkhausen steps of microscopic lengths of domain wall between thermally activated pinning sites with time constantbruno
| (3) |
where is the pinning energy. Solution of a relaxation equation for the magnetization measured at angular frequency gives the ac susceptibility as
| (4) |
The susceptibility falls exponentially with temperature on either side of a maximum. At low temperature the domain wall motion is stopped by pinning, and at high temperature by the increasing magnetic stiffness of the domain walls as their density increases. This characteristic shape has been observed in many studies, and permits a quantitative study of the pinning mechanism.venus ; venus2 ; arnold
As the temperature is increased, fluctuations in the domain walls are favoured, and dislocations pairs are formed by segmentation of the stripe domains. According to the continuum model of Abanov et al.abanov , these dislocations proliferate at a Kosterlitz-Thouless transition to the “Ising nematic” domain phase that is characterized by unbound dislocations that destroy the long range positional order. This (or a related positionally and rotationally disordered phase) exists for a small temperature range as the exponentially decreasing domain width approaches and reaches a fundamental limit, given by the dipole length, or ratio of exchange and dipole energies.kashuba Near this fundamental limit, the shape of the domain wall is alteredvedmedenko ; vindigni and the width becomes equivalent to the domain width, so that the continuum model is no longer strictly valid. At even higher temperature, there is a transition to in-plane magnetism, or paramagnetism, depending upon the sample thickness.
Numerical simulations of a 2 dimensional layer of Ising spins are in agreement with many qualitative features of this descriptionbooth ; macisaac ; stoycheva ; sampaio , particularly in observing stable domain patterns with the properties of the ordered stripe phase and of disordered phases containing defects. More recently, simulations have been used to study the relaxation dynamics and domain phase transitions in Ising systems. For relaxation from a magnetically saturated state, to the stripe phase, Bromley et al.bromley find three distinct relaxation rates: i) for the formation of domain segments, ii) for the establishment of a symmetrical distribution of up and down domains giving no net magnetization, iii) for the alignment of the domains along a single stripe direction. Particularly the last step leads to a very long equilibration time. In contrast, the same study finds a much faster, single step relaxation to the positionally and rotationally disordered phase. In simulations of quenching the positionally disordered phase into the stripe phase region, Cannas et al.cannas found more complex transitions than are predicted by the continuum model. In particular, their simulations indicate a discontinuous transition between the stripe and nematic phases, rather than a Kosterlitz-Thouless transition. The discontinuous transition is accompanied by temperature hysteresis, and long lasting metastability of the disordered phase after quenching.
Both of these numerical studies of Ising systems suggest that these distinctive dynamic responses may permit an indirect observation of different domain phases in experimental systems with realistic domain wall widths. Measurements of the magnetic susceptibility should be sensitive to relaxation dynamics on a number of time scales, but it is not certain how the magnetic susceptibility of the stripe phase would differ from a system with substantial domain wall curvature and defects, such as the disordered domain phases. However, since the disordered phases retain short range order, and because the domain density is expected to increase with temperature irrespective of the phase, the ac susceptibility should continue to be described, at least qualitatively, by eq.(4). On the other hand, when domain wall fluctuations, curvature and dislocations become important and contribute to the elastic energy of the system, one should expect quantitative changes in the effective spring constant , and therefore in the susceptibility.
III Experimental results
Films of 1.5 ML Fe/2.0 ML Ni/W(110) were grown in ultrahigh vacuum and studied in situ. The growth procedures were taken from previous studies of their structural and magnetic properties.johnston The films have perpendicular anisotropy at low temperature. For films thicker than 2.2 ML, there is a re-orientation transition from perpendicular to in-plane moments as the temperature is increased, followed by a Curie transition to paramagnetism.arnold The film thickness, cleanliness and structure were confirmed using Auger electron spectroscopy and low energy electron diffraction. ac magnetic susceptibility measurements at a frequency of 210 Hz using a field amplitude of 2.0 Oe were made using the surface magneto-optical Kerr effect, and lock-in amplification.arnold2 The sample temperature was measured using a W-Re5%/W-Re10% thermocouple, and was controlled by radiant heating from a filament, and conductive cooling through a copper braid attached to a liquid nitrogen reservoir. When heating, the average rate of change of the sample temperature, R, could be controlled from 0.05 K/s to 1.00 K/s, with fluctuations in the rate less than 0.05 K/s. The maximum rate of controlled cooling that could be maintained over the entire relevant temperature range was -0.10 K/s.
A number of steps were taken to ensure reproducible measurements. First, the films were annealed to 400K after growth, and subsequent measurements did not exceed 360 K. In each case where the susceptibility was measured by heating from low temperature, the sample was first cooled from 360 K at a rate of R = -0.10 K/s. Since the initial cooling of the sample and sample support was much slower, the first measurement upon heating was discarded. When a series of curves were measured from the same film at different heating rates, the order of the rates was randomized so that effects of aging could not masquarade as effects due to changes in the heating rates. Finally, the effect of changes in the time constant used for lock-in amplification in the experiments was studied. In this way the time constant was chosen as 2 s. This is as large as possible to reduce noise, yet smaller than the value that affected the shape of the experimental curve.
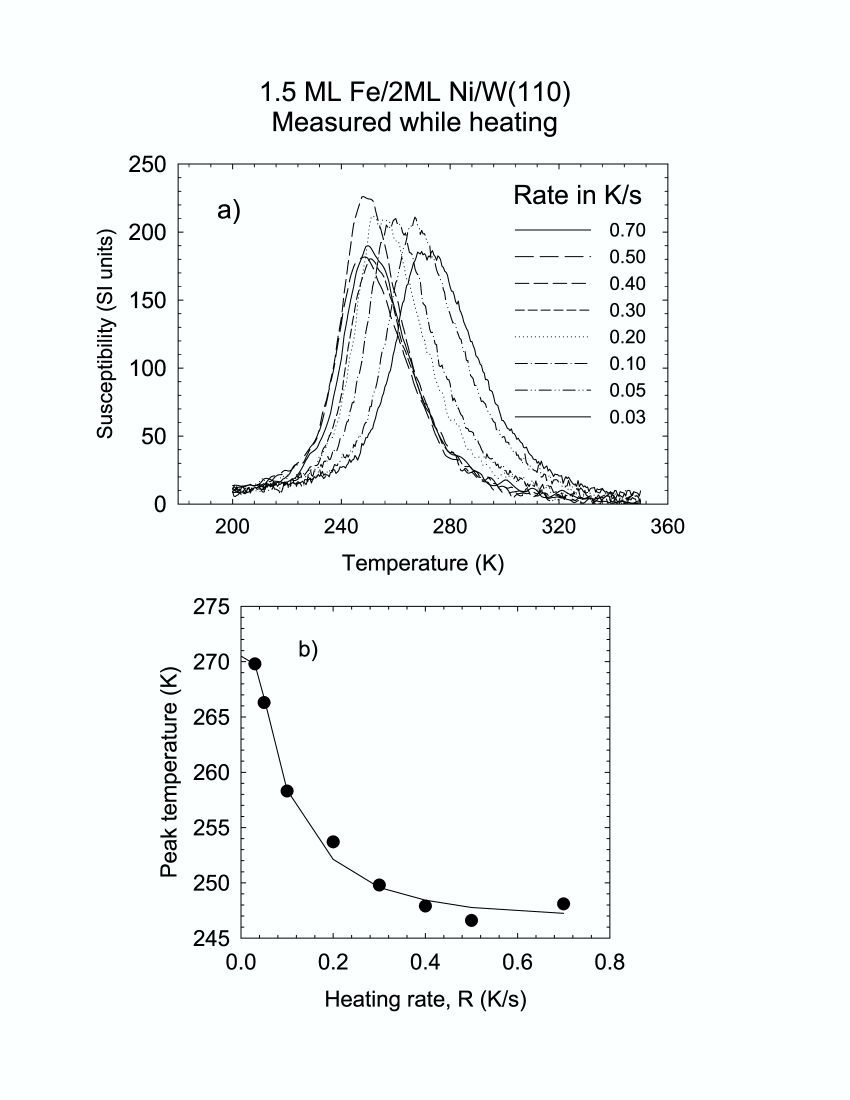
The real part of the ac magnetic susceptibility measured at a series of heating rates on a single film is shown in fig. 1a. The shape of the curve changes only in subtle ways as the heating rate is changed – the primary effect of changing the heating rate is a shift of the entire susceptibility curve in temperature. In the range 0.70 K/s 0.30 K/s, there is very little shift, but for slower heating rates the peak shifts progressively to higher temperature, and the susceptibility curve broadens somewhat. The location of the peak as a function of the heating rate is summarized in fig. 1b.
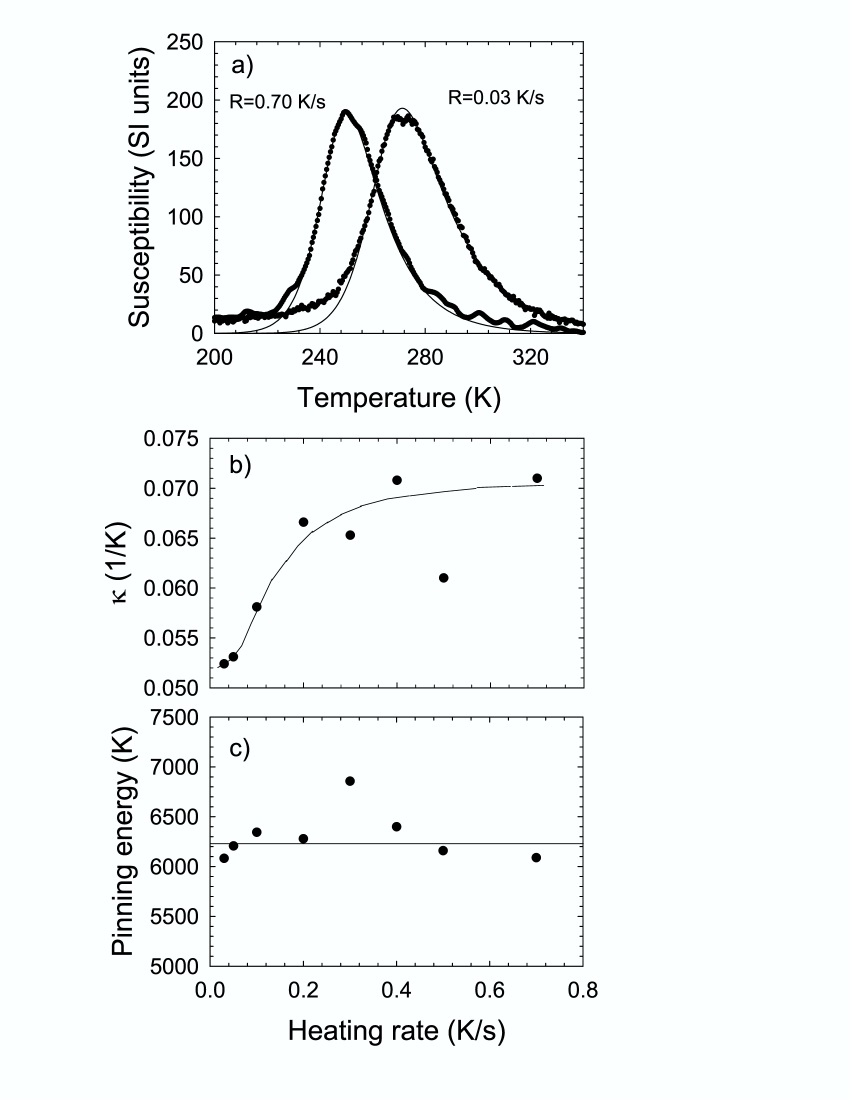
The changes in the susceptibility curve upon heating have been characterized by fitting the curves to eq.(2-4). The fits are summarized in fig. 2. In part a), the solid lines show the fits to the data for the extreme values of from fig. 1. These fits are representative, with the curve following the data closely except at the low temperature tail. The low temperature tail deviates from the data because the fit assumes a single average pinning energy, , rather than a more correct distribution of pinning energies. There are relatively few pinning sites with a pinning energy significantly lower than the average, but these are the only sites where the domain walls remain free at low temperature, and thus account for all the signal in the tail of the curve.venus2 The greater size of the low frequency noise in the data for K/s is consistent with the reduced measurement time compared to the data with K/s. Fig. 2b and 2c present the fitted parameters and the average defect pinning energy , respectively. It is clear that the shift in the peak temperature is associated with a change in . The pinning energy remains almost constant, as is expected, since the pinning energy is a characteristic of the film and substrate microstructure and does not change with the heating rate.
Since is an effective parameter, it is difficult to be precise about what causes it to change with heating rate so that the peak shifts in temperature. However, a number of possible artifacts can be ruled out. Fundamentally, changes in the equilibrium domain patterns (and thus the susceptibility) are driven by changes in the perpendicular anisotropy as a function of temperature. However, the perpendicular anistropy is determined by materials properties (magneto-crystalline anisotropy, shape anisotropy) that are not dependent on the rate of temperature change. The peak shifts are therefore not due to a true shift in the temperature dependence of the perpendicular anisotropy. It is, however, conceivable that the peak shifts are due to a time lag between the measured and true temperature, or due to the response time of the temperature measurement system itself. A simple calculation of the thermal diffusion time across the tungsten substrate gives an upper limit of a few tenths of K for a shift due to the fact the temperature measurement point and experimentally probed area of the film are physically separated. Limits on the size of the thermal lag of the overall temperature measurement system were established by heating at a constant rate up to a specific temperature, and then monitoring the measured temperature as a function of time at a constant temperature. In this case, a conservative upper limit in the temperature shift of 1 or 2 K was established. These effects are much smaller than those shown in fig. 1b.
It can also be shown that the changes in with heating rate are not due to the dynamical processes involved in changes to the domain density with temperature. At low temperature, the domain density will be small. As the temperature is increased, the domain density will increase through the creation and growth of new stripes. Since this process is thermally activated, the domain density will always lag the equilibrium domain density. As the heating rate is increased, this effect will be more pronounced, and the amount of lag between the actual and equilibrium density at a given temperature will also increase, and this could affect the fitted value of and shift the susceptibility curve. However, the crucial point is that, during heating, the lagging domain density is smaller than the equilibrium value, so the measured susceptibility is increased, causing the measured susceptibility curve to be progressively shifted to higher temperature for higher heating rates. This is precisely the opposite of what is seen experimentally. Although changes in domain density must occur, apparently this dynamical process is active on a faster time scale than those probed by the present experiments on these samples. On the time scale of the present measurements, the system is able to continually maintain a domain density close to the equilibrium value, except perhaps at the lowest temperatures. This conclusion is further corroborated by the very good fits of the susceptibility curves to eq.(4) reflecting the underlying processes of domain wall pinning at low temperature and a rapid increase in domain density at high temperature. The shift in the peak temperature in fig. 1 must be predominantly due the relaxation of some quantity other than domain density.
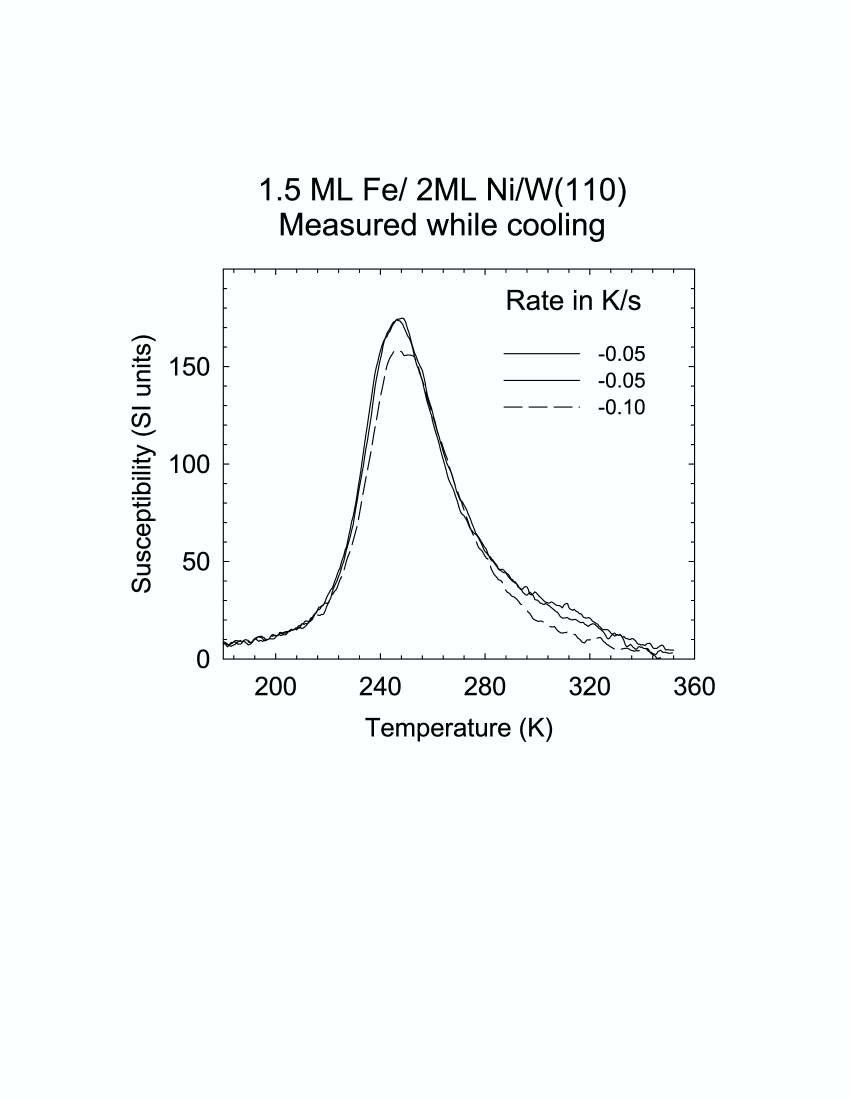
A series of further experiments were performed to more completely characterize the system. The susceptibility measured for a different sample during cooling is presented in fig. 3. Even though the range of available for cooling is limited, it is clear that the difference in the curves for = -0.10 K/s and -0.05 K/s is at most small and likely negligible. There is a distinct asymmetry in the behaviour for heating and cooling at these rates. The peak position and shape for the cooling curves is most similar to those of the heating curves at 0.40 K/s.
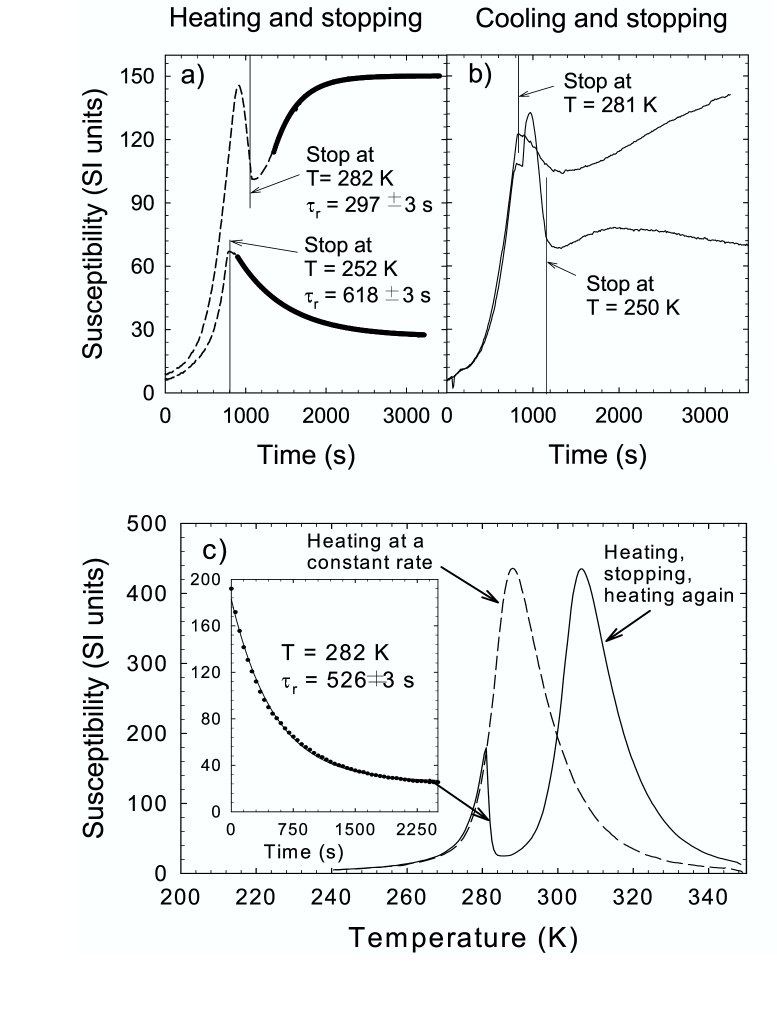
Longer time scales have been probed by stopping the heating or cooling at a predetermined temperature, and monitoring the susceptibility as a function of time. These results are presented in fig. 4a and 4b, for heating and cooling respectively, with = 0.10 K/s. After heating to 252 K, the susceptibility relaxes to a lower value by a simple exponential decay with s, whereas after heating to 282 K, the susceptibility relaxes more quickly (s) to a higher value. These results are in agreement with those presented in fig. 1a; the relaxation is always toward the curve measured with a smaller heating rate, which is closer to equilibrium. The curves in fig. 4b confirm the asymmetry between heating and cooling. When cooling is stopped at these same temperatures, the long-term relaxation is in the same direction as for heating (after a transient), but the relaxation time constant is much larger. Rough estimates are s at 250 K and s at 281 K.
A final experiment on a third film is presented in fig. 4c. In this case, the susceptibility was measured for a heating rate of = 0.30 K/s (dashed curve), the sample was cooled once more and the measurement was repeated (solid curve). This time the heating was stopped at =282 K, and the relaxation of the susceptibility was monitored as a function of time, as indicated in the inset. After the relaxation was complete, heating at = 0.30 K/s was resumed, producing the remainder of the solid curve. This result confirms that the shift in the curves is not caused by the different heating rates per se, but rather that the system is relaxing from a state that produces a susceptibility peak at lower temperature to one with a peak at a higher temperature, and that the amount of relaxation depends upon the total time that has elapsed.
IV Analysis and Discussion
These results provide evidence that some quantity in the quenched samples is relaxing as the equilibrium stripe phase is established, and that this relaxation occurs on a longer time scale than that required for the relaxation of the domain density. This is qualitatively consistent with the numerical results of Cannas et al.cannas who suggest the high temperature, positionally disordered smectic phase will be strongly metastable and persist into the stripe phase. It is also qualitatively consistent with Bromley et al.bromley , who find that the resolution of an initial state with many pattern defects and dislocations into an ordered stripe pattern proceeds with a very long time constant. We therefore advance the hypothesis that quenching the system traps a configuration with significant domain curvature and density of domain dislocations at low temperature, and that the system relaxes very slowly to an ordered stripe pattern. Upon heating the sample, the experiments indicate a more efficient resolution of the pattern defects during domain creation than was the case during domain annihiliation (cooling). This more efficient relaxation is revealed by a shift of the susceptibility peak to higher temperature, and a change in the phenomenological parameter , that is related to domain formation. It allows the system to approach the equilibrium state at high temperature, so that the system shows reproducible and systematic hysteresis upon temperature cycling with different heating rates.
To test this interpretation, it is first assumed that the relaxation rate during cooling is so much slower than during heating that the amount of relaxation that occurs during cooling can be neglected. The relaxation during heating is modeled as an activated process with time constant
| (5) |
where is an activation barrier that must be overcome in relaxing to the equilibrium stripe phase. The total number of time constants that have passed while heating from the initial temperature up to the peak temperature can be defined as :
| (6) |
Using the peak of the susceptibility curve as a marker to follow the relaxation suggests
| (7) |
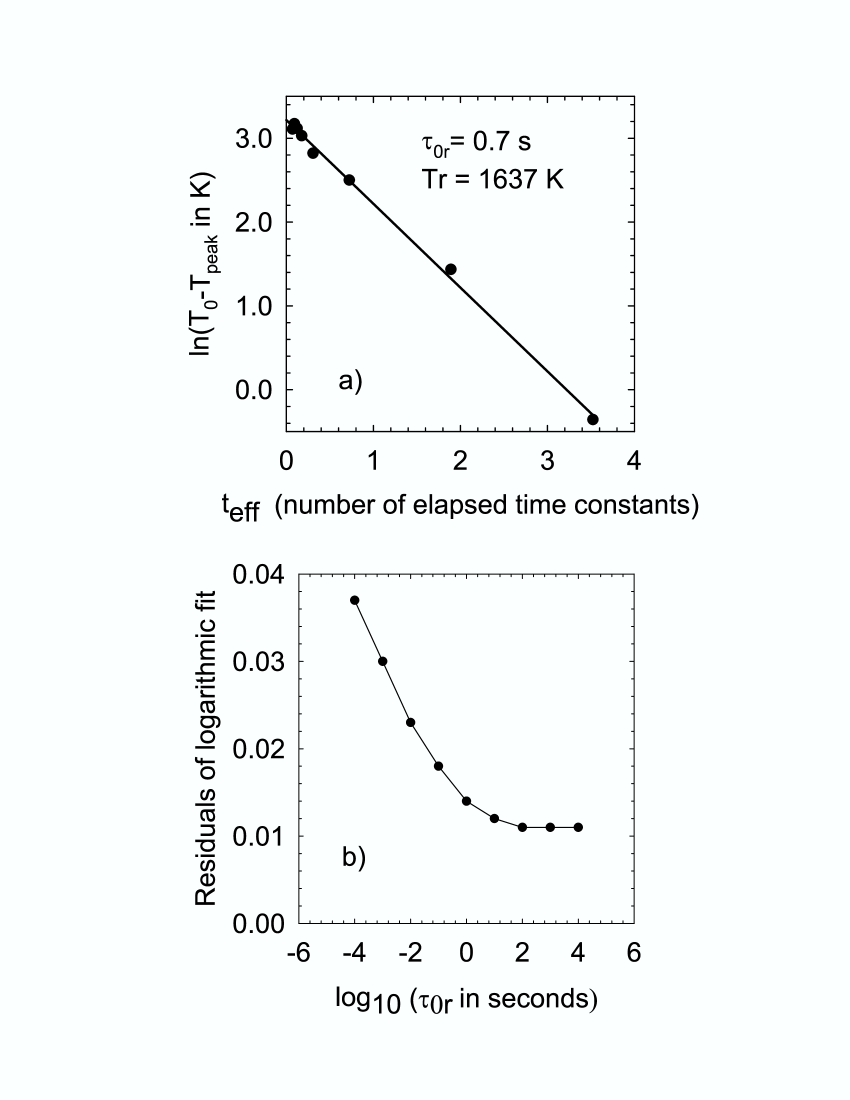
is the peak temperature when relaxation is complete. A plot of vs. has a slope of -1, and intercept of . There are three adjustable parameters, , , and , but two are linked by the requirement that the slope of the plot is -1, leaving two independent parameters. The least squares fit of the peak positions to eq.(7) is shown in fig. 5a, and as the solid line in fig. 1b. The value chosen for is constrained by the least squares residual in logarithmic space, as shown in fig. 5b, which gives a lower limit of , but does not establish an upper limit. However, the two experimental relaxation times in fig. 4a allow an independent estimate of the two quantities that determine the time constant in eq.(5) as = 0.7 s, and = 1735 K. This value of is entirely consistent with the lower limit established by the fitting, and was used for the plots in fig. 5a and 1b. The fitted value of , corresponding to = 0.7 s, is in very reasonable agreement with the experimental estimate of 1735 K. It is clear that this simple analysis gives a very good account of the data.
The excellent fit to the simple relaxation model for the peak as a whole has a number of implications. First, it confirms that “quenching” is an appropriate description of the cooling of the system, since essentially no relaxation occurs during cooling. The measurement of for K/s in fig. 2a is, in some important way, unrelaxed from the initial high temperature state before quenching. With = 0.07 time constants, approximately only 7% of the relaxation has occured. By contrast, the measurement with K/s has = 3.52 time constants, so that 97% of the relaxation is complete. The data at intermediate values of in fig. 1a are not a linear combination of these two endpoints – if they were, would exhibit a double-peaked structure. It therefore seems that the relaxation is not related to a localized property such as, for instance, phase separation or nucleation and growth of a low-temperature phase. Rather, a distributed property, which is ultimately related to , is relaxing. The analysis is therefore consistent with the relaxation of a non-equilibrium density of domain dislocations, and/or domain wall curvature that are characteristic of high temperature state from which the quench occurred.
The fundamental time scale of the relaxation, , is of order 1 s, which is very long compared to the fundamental time scale for localized Barkhausen steps in the domain wall position, s, in eq.(3). This implies that the relaxation requires changes of the domain walls on a mesoscopic scale involving the co-ordinated action of many independent microscopic Barkhausen steps, and is not directly related to the shape profile of the domain wall.vedmedenko ; vindigni The activation energy, 1600 K, for this co-ordinated motion of many Barkhausen steps, is about 1/4 of the activation energy K for the pinning of just one local Barkhausen step. Taken together, these indicate that the relaxation involves larger scale domain rearrangments driven by an interaction that is intrinsically weak but becomes substantial when integrated over a large area. This again is consistent with the relaxation of domain curvature and dislocations, driven by dipole energies.
In addition, there is clearly a relation between the phenomenological parameter and the relaxation. The larger values of for susceptibility measurements with larger values of indicate that after quenching, but before relaxation, the domain pattern is magnetically stiffer – that is, the effective spring constant for the compression of the pattern by a magnetic field is significantly larger. In the equilibrium stripe phase at low temperature, the magnetic stiffness depends only upon the domain density. Curvature of the domain walls and dislocations are essentially absent in equilibrium because they would greatly increase the elastic energy. At high temperature and in the positionally disordered phases, on the other hand, the enhanced fluctuations of the domain walls can accommodate curvature and an equilibrium density of domain dislocations without a significant cost in elastic energy. If quenching from high temperature introduces a relatively large amount of domain curvature and density of dislocations to the low temperature domain pattern, it is reasonable that this would be reflected in a larger elastic constant and value of , which would decrease, as is observed in fig. 2b, as the relaxation to equilibrium removes the defects.
Finally, there is the question of the asymmetry of the relaxation times for heating and cooling the system. Since domain annihilation upon cooling proceeds by first breaking up existing domains, it creates additional pattern defects and works against the removal of existing defects, making the relaxation very slow. Domain creation during heating, on the other hand, provides an opportunity for defects to be removed by growth and merging with other defects, or at the very least dilutes them in a greater stripe density. This abets the relaxation of the system toward equilibrium.
V Conclusions
Significant hysteresis and a heating/cooling asymmetry has been observed in the magnetic susceptibility of perpendicularly magnetized 1.5 ML Fe/2 ML Ni/W(110) films. The entire susceptibility curve relaxes slowly to higher temperature as the rate of heating during the measurement is decreased. This is incompatible with relaxation of the domain density, which occurs on a faster time scale and causes a temperature shift of opposite sign. However there is a great deal of self-consistent evidence that it is compatible with the relaxation of dislocations, defects and curvature that have been quenched from high temperature into an unstable domain configuration at low temperature. This evidence includes; an excellent quantitative fit of the relaxation to an activated relaxation with a fundamental time and energy scales appropriate for a large scale domain rearrangement by the weak dipole interaction; the correlation of the relaxation with a reduction in the magnetic “stiffness” of the film; and a qualitative link between the annihilation/creation of domains and the creation/annihilation of defects to understand the asymmetry in heating and cooling . This suggests that in quenching from 360 K to 220 K, the system passes through a transition from a positionally disordered domain phase to the semectic stripe phase.
These observations give qualitative support to recent numerical studies that indicate that the removal of domain dislocations after moving across a phase transition to the ordered stripe phase is very slow. However, it is not possible to discriminate between the detailed pictures suggested in those studies; whether the transition is of the Kosterlitz-Thouless type or is discontinuouscannas , whether it originates in the Ising nematic or tetragonal domain phasesbromley , and whether the quenched system is metastable or merely dynamically hindered. Regardless of these details, the results have important implications for the interpretation of studies using imaging techniques to study these domain phases. They suggest that great care must be taken to obtain images of phases that represent equilibrium conditions. Most imaging studies do not give details of the thermal history of the samples, although some mention very long times for the evolution of some patterns.portmann It is often not clear that images that seem to show paramagnetic or tetragonal phases are close to equilibrium and can serve as a basis for creating a phase diagram. It may be that the imaging of patterns with many defects is possible only because of the very slow dynamics observed in the present study.
The present dynamical studies highlight two different processes that occur on very different time scales in perpdendicularly magnetized domain patterns – the motion of domain walls in response to an applied field and the removal of pattern defects in response to long range dipole interactions. We expect that there will also be a dynamical signature of the annihilation and creation of domains to adjust the domain density on an intermediate time scale, and are currently conducting experiments to examine and characterize this process.
References
- (1) C. Sagui and R.C. Desai, Phys. Rev. E 49, 2225 (1994).
- (2) S.A. Kivelson et al., Rev. Mod. Phys. 75, 1201 (2003), and references therein.
- (3) K. De’Bell, A.B. MacIsaac and J.P. Whitehead, Rev. Mod. Phys. 72, 225 (2000).
- (4) Y. Yafet and E.M. Gyorgy, Phys. Rev. B 38, 9145 (1988).
- (5) A.B. Kashuba and V.L. Pokrovsky, Phys. Rev. B 48, 10335 (1993).
- (6) A. Abanov, V. Kalatsky, V.L. Pokrovsky and W.M. Saslow, Phys. Rev. B 51, 1023 (1995).
- (7) P. Politi, Comments Condens. Matter Phys. 18, 191 (1998).
- (8) I. Booth, A.B. MacIsaac, J.P. Whitehead, and K. De’Bell, Phys. Rev. Lett. 75, 950 (1995).
- (9) A.B. MacIsaac, K. De’Bell and J.P. Whitehead, Phys. Rev. Lett. 80, 616 (1998).
- (10) A.D. Stoycheva and S.J. Singer, Phys. Rev. Lett. 84, 4657 (2000).
- (11) L.C. Sampaio, M.P. de Albuquerque and F.S de Menezes, Phys. Rev. B 54, 6465 (1996).
- (12) R. Allenspach and A. Bischof, Phys. Rev. Lett. 69, 3385 (1992).
- (13) M. Speckmann, H.P. Oepen and H. Ibach, Phys. Rev. Lett. 75, 2035 (1995).
- (14) C. Won, Y.Z. Wu, J. Choi, W. Kim, A. Scholl, A. Doran, T. Owens, J. Wu, X.F. Jin, H.W. Zhao and Z.Q. Qiu, Phys. Rev. B 71, 224429 (2005).
- (15) O. Portmann, A. Vaterlaus and D. Pescia, Nature 422, 701 (2003).
- (16) N. Saratz, T. Michlmayr, O. Portmann, U. Ramsberger, A. Vaterlaus, and D. Pescia, J. Phys. D: Appl. Phys. 40,1268 (2007).
- (17) A. Vaterlaus, C. Stamm, U. Maier, M.G. Pini, P. Politi and D. Pescia, Phys. Rev. Lett. 84, 2247 (2000).
- (18) O. Portmann, A. Vaterlaus and D. Pescia, Phys. Rev. Lett. 96, 047212 (2006).
- (19) A. Berger and H. Hopster, Phys. Rev. Lett. 76, 519 (1996).
- (20) D. Venus, C.S. Arnold and M. Dunlavy, Phys. Rev. B 60, 9607 (1999).
- (21) D. Venus and M.J. Dunlavy, J. Magn. Magn. Mater. 260, 195 (2003).
- (22) S.P. Bromley, J.P. Whitehead, K. De’Bell and A.B. MacIsaac, J. Magn. Magn. Mater. 264, 14 (2003).
- (23) S.A. Cannas, M.F. Michelon, D.A. Stariolo and F.A. Tamarit, Phys. Rev. B 73, 184425 (2006); Phys. Rev. E 78, 051602 (2008).
- (24) P. Bruno, G. Bayreuther, P. Beauvillain, C. Chappert, G. Luget, D. Renard, J.P. Renard and J. Seiden, J. Appl. Phys. 68, 5759 (1990).
- (25) C.S. Arnold, H.L. Johnston and D. Venus, Phys. Rev. B 56, 8169 (1997).
- (26) E.Y. Vedmedenko, H.P. Oepen, A. Ghazali, J.-C.S. Levy and J. Kirschner, Phys. Rev. Lett. 84,5884 (2000).
- (27) A. Vindigni, N. Saratz, O. Portmann, D. Pescia and P. Politi, Phys. Rev. B 77, 092414 (2008).
- (28) H.L. Johnston, C.S. Arnold and D. Venus, Phys. Rev. B 55, 13221 (1997).
- (29) C.S. Arnold, M.J. Dunlavy and D. Venus, Rev. Sci. Instrum. 68, 4212 (1997).