Turbulence and Dynamo in Galaxy Cluster Medium:
Implications on the Origin of Cluster Magnetic Fields
Abstract
We present self-consistent cosmological magnetohydrodynamic (MHD) simulations that simultaneously follow the formation of a galaxy cluster and the magnetic field ejection by an active galactic nucleus (AGN). We find that the magnetic fields ejected by the AGNs, though initially distributed in relatively small volumes, can be transported throughout the cluster and be further amplified by the intra-cluster medium (ICM) turbulence during the cluster formation process. The ICM turbulence is shown to be generated and sustained by the frequent mergers of smaller halos. Furthermore, a cluster-wide dynamo process is shown to exist in the ICM and amplify the magnetic field energy and flux. The total magnetic energy in the cluster can reach ergs while micro Gauss (G) fields can distribute over Mpc scales throughout the whole cluster. This finding shows that magnetic fields from AGNs, being further amplified by the ICM turbulence through small-scale dynamo processes, can be the origin of cluster-wide magnetic fields.
1 Introduction
There is growing evidence that the ICM is permeated with magnetic fields, as indicated by the detection of large-scale, diffused radio emission called radio halos and relics (see recent reviews by Ferrari et al., 2008; Carilli & Taylor, 2002). The radio emissions are extended over Mpc, covering the whole cluster. By assuming that the total energy in relativistic electrons is comparable to the magnetic energy, one often deduces that the magnetic fields in the cluster halos can reach G and the total magnetic energy can be as high as ergs (Feretti, 1999). The Faraday rotation measurement (FRM), combined with the ICM density measurements, often yields cluster magnetic fields of a few to ten G level (mostly in the cluster core region). More interestingly, it reveals that magnetic fields can have a Kolmogorov-like turbulent spectrum in the cores of clusters (Vogt & Enßlin, 2003) with a peak at several kpc. Other studies have suggested that the coherence scales of magnetic fields can range from a few kpc to a few hundred kpc (Eilek & Owen, 2002; Taylor & Perley, 1993; Colgate & Li, 2000), implying large amounts of magnetic energy and fluxes. Understanding the origin and effects of magnetic fields in clusters is important because they play a crucial role in determining the structure of clusters through processes such as heat transport, which consequently affect the applicability of clusters as sensitive probes for cosmological parameters (Voit, 2005).
Although the existence of cluster-wide magnetic fields is clear, their origin is still poorly understood. Two scenarios have received most attention: a) magnetic fields are initially from the outflows of normal or active galaxies (Donnert et al., 2009; Furlanetto & Loeb, 2001; Kronberg et al., 2001), and such fields can be further amplified by cluster merger (Roettiger et al., 1999) and turbulence (Dolag et al., 2002; Dubois & Teyssier, 2008); and b) very small proto-galactic seed fields are amplified by dynamo processes in clusters (Kulsrud et al., 1997; Ryu et al., 2008), though the exact mechanism for dynamo is still being debated (Bernet et al., 2008). Large scale radio jets from AGNs serve as one of the most intriguing candidates in the first scenario because they could carry large amount of magnetic energy and flux (Burbidge, 1959; Kronberg et al., 2001; Croston et al., 2005; McNamara & Nulsen, 2007). The magnetization of the ICM and the wider inter-galactic medium (IGM) by AGNs has been suggested on the energetic grounds (Colgate & Li, 2000; Furlanetto & Loeb, 2001; Kronberg et al., 2001), though the exact physical processes of how magnetic fields will be transported and amplified remain sketchy. Some of the key physics questions in these models include: what is the volume filling process of AGN magnetic fields in the ICM/IGM? Is the ICM turbulent and what are its properties? Is there a dynamo in the ICM that can amplify fields?
In this Letter, we present self-consistent cosmological MHD simulations to address the question of the origin of magnetic fields in clusters. We explore specifically the scenario that cluster-wide magnetic fields initially came from the magnetic fields of an AGN. We also describe the properties of the ICM turbulence and demonstrate the existence of dynamo in the ICM. The simulations are described in Section 2 and results are presented in Section 3. Discussions are given in Section 4.
2 Basic Model and Simulations
We have performed detailed cosmological MHD simulations of galaxy cluster formation with the magnetic field injection from an AGN, using the newly developed ENZO+MHD code, which is an Eulerian cosmological MHD code with adaptive mesh refinement (AMR) (Xu et al., 2008). Our simulations use a CDM model with parameters , , , , and , with initial conditions extracted from the Simulated Cluster Archive (see http://lca.ucsd.edu/data/sca/). The simulation volume is Mpc on a side, and it uses a root grid and level nested static grids in the Lagrangian region where the cluster forms. This gives an effective root grid resolution of cells ( Mpc) and dark matter particles of mass .
The simulations were evolved from redshift to adiabatically. We “turn on” the AGN magnetic injection at redshift , centered at a massive galaxy in a proto-cluster which has a virial radius Mpc, a baryon virial mass , and a virial total mass . The cluster eventually grows to Mpc, , and by . The total injected magnetic energy by AGN is about ergs, with an average input power of ergs s-1 for a duration of Myr. The magnetic energy is injected inside . Because it is currently not possible to resolve both the galaxy cluster and the AGN environment simultaneously, we have adopted an approach that mimics the possible magnetic energy injection by an AGN (Li et al., 2006). The size of the injection region and the associated field strength are not realistic when compared to the real AGN jets, but on global scales, the previous studies by Nakamura et al. (2006) and Xu et al. (2008) showed that this approach can reproduce the observed X-ray bubbles and shock fronts (McNamara et al., 2005). AMR is allowed only in a region of (50 Mpc)3 where the galaxy cluster forms. During the cluster formation, the refinement is controlled by baryon and dark matter overdensity. In addition, all the region where magnetic field strength is higher than G will be refined to the highest level. There are a total of levels of refinement beyond the root grid, for a maximum spatial resolution of kpc. Consequently, our simulations are equivalent to uniform grid MHD runs in the cluster region with full cosmology. The simulation was performed on the linux cluster Coyote at LANL with about 300,000 CPU hours consumed.
3 Results
3.1 Global Morphology
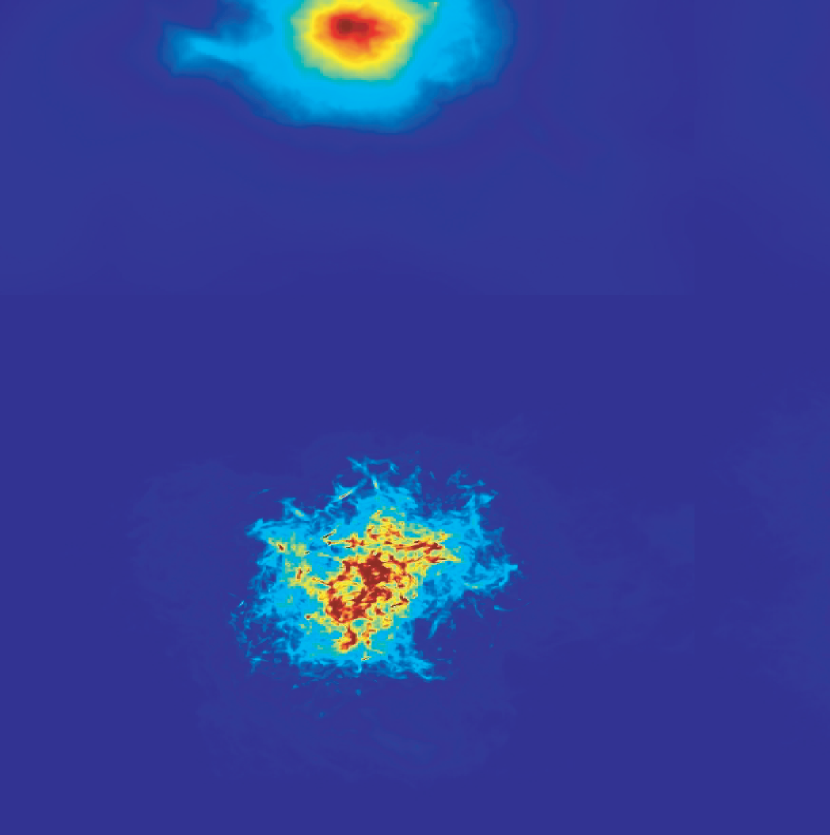
To illustrate the formation and evolution of the cluster along with the evolution of magnetic fields from the AGN, we present images of the projected gas density and magnetic energy density at different stages of cluster formation in Fig. 1. At (), an AGN is “turned on” in a sub-cluster (which eventually merges with another sub-cluster about Myr after the AGN injection has finished). The AGN is “turned off” at Myr (). At Myr, we see the density cavities produced by the AGN magnetic fields, reminiscent of the jet-lobe structure of radio galaxies (Xu et al., 2008). At a later time Myr, the jet-lobe structure is destroyed by the cluster mergers. When two sub-clusters finish merging at about Gyr, a large part of magnetic fields is carried out of the cluster center region by the ejected flow from mergers. As the evolution progresses, magnetic fields, which follow the plasma motion, are being sheared, twisted, and spread throughout the whole cluster. Judging by the images from to Gyr, this volume-filling process is quite efficient (see Discussions). By ( Gyr), magnetic fields are well mixed with the ICM and are distributed throughout the whole cluster, with some high magnetic field regions obviously from shock compressions. At , while the cluster has relaxed, the magnetic fields seem to distribute over the whole cluster quasi-uniformly.
3.2 Energy Evolution and Magnetic Field Radial Profile
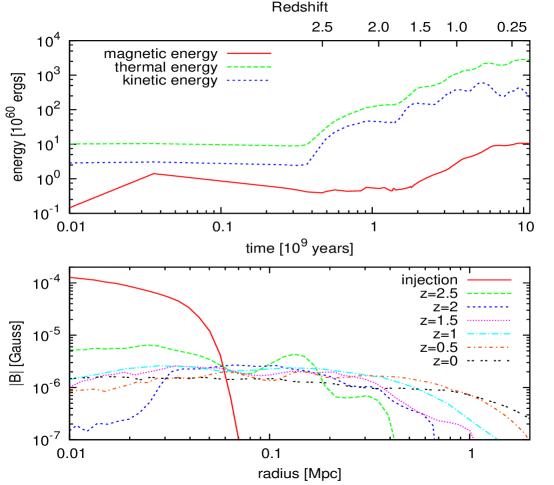
The evolution of the total thermal, kinetic, and magnetic energy inside the cluster’s virial volume is shown in the top panel of Fig. 2. The kinetic energy is calculated as the turbulent component by subtracting the bulk flow motion. By the AGN injection, ergs of magnetic energy is input into a sub-cluster. A significant fraction () of this energy is deposited into the ICM due to expansion and heating (Xu et al., 2008). When the two big sub-clusters merge at Myr, the total thermal and kinetic energies of the cluster increase by ten-fold by Myr. During this major merger, the magnetic fields are still very local, largely in magnetic bubbles. So the merger event itself did not significantly change the magnetic field energy. The thermal and kinetic energies of the cluster continue to increase as the cluster grows in mass via accretion and mergers as indicated by the variations in the energy evolution curves. At Gyr, the magnetic fields from the AGN have been spread throughout a significant volume of the cluster (see Fig. 1). Starting from this time, the magnetic energy experiences an exponential increase by a factor of until Gyr, at which time the growth has slowed. After Gyr, the cluster grows slowly in its total energy and becomes relaxed, and the magnetic energy increases slowly with the growth of the cluster. By , the total magnetic energy has reached ergs inside the cluster. Considering that the magnetic energy will drop as due to the the expansion of the universe, the total magnetic energy has actually increased by times between and Gyr.
In the bottom panel of Fig. 2, we present the spherically averaged radial profiles of magnetic field strength at different epochs. At , the magnetic field strength is G at the core, decreasing slowly to G at Mpc radius. These radial profiles are different from what is shown by other simulations which often exhibit faster radial decline (Dolag et al., 2002; Dubois & Teyssier, 2008; Donnert et al., 2009). It is presently unclear whether this difference is caused by the different origins of “seed” magnetic fields or by the effects of different numerical techniques and resolutions. This difference deserves further study since it may be used to distinguish different origins of magnetic fields in clusters. Furthermore, it will be necessary to compare our simulation results with cluster magnetic observations in detail (e.g., Govoni et al., 2006; Guidetti et al., 2008). This will be presented in future publications.
3.3 Small-scale Turbulent Dynamo and MHD Turbulence
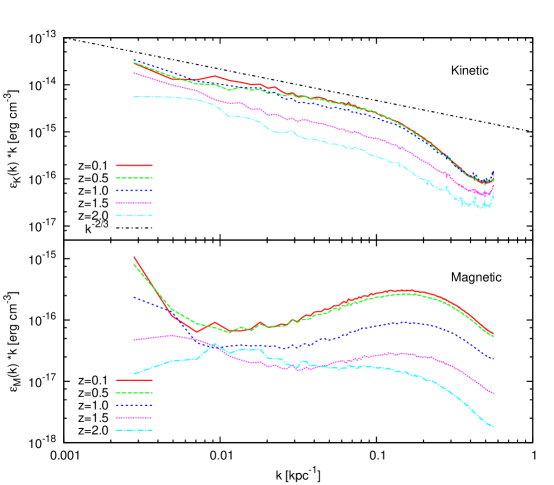
The physical origin for the exponential amplification of the magnetic energy is due to a cluster-wide turbulent dynamo process. In Fig. 3 we present the power spectra of the ICM plasma’s kinetic energy density and magnetic energy density in a comoving cube with Mpc on the side. The scales are shown in the comoving units so that they are not affected by the universe expansion and the power changes are from the dynamics of cluster evolution alone. Here, kpc-1 corresponds to the maximum radius of the central region Mpc where a high spatial refinement is adopted. Since the cluster’s total thermal energy is a factor of larger than its kinetic energy, the ICM can be thought as nearly incompressible plasmas overall, though shocks generated by mergers are very frequent and important. In fact, the flows and shocks from mergers tend to be global and propagate through the whole cluster (see also the earlier work by Roettiger et al., 1999). We can divide the full kinetic spectrum approximately into three regions: the “injection” region for kpc-1 where the large scale flows and shocks from the mergers “stir” the whole cluster; the “cascade” region for where the spectrum shows a smooth power law similar to a Kolmogorov-like incompressible turbulence; the “dissipation” region for where the spectrum steepens gradually. We attribute this steepening to both the dissipation by shocks (which has a physical origin) and the limited spatial resolution (which has a numerical origin). These features in the kinetic energy density spectrum lead us to conclude that the ICM is turbulent and our simulations have captured the essence of this turbulence. This ICM turbulence is in a driven-dissipative state where frequent mergers will drive the turbulence over relatively short time scales (a few Myr) but the turbulence is decaying in-between mergers on timescales of Gyr (which is approximately the dynamic timescale for the whole cluster).
The magnetic energy density spectrum also has three regions in the space corresponding to the kinetic energy spectrum. From to Gyr ( to ), the magnetic spectrum for retains an “invariable” shape but the energy density undergoes exponential amplification then goes into saturation. This is a strong signature for the so-called small-scale turbulent dynamo (Brandenburg & Subramanian, 2005). Furthermore, the magnetic energy density peaks at with ergs cm-3. The corresponding kinetic energy density is ergs cm-3. So, the magnetic energy for has saturated at a sub-equipartition level (by a factor of ). The drop-off at high should be due to the numerical dissipation. For , neither kinetic or magnetic energy seems to have saturated. It is interesting to note that the dynamo process starts vigorously only at Gyr (), when the magnetic fields have been spread through a significant fraction of the whole cluster (see Fig. 1). Putting Figs. 1 - 3 together, we see that the ICM turbulence both amplifies the magnetic energy and diffuses the fields throughout the cluster. The magnetic energy density saturation occurred at Gyr but magnetic fields continue to “grow” in their spatial extent through turbulent diffusion. Furthermore, the un-signed magnetic flux through the mid-plane of the cluster has exponentially grown from to G cm2 from to , which is another clear indication of the turbulent dynamo that is responsible for both amplifying the field energy and diffusing the field through the cluster.
3.4 Faraday Rotation Measurement
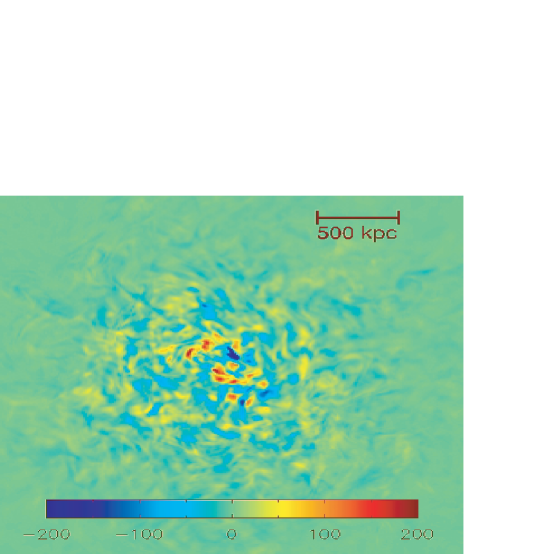
We have also computed the synthetic FRM by integrating to the mid-plane of the cluster. Fig. 4 shows the spatial distribution of FRM at . The typical value of FRM is rad m-2, with high values concentrated in the cluster core region. Interestingly, the FRM map not only shows the small scale variations reminiscent of the ICM MHD turbulence, but also displays long, narrow filaments with dimensions of kpc kpc. The FRM magnitudes and spatial distributions from simulations are quite consistent with observations of radio galaxies in clusters (Guidetti et al., 2008; Eilek & Owen, 2002; Taylor & Perley, 1993).
4 Discussions
The results presented here need to be taken as an initial step in better understanding the evolution of AGN magnetic fields over the lifetime of a cluster. The fact that the AGN magnetic fields are injected very early in the history of the cluster formation (i.e., z=3), before the major merger events, could be important. For AGN fields injected relatively late in the cluster formation (e.g., Xu et al., 2008) or injected into relatively quite background ICM (e.g., Liu et al., 2008), the magnetic fields may not experience extensive stretching and transport so that they could survive in a bubble morphology without undergoing significant mixing with the background ICM.
Note that even though we have solved the ideal MHD equations, there is clearly numerical diffusion that has allowed the magnetic fields to diffuse in the ICM. The rate of diffusion is often related to the numerical Reynolds number and magnetic Reynolds number. We estimated that these numbers in our simulations are on the order of a few hundred (this is especially true in the cluster core region where most of the magnetic field energy resides). The small scale dynamo theory and simulations (Boldyrev & Cattaneo, 2004) have shown that the dynamo will grow under such conditions, which is consistent with our findings. The real ICM could have Reynolds number as low as ten (Reynolds et al., 2005), but its magnetic Reynolds number is less well determined, especially in a magnetized turbulent medium.
Since AGNs are commonly observed in galaxy clusters, one important implication of our studies is that the magnetic fields from AGNs alone are perhaps enough to “seed” the cluster and the ICM turbulence generated and maintained by mergers will amply and spread the AGN fields via a dynamo process. This is consistent with observations that clusters with large scale radio emissions are often correlated with cluster mergers (Feretti, 2005).
References
- Bernet et al. (2008) Bernet, M. L., Miniati, F., Lilly, S. J., Kronberg, P. P., & Dessauges-Zavadsky, M. 2008, Nature, 454, 302
- Boldyrev & Cattaneo (2004) Boldyrev, S., & Cattaneo, F. 2004, Phys. Rev. Lett., 92, 144501
- Brandenburg & Subramanian (2005) Brandenburg, A., & Subramanian, K. 2005, Phys. Rep., 417, 1
- Burbidge (1959) Burbidge, G. R. 1959, ApJ, 129, 849
- Carilli & Taylor (2002) Carilli, C. L., & Taylor, G. B. 2002, ARA&A, 40, 319
- Colgate & Li (2000) Colgate, S. A., & Li, H. 2000, in IAU Symposium, Vol. 195, Highly Energetic Physical Processes and Mechanisms for Emission from Astrophysical Plasmas, ed. P. C. H. Martens, S. Tsuruta, & M. A. Weber (Dordrecht: Kluwer), 255
- Croston et al. (2005) Croston, J. H., Hardcastle, M. J., Harris, D. E., Belsole, E., Birkinshaw, M., & Worrall, D. M. 2005, ApJ, 626, 733
- Dolag et al. (2002) Dolag, K., Bartelmann, M., & Lesch, H. 2002, A&A, 387, 383
- Donnert et al. (2009) Donnert, J., Dolag, K., Lesch, H., & Müller, E. 2009, MNRAS, 392, 1008
- Dubois & Teyssier (2008) Dubois, Y., & Teyssier, R. 2008, A&A, 482, L13
- Eilek & Owen (2002) Eilek, J. A., & Owen, F. N. 2002, ApJ, 567, 202
- Feretti (1999) Feretti, L. 1999, in Diffuse Thermal and Relativistic Plasma in Galaxy Clusters, ed. H. Boehringer, L. Feretti, & P. Schuecker (Garching : MEP), 3
- Feretti (2005) Feretti, L. 2005, Adv. Space Res., 36, 729
- Ferrari et al. (2008) Ferrari, C., Govoni, F., Schindler, S., Bykov, A. M., & Rephaeli, Y. 2008, Space Sci. Rev., 134, 93
- Furlanetto & Loeb (2001) Furlanetto, S. R., & Loeb, A. 2001, ApJ, 556, 619
- Govoni et al. (2006) Govoni, F., Murgia, M., Feretti, L., Giovannini, G., Dolag, K., & Taylor, G. B. 2006, A&A, 460, 425
- Guidetti et al. (2008) Guidetti, D., Murgia, M., Govoni, F., Parma, P., Gregorini, L., de Ruiter, H. R., Cameron, R. A., & Fanti, R. 2008, A&A, 483, 699
- Kronberg et al. (2001) Kronberg, P. P., Dufton, Q. W., Li, H., & Colgate, S. A. 2001, ApJ, 560, 178
- Kulsrud et al. (1997) Kulsrud, R. M., Cen, R., Ostriker, J. P., & Ryu, D. 1997, ApJ, 480, 481
- Li et al. (2006) Li, H., Lapenta, G., Finn, J. M., Li, S., & Colgate, S. A. 2006, ApJ, 643, 92
- Liu et al. (2008) Liu, W., Li, H., Li, S., & Hsu, S. C. 2008, ApJ, 684, L57
- McNamara & Nulsen (2007) McNamara, B. R., & Nulsen, P. E. J. 2007, ARA&A, 45, 117
- McNamara et al. (2005) McNamara, B. R., Nulsen, P. E. J., Wise, M. W., Rafferty, D. A., Carilli, C., Sarazin, C. L., & Blanton, E. L. 2005, Nature, 433, 45
- Nakamura et al. (2006) Nakamura, M., Li, H., & Li, S. 2006, ApJ, 652, 1059
- Reynolds et al. (2005) Reynolds, C. S., McKernan, B., Fabian, A. C., Stone, J. M., & Vernaleo, J. C. 2005, MNRAS, 357, 242
- Roettiger et al. (1999) Roettiger, K., Stone, J. M., & Burns, J. O. 1999, ApJ, 518, 594
- Ryu et al. (2008) Ryu, D., Kang, H., Cho, J., & Das, S. 2008, Science, 320, 909
- Taylor & Perley (1993) Taylor, G. B., & Perley, R. A. 1993, ApJ, 416, 554
- Vogt & Enßlin (2003) Vogt, C., & Enßlin, T. A. 2003, A&A, 412, 373
- Voit (2005) Voit, G. M. 2005, Rev. Mod. Phys., 77, 207
- Xu et al. (2008) Xu, H., Li, H., Collins, D., Li, S., & Norman, M. L. 2008, ApJ, 681, L61