On the nature of red galaxies: the Chandra perspective
We present the X-ray properties of the extremely red objects (ERO) population observed by Chandra with three partially overlapping pointings (up to 90 ks) over an area of 500 arcmin2, down to a 0.5–8 keV flux limit of . We selected EROs using a multi-band photometric catalog down to a -band magnitude of 19.3 (Vega system); 14 EROs were detected in X-rays, corresponding to 9% of the overall X-ray source population (149 X-ray sources) and to 5% of the ERO population (288). The X-ray emission of all X-ray detected EROs is consistent with that of an active galactic nucleus (AGN) ( erg s-1 at photometric redshifts ), in agreement with previous X-ray observations, with an indication of increasing absorption between the three X-ray brightest EROs and the 11 X-ray faintest EROs. We take advantage of the good spatial resolution and limited background provided by Chandra to place constraints on the population of the X-ray undetected EROs by a stacking analysis. Their stacked emission, whose statistical significance is 5.7 in the observed 0.5–8 keV band, provides an upper limit to the average intrinsic absorption at =1 of 2.5 cm-2 and corresponds to a rest-frame 0.5–8 keV luminosity of 8.9 erg s-1 . We estimate that any accretion-related X-ray emission to the stacked signal is likely “diluted” by emission due to hot gas in normal galaxies and star-formation activity in dust-enshrouded galaxies at high redshift.
Key Words.:
galaxies: active — galaxies: nuclei — quasars: general — X-rays: galaxiesemail:campisi@mpa-garching.mpg.de
1 Introduction
Major efforts have been made to understand how the history of cosmic star formation is linked to the assembly of the stellar mass density (e.g., Fontana et al. 2003; see also Renzini 2006 for a review). These have involved challenging observational projects, mainly at optical and near-infrared (NIR) wavelengths, which have aimed to complete a census of the high-redshift galaxy population, to characterize their physical properties and to determine how galaxies form and evolve through cosmic time (e.g., Daddi et al. 2004; Caputi et al. 2005). Many of these studies have focused on red galaxy populations at 1–3, which are commonly considered to be the progenitors of the local early-type population at high redshift.
An efficient criterion for selecting high-redshift galaxies is related to their color. In particular, sources with ()5 or ()4 (where magnitudes are in the Vega system), the so-called extremely red objects (EROs; Elston et al. 1988), are characterized as being optically faint but relatively bright in the NIR bands. Their color is consistent with that of old, passively evolving galaxies, observed at , and with that expected from dust-enshrouded high-redshift star-forming galaxies (e.g., Simpson et al. 2006). The two classes populate almost equally the ERO sample, as pointed out over the past decade by deep VLT spectroscopy from the K20 survey (Cimatti et al. 2002, 2003), morphological studies (e.g., McCarthy 2004), color selection (e.g., Pozzetti & Mannucci 2000; Mannucci et al. 2002; Wilson et al. 2007; Imai et al. 2008; Dunne et al. 2009), radio observations (e.g., Smail et al. 2002) and spectral energy distribution fitting (e.g., Fang et al. 2009). Since the first studies of large samples of EROs, it has been clear that these sources are highly clustered (e.g., Daddi et al. 2000; Roche et al. 2002; Georgakakis et al. 2005; Brown et al. 2005) and represent one of the major components of the stellar mass build-up at redshifts 1–2.
Until some years ago, the presence of an AGN in a fraction of the ERO population was a matter of debate, with only a few cases of detections via the presence of strong emission lines in the NIR/optical spectra (Pierre et al. 2001; Willott et al. 2001; Brusa et al. 2003) or by deep X-ray observations (e.g., Vignali et al. 2001). The advent of sensitive X-ray instruments onboard Chandra and XMM-Newton has opened a new era in the investigation of the nature of EROs; in particular, in the Chandra Deep Field-North (CDF-N), the fraction of EROs with X-ray detection was estimated to be 30% (e.g., Hornschemeier et al. 2001; Alexander et al. 2002; Vignali et al. 2002). While at the faintest fluxes, their X-ray emission appears consistent with non-AGN emission (star formation or normal elliptical galaxy emission; e.g. Brusa et al. 2002), at the brightest X-ray fluxes, the radiation is caused by non-thermal processes (i.e., emission from the AGN), and in % of the AGN-related cases is obscured by a large amount of gas (with column densities of up to a few cm-2). These results have been subsequently confirmed and expanded by many authors (e.g., Mainieri et al. 2002, 2005; Roche et al. 2003; Stevens et al. 2003; Mignoli et al. 2004; Brusa et al. 2005, hereafter B05; Severgnini et al. 2005, 2006) using the large amount of data in both ultra-deep and moderate-depth X-ray surveys.
A significant fraction of these AGN-EROs are characterized by high X-ray-to-optical flux ratios (X/O), which has been shown to be an indicator of obscuration (e.g., Fiore et al. 2003, 2008; see also Fiore et al. 2009). As a consequence, the red color selection, which allows us to select high-redshift sources, coupled with the high X/O criterion, which is often linked to obscured accretion, provides a good method for identifying high-redshift, typically high-luminosity obscured AGN, the long-sought after Type 2 quasars (e.g., Vignali et al. 2006 and references therein). However, the overall number of these sources is limited by the small area surveyed at ultra-faint X-ray flux limits.
Motivated by these considerations, B05 used pointed XMM-Newton observations in the so-called “Daddi field” (Daddi et al. 2000) to investigate the nature of X-ray emitting EROs. Nine of the 257 EROs () were detected in X-rays (B05); X-ray emitting EROs constitute (9/60) of the 2–10 keV selected sample. Given the relatively bright X-ray fluxes reached by these observations (2–10 keV flux limit of 4 ), all of the X-ray detected EROs are probably AGN, because of the X-ray luminosities derived assuming ( erg s-1) and the possible obscuration in 7/9 of the EROs detected at hard energies.
To study the X-ray emitting ERO population to deeper X-ray fluxes than
allowed by the XMM-Newton observations mentioned above, the “Daddi field” was observed by Chandra in 2004. One of the goals consisted of detecting the faint ERO population
and defining the average properties of the X-ray individually undetected EROs by a stacking analysis, for which the Chandra good spatial
resolution and low background are properly suited.
The paper is organized as follows: the optical/NIR catalog is presented in Sect.2, while the Chandra data, along with the X-ray catalog, are reported in Sect.3 and in the Appendix. The properties of the X-ray detected EROs and the characterization of the X-ray undetected EROs via stacking analysis are shown in Sect.4, while Sect.5 provides a discussion in the context of past X-ray results. A summary of our results is reported in Sect.6.
2 The “Daddi field”: near-infrared and optical data
The “Daddi field”, centered on =14h49m29s and =09°00′00′′ (J2000), was observed in the band with the ESO NTT 3.5m telescope at La Silla in 1999, using the SOFI camera. The survey in the band covers 700 arcmin2 and is 85% complete for point-like sources to over the entire area and to over an area of 450 arcmin2. The -band data, down to a 5 limiting magnitude of 25.4, were taken in 1998 with the 4.2m William Herschel Telescope in La Palma.
Aperture photometry was computed using the SExtractor software (Bertin & Arnouts 1996); the output catalog of sources was matched to -band counterparts (or upper limits) and contains sources with data of a signal-to-noise ratio 3 (in at least the band) in a 2′′ circular extraction aperture (see Daddi et al. (2000) for the details about the observing runs, data analysis, and matched source catalog procedure). The final sample of EROs () comprises 350 sources (231 EROs with , and 119 with 18.819.3).
Further optical observations in the , , and bands of this field were carried out using the Subaru telescope in 2003, matching the and -band coverage. The corresponding magnitude limits in these three filters, as reported in Kong et al. (2006), are 27.1, 25.6, and 25.0, respectively (Vega system). Spitzer IRAC and MIPS observations of this region were obtained from the Spitzer archive and reduced using moped and customized scripts for flat fielding. The limiting AB magnitudes (Oke 1974) in the IRAC bands are 24.0, 23.2, 21.4, and 20.1 at 3.6 m, 4.5 m, 5.8 m, and 8.0 m, respectively, while the 24 m catalog is complete to a flux density of 100 Jy. The multicolor photometry in the and in the first three IRAC bands was used to estimate the photometric redshifts of the -band selected galaxies. The hyperz code (Bolzonella et al. 2000) was used with the four local templates from Coleman et al. (1980) augmented by a blue young 100 Myr starburst synthetic template and a Calzetti et al. (2000) reddening extinction law was assumed. Comparison with a limited spectroscopic sample of 28 galaxies with gives a median of 0.017 and a semi-interquartile range of 0.072. The photometric-redshift distribution for the EROs in the area covered by Chandra (see section 4.1) is consistent overall with that obtained in past works on spectroscopic observations of EROs (e.g., Cimatti et al. 2002). Unfortunately, the redshift information about the selected EROs is limited: only one ERO is detected by Chandra (see section 4), which has an -band magnitude of 23.3, and an optical spectrum tentatively identified as that of a broad-line AGN at on the basis of the Mg ii 2798Å emission line. Although this spectral line is the only line reliably detected in the VIMOS spectrum, we note that the photometric-redshift solution for this source is consistent with this value ( 1.21).
3 Chandra data
The Chandra observations of the “Daddi field” consist of a mosaic of three partially overlapping pointings of 30 ks each. These observations cover a total area of 500 arcmin2; while 45% of this area has a nominal exposure of 60 ks, 110 arcmin2 are close to the maximum 90 ks exposure. This observational strategy was chosen as being a good compromise between the surveyed area (similar to the inner 11′ of the XMM-Newton observations used in B05) and the X-ray flux limit.
3.1 Data reduction
These three observations (OBS-IDs 5032, 5033, and 5034) were performed in June 2004 by the Advanced CCD Imaging Spectrometer (ACIS; Garmire et al. 2003) with the I0 CCD at the aimpoint and all ACIS-I CCDs in use. Faint mode was used for the event telemetry, and ASCA grade 0, 2, 3, 4, and 6 events were used in the analysis, which was carried out using CIAO version 3.4.2 with the latest relevant calibration products (CALDB 3.3.0). The event files were filtered to remove the limited number of flares (a few hundred seconds) and cleaned of hot pixels.
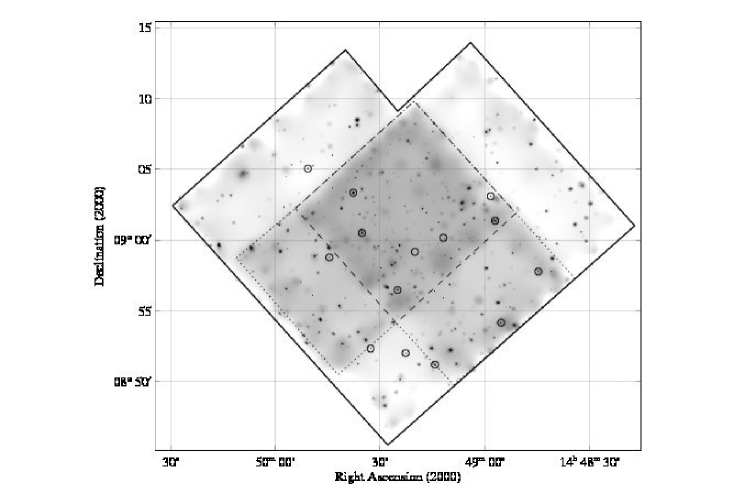
For each observation, we produced instrument maps, exposure maps, and images in the soft band (SB=0.5–2 keV), hard band (HB=2–8 keV), and full band (FB=0.5–8 keV), following the recipes of the Chandra threads111See http://cxc.harvard.edu/ciao/threads.. The exposure maps were computed using, as a spectral template, a power law with photon index =1.8 and then combined using the script and the OBS-ID=5034 observation as a reference imaging, in a similar way to analysis of the science images. The final Chandra mosaic in the 0.5–8 keV band is shown in Fig. 1. The X-ray centroids were checked for systematic errors with respect to the optical positions of bright sources in the field, similarly to B05, and found that no relevant correction should be applied to the X-ray data.
Source detection was carried out with wavdetect (Freeman et al. 2002), using wavelet transforms (with wavelet scale sizes of 1, 1.4, 2, 2.8, 4, 5.7, 8.0, and 11.3 pixels) and a false-positive probability threshold of 10-6 on the 1-arcsec binned mosaic image in the soft, hard, and full band, after removing the DETNAM keyword from the headers; this corresponds to a “blind” detection where counts are extracted without taking into account the Point Spread Function (PSF) at the source positions (which would represent the merging of multiple PSFs in the mosaic images). This detection procedure generated a source list in the three separate bands, and the resulting catalogs were processed by the ACIS Extract (ae)222The ACIS Extract software package and User’s Guide are available online at the web site http://www.astro.psu.edu/xray/docs/TARA/ae_users_guide.html. software package (v. 1.31; Broos et al. 2008) to extract PSF-corrected source and background counts, fluxes, and X-ray spectra. The advantage of this strategy consists of using, on a source-by-source basis, the effective PSF (normalized by the source counts) at the source position, retaining also information about the shape of the PSF. A comparison of the results of “standard” aperture photometry and ae photometry in the CDF-N (using Chandra exposures) for a much larger source sample indicated good agreement, especially for sources above 40 full-band counts (F. Bauer, private communication).
3.2 X-ray source catalog
We detected 133, 92, and 154 sources in the SB, HB, and FB, respectively. We visually checked these sources and removed 23 sources that were clearly spurious (mostly PSF wings) or too close to chip gaps or the instrument field-of-view to derive accurate photometry. By matching the X-ray sources in the three bands using a variable radius (2 arcsec in the innermost regions and 4 in the outermost regions) and visual inspection, we then found 138 X-ray sources in the FB (80% of which were also detected in the SB and HB) and an additional 3 and 8 sources with detections only in the SB and HB, respectively, for a total number of 149 X-ray sources. None of these sources appears extended (as expected, given the detection algorithm and the scales used), although extended X-ray emission is present in these Chandra observations as well as in the XMM-Newton pointings (Finoguenov et al., in preparation). At first sight, the number of sources detected in only the HB may appear large compared to other fields (e.g., one source in the CDF-N, Alexander et al. 2003; three sources in C-COSMOS, Elvis et al. 2009), but we note that the detection process and the association of sources detected in different bands differ throughout the literature. This number might be a simple fluctuation; however, we note that it is not inconsistent with expectations from the X-ray background synthesis models (XRB; Gilli et al. 2007) at the X-ray fluxes probed by our observations. The sources detected only in the HB are real after visual inspection, are extremely faint in X-rays, and were not detected by XMM-Newton because they were below the limiting flux (see B05).
In the region in common between our mosaic and the XMM-Newton observations (those actually used by B05, i.e., the inner 11′ of the EPIC field-of-view), we have 138 X-ray sources from Chandra and 96 sources from XMM-Newton (in the 0.5–10 keV band). Only 78 of the XMM-Newton sources were also detected by Chandra; for the 18 sources detected only by XMM-Newton, approximately two-thirds are in Chandra low-exposure regions (of below 30 ks), while the remaining sources are close to the chip gaps. The large number of sources detected only by Chandra in the region in common can be explained by the higher sensitivity of ACIS.
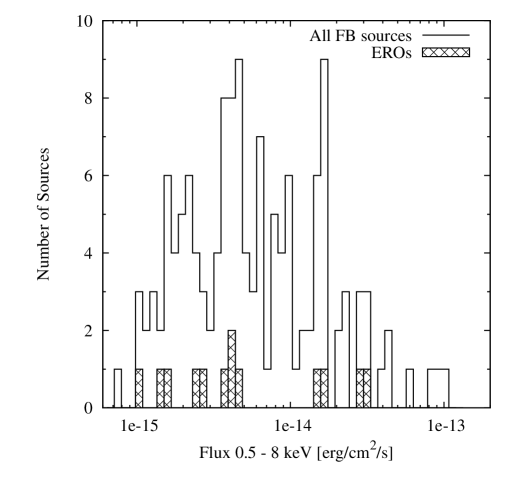
For all of the X-ray sources detected by Chandra and reported in the Appendix, we assume, as count rate-to-X-ray flux conversion, for the FB sources, typical of unabsorbed AGN (e.g., Page et al. 2003; Piconcelli et al. 2005), while and are adopted for the sources detected only in the SB and HB, respectively. For the FB sample, we report the 0.5–8 keV flux distribution in Fig. 2. The derived FB flux limit is .
In addition to fluxes, we can obtain approximate X-ray spectral information by calculating the hardness ratio, defined as
where H and S are the count rates in the hard (2–8 keV) and soft (0.5–2 keV) bands, respectively. The results are reported in section 4.1 and in the Appendix.
Using the -band catalog (see section 2), we found 56 X-ray sources with NIR counterparts within a matching radius of 3′′. For the majority of the X-ray sources, the optical counterpart is within a distance of 1′′, because of the high accuracy of the positions provided by Chandra.
| ID | XID | XMM ID | RA | DEC | HR | F | ||||
| (deg) | (deg) | (mag) | (mag) | (mag) | ( ) | |||||
| 4012 | 12 | 273 | 222.185975 | 8.962944 | 24.63 | 18.61 | 6.02 | 4.00E-15 | 1.52 | |
| 3690 | 20 | 344 | 222.230500 | 8.902914 | 23.36 | 17.81 | 5.55 | 4.19E-15 | 1.11 | |
| 3629 | 23 | 195 | 222.237642 | 9.022706 | 24.11 | 18.33 | 5.78 | 1.53E-14 | 1.50 | |
| 3137 | 48 | 222.299196 | 9.002874 | 24.94 | 18.81 | 6.13 | 1.00E-15 | 1.55 | ||
| 3009 | 51 | 239 | 222.309454 | 8.853264 | 23.96 | 18.24 | 5.72 | 1.73E-14 | 1.08 | |
| 2760 | 64 | 237 | 222.333292 | 8.986256 | 24.93 | 19.11 | 5.82 | 1.35E-15 | 1.62 | |
| 2663 | 69 | 222.344513 | 8.866972 | 25.15 | 19.13 | 6.02 | 2.58E-15 | |||
| 2591 | 73 | 293 | 222.354121 | 8.941257 | 24.26 | 19.14 | 5.12 | 3.64E-15 | 1.69 | |
| 2267 | 89 | 310 | 222.386204 | 8.872362 | 24.94 | 19.07 | 5.87 | 4.69E-15 | 1.81 | |
| 2160 | 93 | 209 | 222.396533 | 9.008494 | 23.27 | 18.09 | 5.18 | 2.83E-14 | 1.12a | |
| 2073 | 103 | 148 | 222.406892 | 9.055835 | 25.24 | 18.77 | 6.47 | 3.00E-14 | 2.53 | |
| 1777 | 111 | 250 | 222.435442 | 8.979769 | 23.50 | 18.48 | 5.02 | 0.72 | 2.46E-15 | 1.65 |
| 1557 | 121 | 222.461171 | 9.084203 | 24.06 | 18.61 | 5.45 | 1.66E-15 | 1.13 | ||
| ERO detected only in the hard band | ||||||||||
| F | ||||||||||
| 3590 | 142 | 222.243017 | 9.051691 | 23.29 | 18.09 | 5.20 | 3.76E-15 | 1.07 | ||
Notes — ID and XID indicate the optical/NIR and X-ray identification number, respectively; XMM ID provides the association to the B05 catalog based on XMM-Newton observations. Coordinates are referred to the position of the associated NIR counterpart. Sources detected in the FB only have no HR entry. a Tentative spectroscopic redshift based on the Mg ii 2798Å emission line (see section 2 for details). The photometric redshift for this source is =1.21. Only one source (ID=2663) has no photometric redshift, because of the lack of IRAC coverage.
4 Identification of the X-ray emitting EROs and their properties
One purpose of this work is to establish the fraction of X-ray emitting EROs in a large and clearly defined sample of relatively bright EROs and their overall properties, taking advantage of the moderately deep flux limit achieved by the Chandra exposures. Among the 288 EROs in the three-pointing Chandra mosaic, we found 14 EROs with X-ray emission (with net counts ranging from 5 to 240) using a variable matching radius of 2′′–4′′ to account for the PSF broadening at large off-axis angles. Visual inspection of the matched sources using - and -band images provided further support to the associations, most of which are at NIR-to-X-ray distances below 1′′. Only two sources have displacements of 4′′ because of their large off-axis positions and faint X-ray emission.
Eight X-ray detected EROs are associated with star-forming (sBzK), while one source (#2663) is a passively evolving galaxy (pBzK), according to the photometric technique used by Daddi et al. (2004) to select star-forming and passive galaxies at . We note that all of the eight EROs classified as sBzK have photometric redshifts above 1.4 in Table 1, while the only pBzK has no photometric-redshift solution. We note that in the Chandra mosaic there are 122 sources classified as sBzK (51 of which also match the ERO definition) compared to 27 pBzK, (which are, unsurprisingly, all EROs. For comparison, see Greve et al. 2009). Among the sBzK sources, 28 ( 23%) have X-ray emission (in particular, 8 of the 51 sBzK galaxies are also classified as EROs, i.e. 16% have X-ray emission), while only one pBzK (ERO ; see above) has X-ray emission (i.e., 3.7%). Given the flux limit reached by the Chandra observations, it is likely that most of these X-ray emitting sBzK sources host an AGN. The contamination of the BzK diagram by bright AGN is a known issue (e.g., Daddi et al. 2004, 2007; Reddy et al. 2005; Kong et al. 2006); for these objects, the nuclear emission can increase the -band flux significantly, thus placing the sources in the sBzK range. We have also checked whether the colors of the only X-ray detected pBzK could be consistent, given the photometric uncertainties, with those of the other sBzK galaxies, but this is not the case.
Of the 14 EROs detected by Chandra (13 in the FB and one in the HB only; see Table 1 and dashed histogram in Fig. 2), all but four were also detected in the XMM-Newton observations presented by B05 (one of these only in the soft band); the four undetected EROs were just below the flux limit of the XMM-Newton observations. We note, however, that four EROs detected by both Chandra and XMM-Newton were not classified as such according to the catalog used by B05 because of the slightly different optical and near-IR photometry.
The EROs detected by Chandra represent of the ERO sample (for comparison, XMM-Newton detected ) and of the X-ray source population (compared to in the XMM-Newton observations). Despite there being apparently similar fractions of X-ray detected EROs between Chandra and XMM-Newton, we note that the original optical/NIR catalog used for ERO selection in B05 and in this work differ. Besides that, Chandra is able to detect much fainter sources than XMM-Newton but only within limited area they surveyed; the strength of Chandra is maximized for the definition of the X-ray faint ERO properties, mostly due to the lower background.
4.1 X-ray properties of the EROs
All of the EROs associated with X-ray sources are reported in Table 1, while their photometric-redshift distribution is shown in Fig. 3.
Using a Kolmogorov-Smirnov (KS) test, we can compare the photometric-redshift distribution of X-ray detected EROs with the overall population in our Chandra mosaic (Fig. 3); the resulting probability that the two samples are drawn from the same parent population is relatively low (). This result is also suggested by the average redshift of the two samples: while EROs with X-ray emission have (median =1.52), the remaining EROs have a lower average redshift (; median =1.11). The higher redshift range of X-ray emitting EROs might be interpreted as evidence that more luminous sources (hence, probably more massive galaxies, as a preliminary study of the masses of these galaxies seems to suggest) host an AGN more often, although the possibility that photometric redshifts are biased toward higher values for luminous sources is a viable explanation, as tentatively suggested by ERO . Clearly, the limited number of EROs with X-ray emission in the current sample (and also in the literature) prevents us from drawing firm conclusions about this issue and demands further investigation of larger samples.
For each source, Table 1 provides the optical/NIR and Chandra identification numbers (ID and XID), the ID in the XMM-Newton catalog presented by B05, the NIR position, the and -band magnitudes, the color, the hardness ratio, the FB (HB) flux, and the photometric redshift.
The average (median) HR value for the EROs, after excluding the upper and lower limits from the computation,333Average values in the case of censored data can be calculated using asurv (LaValley et al. 1992), which cannot be used when both upper and lower limits are present. is (), while for all other sources detected in the three bands it is (). In Fig. 4, we report the hardness ratio versus FB flux for all the sources in the field (open diamonds) and for the EROs (filled triangles), along with the photon indices (horizontal dotted lines in the figure) corresponding to given HR values (based on the assumption of a simple power-law model with ). Below a FB flux of , we note that EROs seem to have higher HR values, suggesting flatter photon indices, hence possible obscuration, as the average X-ray spectrum (section 4.2.1) appears to indicate.


In the following, we divide the sample of X-ray detected EROs in two subsamples, the former comprising the three X-ray brightest sources (100 net counts) and the latter including the remaining 11 EROs with faint X-ray emission. We also provide X-ray constraints on the population of the individually X-ray undetected EROs by means of a stacking analysis.
In all of the following analyses, source counts were extracted using the ae package described in section 3.1. The redistribution matrix files (RMFs, which include information about the detector gain and energy resolution) and the ancillary response files (ARFs, which include information about the effective area of the instrument, filter transmission and any additional energy-dependent efficiencies) from each observation were summed and weighted properly.
4.2 The X-ray “bright” subsample
We were able to extract a moderate-quality X-ray spectrum for only three EROs, namely , , and (see Fig. 8 in the Appendix).
Spectral counts were accumulated in energy bins with at least 10–20 counts per bin over the energy range 0.5–8 keV, although limited signal was typically present above 4 keV. Spectral analysis was carried out using xspec (version 12.4.0; Arnaud 1996) and the statistic. Galactic absorption (NH=2.0 cm-2; Dickey & Lockman 1990) was included in all the spectral fittings. Errors are reported at the 90% confidence level for one parameter of interest (Avni 1976).
While the first two spectra are characterized by photon indices typical of unobscured AGN (=1.72 and =1.62, respectively), with marginal evidence for absorption in the source (rest-frame column density of 1.42 cm-2; in this case, the photon index would become 2.0), the third source is harder, with =0.82. For this ERO, the fit improves by for one additional parameter when the absorption is taken into account (NH=1.63 cm-2 at ; ). Assuming their photometric redshifts, these sources would have de-absorbed, rest-frame 2–10 keV luminosities of 11.0, 1.3, and 5.0 erg s-1, respectively. If, on the other hand, a lower redshift () is assumed (which can be considered as a lower limit, given their colors), these sources would still be in the quasar regime (i.e., above erg s-1 in the rest-frame 2–10 keV band).
4.2.1 The X-ray “faint” subsample
Given the paucity of counts for all of the remaining X-ray detected EROs, we decided to investigate their average spectral properties. For each source, X-ray spectra extracted from the different Chandra pointings were combined using the ftool mathpha; similarly, response matrices were combined using the addrmf and addarf tasks. The total number of net counts for these 11 sources is 170.
A stacked spectrum was produced by deredshifting the individual spectra using the photometric redshifts (see Table 1), available for all but one of these EROs. Each spectrum was binned into 17 spectral channels, which correspond to those with a 0.5 keV resolution in the rest-frame 1.7–10.2 keV band, and corrected for the detector response curve. These spectra were summed together after matching the energy scale according to the redshift, and the data of low signal-to-noise ratio were further rebinned. The source with no redshift information is assumed to have a redshift =1.53, the median value of the other 10 sources.
A single power-law model provides a relatively good fit; the resulting photon index is flat (=1.10). The inclusion of absorption produces a fit of comparable quality and the following spectral parameters: and an upper limit to the rest-frame column density of 6.4 cm-2 (see Fig. 9 in the Appendix). Fixing the photon index to =1.8 provides a column density of 2.4 cm-2, which is consistent with the lack of reliable signal below 2 keV. Assuming the spectral modeling described above, the average de-absorbed rest-frame 2–10 keV luminosity would be erg s-1, which is clearly associated with AGN emission.
We note that similar spectral results, within the errors, are obtained by fitting the unbinned data with the Cash statistic (Cash 1979).
4.3 Average properties of the X-ray undetected EROs using a stacking analysis
To constrain the average X-ray properties of the remaining 274 individually undetected EROs, we applied a stacking technique (e.g., Brandt et al 2001; Nandra et al. 2002; Brusa et al. 2002; Alexander et al. 2005). This technique consists of adding together the faint (if any) contribution from each source at the corresponding optical/NIR position to estimate the average properties of the remaining ERO population, which probably comprises faint and obscured AGN, normal galaxies, and dust-enshrouded starbursts (e.g., Alexander et al. 2002). Unlike most of the X-ray stacking analysis results published, we preferred to adopt a variable extraction radius to account, on a source-by-source basis, for the variable PSF at different off-axis positions in each of the three pointings, using the ae tools. As an additional check, we also adopted count extraction from fixed-radius (5′′) regions to verify, to first order, our stacking results.
During the stacking process, all of the known (i.e., already detected) X-ray sources were masked carefully (i.e., on the basis of the number of counts and PSF size) to avoid spurious contamination of the stacked signal by the PSF wings. The total exposure of the stacked EROs corresponds to 11.9 Ms. Among the three bandpasses chosen for the stacking analysis, the highest signal is in the 0.5–2 keV band ( 6.2) and provides 120 net counts; a 5.7 signal is obtained over the entire 0.5–8 keV band ( 180 net counts). In the HB, a signal of 2.5 is observed. Although deeper X-ray observations would be useful to place stronger constrains on the undetected ERO population, we note that probably only deep fields (like the CDF-N and the Chandra Deep Field-South, CDF-S) can provide a truly significant step in this direction. Within the statistics of this number of source counts, we derived an average photon index and an upper limit to the column density of 2.5 cm-2 (at =1). If =1.8 is assumed, the 0.5–8 keV flux ( ) translates into a rest-frame (=1) luminosity of 8.9 erg s-1 (1.1 erg s-1 at the median redshift =1.11), suggestive of a likely combination of both accretion processes (low-luminosity and/or obscured AGN) and thermal processes for the majority of the ERO population. Similar values are obtained if the average photometric redshift for these EROs (=1.28) is assumed. The results derived using fixed-radius aperture photometry are similar, once the statistical uncertainties are taken into account. However, caution is needed when results from stacking analysis of individually undetected sources are presented. First of all, the broad redshift range of the ERO population strongly limits the “definition” of the low-energy photo-electric cut-off (hence of the obscuration) in the stacked spectrum. Secondly, given the possibly broad, intrinsic column density distribution of EROs, it is plausible that the resulting absorption is shifted towards lower values than the true median of the sample because most detected counts presumably come from sources with low absorption; we note, however, that none of the stacked sources seems to dominate the resulting X-ray signal.
To support our results, we also generated one-hundred catalogs of 274 fake sources, each randomly placed across the Chandra mosaic (once the real X-ray sources had been masked properly), and produced stacked results using fixed-radius (5′′) aperture photometry to assess the relevance of our stacking results on individually undetected EROs. We found that all mock catalogs but one have a number of net counts (source counts after background removal) below 20, the only exception having 100 net counts (i.e., lower than for our stacked EROs) in the full band. Therefore, simulations provide further support to the stacking analysis of the X-ray undetected EROs.
Since X-ray-detected EROs appear to have a photometric-redshift distribution that peaks at higher values than the rest of the ERO population (section 4.1), we divided the sample into a high-redshift and a low-redshift subsamples, where the dividing threshold was chosen to be =1.4. Once the EROs without photometric redshift information had been excluded, the high- and low-redshift samples comprised 47 and 184 sources, respectively. For the sample, a stacked signal was detected in the FB and SB (at the 4.5 and 3.7 significance level, respectively), while the HB signal is significant at the 2.8 level. On the basis of the FB count rate and the assumption of a power-law spectrum with , we obtained a flux of 3.5 , which translates, at the source median redshift of =1.72, into a rest-frame 0.5–8 keV luminosity of 6.9 erg s-1, consistent with AGN emission. We note that the stacked signal of EROs at , taken at face value, provides a HR which, for the hypothesis of a power-law model and absorption intrinsic to the source, may be interpreted as being caused by a column density of cm-2 at .
On the other hand, the stacked emission from the more numerous ERO population is characterized by lower significance (2.8, 3.7, and 0.8 in the FB, SB, and HB, respectively). At the median redshift of =1.04, the flux from the stacked FB signal (9.1 ) is converted into a rest-frame 0.5–8 keV luminosity of 5.4 erg s-1, which, taken at face value, is indicative of activity unrelated to accretion processes (although low-luminosity AGN may be present in this ERO sample). The absence of signal in the HB seems to support this interpretation.
5 Discussion
5.1 High X/O sources among the ERO population sampled by Chandra
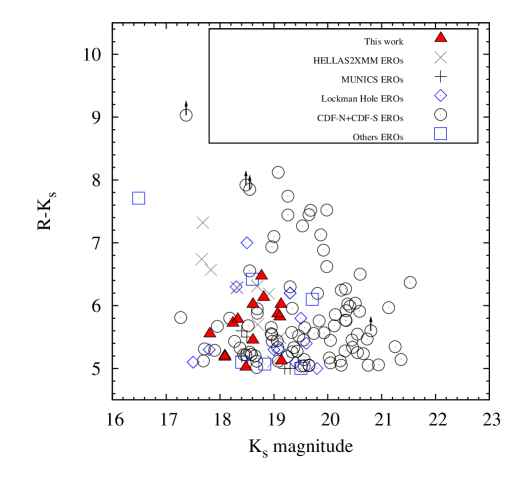
A comparison with data for some ERO samples from the literature shows that EROs in the “Daddi field” are not extreme, both in terms of color (none has 7) and magnitude (all have relatively “bright” magnitudes; see Fig. 5). In the following, we try to provide a comprehensive picture of EROs from the X-ray perspective, also using information from available literature samples.
A significant correlation between the properties of EROs and high X-ray-to-optical (X/O)444The X-ray-to-optical flux ratio (X/O) can be written (e.g., Hornschemeier et al. 2001) as: (1) where is the flux in the X-band (0.5–8 keV in our case) and is the optical magnitude. flux ratio sources has been found.

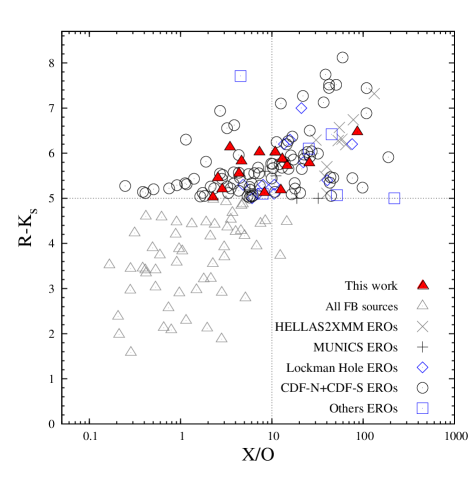
Most typical AGN have (i.e., lie in the region bounded by the two diagonal lines in Fig. 6; see Maccacaro et al. 1988), while normal galaxies and starbursts populate the locus (i.e., below the lower line in Fig. 6). The present sample of X-ray detected EROs covers the X-ray flux intervals of other XMM-Newton-based studies (e.g., the HELLAS2XMM survey, Mignoli et al. 2004; MUNICS, Severgnini et al. 2005), and partially overlaps with the bright tail of the Chandra deep-field source distribution. Since high X/O objects are typically high-redshift (), luminous ( erg s-1), and obscured (N cm-2) AGN (e.g., Fiore et al. 2003), it seems likely that a significant fraction of EROs with high X/O are Type 2 quasars. In particular, as also shown in Fig. 7, 6/14 EROs ( 43%) have high X/O. Among these, we find the three EROs with the highest counting statistics, whose X-ray spectral analysis (discussed in section 4.2) provides tentative evidence of obscuration in the source #2160 and likely presence in the source #3629 (as also supported by its HR; see Table 1); their X-ray luminosities are also typical of quasars. Overall, given the low counting statistics for most of our EROs, it is difficult to place strong constraints on the ERO column density distribution on the basis of the HR and to further assess the presence of obscured AGN among the high X/O sources.
5.2 X-ray emission from EROs: comparison with previous work
The X-ray analysis carried out in this work has shown that a fraction of EROs, mostly at faint X-ray fluxes, is probably obscured, although no indication of Compton-thick absorption (i.e., of column density above 1024 cm-2; e.g., Comastri 2004) has been found in the combined spectrum of 11 X-ray weak EROs (see section 4.2.1). This result confirms previous findings for Chandra and XMM-Newton observations of EROs (e.g., Alexander et al. 2002; Vignali et al. 2002; Stevens et al. 2003; B05; Severgnini et al. 2005; Del Moro et al. 2009), i.e., the presence of obscuring matter in a significant fraction of X-ray detected EROs, at least above 10-15 (see Brusa 2004 for details). This is confirmed by Fig. 7, where the X/O ratio is plotted versus the color; in this figure, 50% of EROs have X/O10. One, or possibly two, of the X-ray brightest EROs (in the quasar regime) in the “Daddi field” are likely to be obscured (with column density of up to cm-2 for source #3629), thus being Type 2 quasars; similarly, the average X-ray properties of the population of X-ray weak EROs are consistent with obscured AGN emission (N 2.4 cm-2, assuming ). Also the hardness-ratio analysis provides evidence of obscuration, although with even larger uncertainties: the average HR for all of the X-ray detected EROs (excluding upper and lower limits) is larger than for the remaining X-ray sources. Besides the uncertainties in deriving column densities from sources with limited redshift information, we note that high signal-to-noise X-ray observations of Seyfert galaxies and quasars suggest that the “single power-law assumption”, typically adopted in studies based on HR, may be too crude to reproduce properly the X-ray emission (hence, the spectral parameters) of our AGN, although the likely redshift above =1 strongly limits the influence of any soft excess in the observed energy band.
The high sensitivity of the Chandra observations to point-like source detection, coupled with their high spatial resolution and low background, have also allowed us to place constraints on the average properties of the individually undetected EROs by a stacking analysis. Although at faint X-ray flux limits, we expect to find a higher contribution to the X-ray emission from passively evolved galaxies and dusty-enshrouded galaxies (e.g., Alexander et al. 2002; Brusa et al. 2002; Roche et al. 2006; see also Ranalli et al. 2003), our stacking analysis seems to identify a non-negligible contribution from obscured and/or low-luminosity AGN emission; a model fit to the stacked spectrum of X-ray undetected EROs indeed provides an upper limit of cm-2 to the column density (at =1) and an overall source luminosity of erg s-1.
6 Summary
We have presented three Chandra observations in the “Daddi field” ( 30 ks exposure each),
down to a 0.5–8 keV flux limit of .
Here is a summary of our main results:
We have detected 149 X-ray sources, 14 of which are classified as EROs (13 detected in the FB and
one in the HB only). The fraction of X-ray detected EROs corresponds to 9% of the overall X-ray source
population and to 5% of the ERO population.
Under the reasonable assumption that EROs are located at ,
the X-ray emission of all of the X-ray detected EROs is consistent with their being AGN
( erg s-1 at ), at least the three X-ray brightest EROs
lying in the quasar luminosity range (i.e., above 1044 erg s-1).
Moderate-quality X-ray spectral analysis was possible overall for the three X-ray brightest EROs
and the 11 X-ray faintest EROs. Spectral results are consistent with
obscuration in one, possibly two, of the X-ray brightest EROs (of column density as high as 1023 cm-2),
and in the subsample of X-ray weak EROs
( cm-2), assuming .
We also took advantage of the good spatial resolution and limited background provided by the Chandra data to place constraints on the population of the 274 X-ray undetected EROs in the Chandra observations by means of a stacking analysis. Modeling the stacked spectrum of these EROs with an absorbed power law provides an upper limit of cm-2 to the column density (at =1); the derived X-ray signal corresponds to a rest-frame 0.5–8 keV luminosity of 8.9 erg s-1. It seems likely that the underlying ERO population consists of: (i) normal galaxies; (ii) bright dusty starburst galaxies, whose emission is related to star-forming processes (see Ranalli et al. 2003); and (iii) accretion-powered sources, providing support for X-ray stacking analyses on deeper fields. To first order, this result is confirmed by stacking each of the and ERO populations separately; while the higher redshift EROs have a stacked signal of significance 4.5 and 3.7 in the FB and SB, respectively (2.8 in the HB), and a corresponding rest-frame 0.5–8 keV luminosity well above erg s-1 at the median =1.72 (hence consistent, on average, with AGN emission), the lower redshift ERO population is formally detected above 3 only in the SB (2.8 in the FB) and its average flux corresponds to a 0.5–8 keV luminosity of 5.4 erg s-1. This value suggests a prevailing contribution from emission mechanisms unrelated to nuclear accretion, albeit some low-luminosity AGN may be present as well.
Acknowledgements.
The authors would like to thank F.E. Bauer and P. Broos for their support to the ae package, K. Iwasawa for providing the rest-frame spectrum of X-ray faint EROs, G. Lanzuisi for help with XMM-Newton data analysis, P. Ranalli for suggestions on X-ray stacking analysis, P. Severgnini for thoughtful discussion and providing data points for Fig. 7, G. Zamorani for useful discussion, and the referee for his/her careful reading of the manuscript and good suggestions. CV thanks D. Wilman for the great organization of the CNOC2 meeting in 2007 and the MPA/MPE institutes for their kind hospitality over the last two years. CV and AC acknowledge financial support from the Italian Space Agency (contracts ASI–INAF I/023/05/0 and ASI I/088/06/0) and PRIN–MIUR (grant 2006-02-5203); ED acknowledges the support of French ANR-08-JCJC-0008, and DMA of the Royal Society. NA is supported by a Grant-in-Aid for Science Research from JSPS (No.19540245).References
- (1) Alexander, D. M., Vignali, C., Bauer, F. E., et al. 2002, AJ, 123, 1149
- (2) Alexander, D. M., Bauer, F. E., Brandt, W. N., et al. 2003, AJ, 126, 539
- (3) Alexander, D. M., Bauer, F. E., Chapman, S. C., et al. 2005, ApJ, 632, 736
- (4) Arnaud, K.A. 1996, in Jacoby G., Barnes J., eds, ASP Conf. Ser. Vol. 101, Astronomical Data Analysis Software and Systems V. Astron. Soc. Pac., San Francisco, p. 17
- (5) Avni, Y. 1976, ApJ, 210, 642
- (6) Barger, A. J., Cowie, L. L., Capak, P., et al. 2003, AJ, 126, 632
- (7) Bertin, E., & Arnouts, S. 1996, A&A, 117, 393
- (8) Bolzonella, M., Miralles, J.-M., & Pelló, R. 2000, A&A, 363, 476
- (9) Brandt, W. N., Hornschemeier, A. E., Schneider, D. P., et al. 2001, ApJ, 558, L5
- (10) Broos, P., Townsley, L., Getman, C., & Bauer, F. 2008, “ACIS Extract: ACIS Point Source Extraction Package User’s Guide”
- (11) Brown, M. J. I., Jannuzi, B. T., Dey, A., & Tiede, G. P. 2005, ApJ, 621, 41
- (12) Brusa, M., Comastri, A., Daddi, E., et al. 2002, ApJ, 581, L89
- (13) Brusa, M., Comastri, A., Mignoli, M., et al. 2003, A&A, 409, 65
- (14) Brusa, M. 2004, PhD Thesis (astro-ph/0406435)
- (15) Brusa, M., Comastri, A., Daddi, E., et al. 2005, A&A, 432, 69
- (16) Calzetti, D., Armus, L., Bohlin, R. C., et al. 2000, ApJ, 533, 682
- (17) Caputi, K. I., Dunlop, J. S., McLure, R. J., & Roche N. D. 2005, MNRAS, 361, 607
- (18) Cash, W. 1979, ApJ, 228, 939
- (19) Cimatti, A., Daddi, E., Mignoli, M., et al. 2002, A&A, 381, L68
- (20) Cimatti, A., Daddi, E., Cassata, P., et al. 2003, A&A, 412, L1
- (21) Coleman, G. D., Wu, C.-C., & Weedman, D. W. 1980, ApJS, 43, 393
- (22) Comastri, A. 2004, in “Supermassive Black Holes in the Distant Universe”, ed. A.J. Barger, Kluwer Academic Press, Vol. 308, p. 245
- (23) Crawford, C. S., Gandhi, P., Fabian, A. C., et al. 2002, MNRAS, 333, 809
- (24) Daddi, E., Cimatti, A., Pozzetti, L., et al. 2000, A&A, 361, 535
- (25) Daddi, E., Cimatti, A., Renzini, A., et al. 2004, ApJ, 617, 746
- (26) Daddi, E., Alexander, D. M., Dickinson, M., et al. 2007, ApJ, 670, 173
- (27) Del Moro, A., Watson, M. G., Mateos, S., et al. 2009, A&A, 493, 445
- (28) Dickey, J.M., & Lockman, F.J. 1990, ARA&A, 28, 215
- (29) Dunne, L., Ivison, R. J., Maddox, S., et al. 2009, MNRAS, 394, 3
- (30) Ebeling, H., White, D. A., & Rangarajan, F. V. N. 2006, MNRAS, 368, 65
- (31) Elston, R., Rieke, G. H., & Rieke, M. J. 1988, ApJ, 331, L77
- (32) Elvis, M., Civano, F., Vignali, C., et al. 2009, ApJ, submitted (arXiv:0903.2062)
- (33) Fang, G.-W., Kong, X., & Wang, M. 2009, Research in Astronomy and Astrophysics, 9, 59
- (34) Fiore, F., Brusa, M., Cocchia, F., et al. 2003, A&A, 409, 79
- (35) Fiore, F., Grazian, A., Santini, P., et al. 2008, ApJ, 672, 94
- (36) Fiore, F., Puccetti, S., Brusa, M., et al. 2009, ApJ, 693, 447
- (37) Fontana, A., Donnarumma, I., Vanzella, E., et al. 2003, ApJ, 594, L9
- (38) Freeman, P. E., Kashyap, V., Rosner, R., & Lamb, D. Q. 2002, ApJS, 138, 185
- (39) Gandhi, P., Crawford, C. S., Fabian, A. C., & Johnstone, R. M. 2004, MNRAS, 348, 529
- (40) Garmire, G. P., Bautz, M. W., Ford, P. G., Nousek, J. A., & Ricker, G. R., Jr. 2003, Proc. SPIE, 4851, 28
- (41) Georgakakis, A., Afonso, J., Hopkins, A. M., et al. 2005, ApJ, 620, 584
- (42) Gilli, R., Comastri, A., & Hasinger, G. 2007, A&A, 463, 79
- (43) Greve, T. R., et al. 2009, ApJ, submitted (arXiv:0904.0028)
- (44) Hornschemeier, A. E., Brandt, W. N., Garmire, G. P., et al. 2001, ApJ, 554, 742
- (45) Kong, X., Daddi, E., Arimoto, N., et al. 2006, ApJ, 638, 72
- (46) Kraft, R. P., Burrows, D. N., & Nousek, J. A. 1991, ApJ, 374, 344
- (47) Imai, K., Pearson, C. P., Matsuhara, H., et al. 2008, ApJ, 683, 45
- (48) LaValley, M., Isobe, T., & Feigelson, E. D. 1992, in ASP Conf. Ser. 25, Astronomical Data Analysis Software and Systems, ed. D. M. Worrall, C. Biemesderfer, & J. Barnes (San Francisco: ASP), 245
- (49) Maccacaro, T., Gioia, I. M., Wolter, A., Zamorani, G., & Stocke, J. T. 1988, ApJ, 326, 680
- (50) Mainieri, V., Bergeron, J., Hasinger, G., et al. 2002, A&A, 393, 425
- (51) Mainieri, V., Rosati, P., Tozzi, P., et al. 2005, A&A, 437, 805
- (52) Mannucci, F., Pozzetti, L., Thompson, D., et al. 2002, MNRAS, 329, L57
- (53) McCarthy, P. J. 2004, ARA&A, 42, 477
- (54) Mignoli, M., Pozzetti, L., Brusa, M., et al. 2004, A&A, 418, 827
- (55) Nandra, K., Mushotzky, R. F., Arnaud, K., et al. 2002, ApJ, 576, 625
- (56) Oke, J. B. 1974, ApJS, 27, 21
- (57) Page, K. L., Turner, M. J. L., Reeves, J. N., O’Brien, P. T., & Sembay, S. 2003, MNRAS, 338, 1004
- (58) Piconcelli, E., Jimenez-Bailón, E., Guainazzi, M., Schartel, N., Rodríguez-Pascual, P.M., & Santos-Lleó, M. 2005, A&A, 432, 15
- (59) Pierre, M., Lidman, C., Hunstead, R., et al. 2001, A&A, 372, L45
- (60) Pozzetti, L., & Mannucci, F. 2000, MNRAS, 317, L17
- (61) Ranalli, P., Comastri, A., & Setti, G. 2003, A&A, 399, 39
- (62) Reddy, N. A., Erb, D. K., Steidel, C. C., Shapley, A. E., Adelberger, K. L., & Pettini, M. 2005, ApJ, 633, 748
- (63) Renzini, A. 2006, ARA&A, 44, 141
- (64) Roche, N. D., Almaini, O., Dunlop, J., Ivison, R. J., & Willott, C. J. 2002, MNRAS, 337, 1282
- (65) Roche, N. D., Dunlop, J., & Almaini, O. 2003, MNRAS, 346, 803
- (66) Roche, N. D., Dunlop, J., Caputi, K. I., McLure, R., Willott, C. J., & Crampton, D. 2006, MNRAS, 370, 74
- (67) Severgnini, P., Della Ceca, R., Braito, V., et al. 2005, A&A, 431, 87
- (68) Severgnini, P., Caccianiga, A., Braito, V., et al. 2006, A&A, 451, 859
- (69) Simpson, C., Almaini, O., Cirasuolo, M., et al. 2006, MNRAS, 373, L21
- (70) Smail, I., Owen, F. N., Morrison, G. E., et al. 2002, ApJ, 581, 844
- (71) Stevens, J. A., Page, M. J., Ivison, R. J., et al. 2003, MNRAS, 342, 249
- (72) Szokoly, G. P., Bergeron, J., Hasinger, G., et al. 2004, ApJS, 155, 271
- (73) Vignali, C., Comastri, A., Fiore, F., & La Franca, F. 2001, A&A, 370, 900
- (74) Vignali, C., Alexander, D. M., Bauer, F. E., et al. 2002, in “Inflows, outflows, and reprocessing around black holes”, Proceedings of the 5th Italian AGN Meeting
- (75) Vignali, C., Alexander, D. M., & Comastri, A. 2006, MNRAS, 373, 321
- (76) Willott, C. J., Rawlings, S., & Blundell, K. M. 2001, MNRAS, 324, 1
- (77) Willott, C. J., Rawlings, S., Jarvis, M. J., & Blundell, K. M. 2003, MNRAS, 339, 397
- (78) Wilson, G., Huang, J.-S., Fazio, G. G., et al. 2007, ApJ, 660, L59
Appendix A X-ray source catalog in the “Daddi field” and X-ray spectra of EROs
| XID | RA | DEC | Counts | Expo | F(0.5–8 keV) | F(0.5–2 keV) | F(2–8 keV) | HR | |
| (deg) | (deg) | (′) | (0.5–8 keV) | (ks) | ( ) | ( ) | ( ) | ||
| 1 | 222.123840 | 9.042500 | 9.5 | 39.4 | 22.2 | 1.63E-14 | 6.00E-15 | 1.41E-14 | |
| 2 | 222.128250 | 8.998556 | 9.3 | 22.4 | 22.2 | 9.25E-15 | 4.98E-15 | 5.29E-15 | |
| 3 | 222.133453 | 9.063889 | 9.2 | 24.0 | 22.6 | 9.71E-15 | 3.80E-15 | 7.84E-15 | |
| 4 | 222.142288 | 9.018167 | 8.4 | 41.6 | 23.2 | 1.65E-14 | 7.75E-15 | 9.71E-15 | |
| 5 | 222.147797 | 9.060167 | 8.3 | 36.6 | 22.1 | 1.52E-14 | 6.36E-15 | 1.11E-14 | |
| 6 | 222.169083 | 8.978500 | 8.4 | 105.7 | 33.4 | 2.90E-14 | 1.48E-14 | 1.39E-14 | |
| 7 | 222.169205 | 9.075861 | 7.4 | 12.3 | 23.2 | 4.84E-15 | 7.96E-16 | 7.47E-15 | |
| 8 | 222.169998 | 8.962806 | 9.0 | 20.9 | 37.2 | 5.14E-15 | 2.13E-15 | 3.83E-15 | |
| 9 | 222.176331 | 9.033833 | 6.4 | 19.3 | 22.9 | 7.71E-15 | 4.83E-15 | 4.34E-15 | |
| 10 | 222.177078 | 9.001167 | 6.5 | 9.6 | 24.7 | 3.56E-15 | 7.45E-16 | 5.01E-15 | |
| 11 | 222.184799 | 9.003861 | 6.0 | 8.9 | 25.2 | 3.23E-15 | 1.88E-15 | 3.88E-15 | |
| 12 | 222.186707 | 8.962855 | 8.4 | 17.8 | 40.7 | 4.00E-15 | 1.72E-15 | 2.80E-15 | |
| 13 | 222.188461 | 9.083556 | 6.6 | 15.5 | 21.9 | 6.50E-15 | 3.57E-15 | 3.17E-15 | |
| 14 | 222.190536 | 9.141583 | 8.9 | 31.9 | 17.4 | 1.68E-14 | 1.04E-14 | 9.81E-15 | |
| 15 | 222.194290 | 9.112861 | 7.5 | 31.0 | 24.5 | 1.16E-14 | 4.12E-15 | 1.06E-14 | |
| 16 | 222.210922 | 9.037639 | 4.4 | 5.6 | 26.7 | 1.93E-15 | 6.85E-16 | 1.99E-15 | |
| 17 | 222.214828 | 8.899639 | 8.8 | 81.5 | 43.9 | 1.70E-14 | 1.29E-15 | 2.84E-14 | |
| 18 | 222.217667 | 8.985028 | 6.4 | 16.5 | 44.7 | 3.36E-15 | 1.62E-15 | 2.71E-15 | |
| 19 | 222.227463 | 8.947083 | 6.6 | 19.2 | 46.6 | 3.77E-15 | 1.60E-15 | 2.72E-15 | |
| 20 | 222.231247 | 8.902083 | 8.1 | 20.6 | 45.1 | 4.19E-15 | 9.26E-16 | 5.38E-15 | |
| 21 | 222.233994 | 8.926028 | 7.0 | 79.9 | 47.4 | 1.55E-14 | 6.76E-15 | 1.06E-14 | |
| 22 | 222.235077 | 9.090778 | 4.9 | 15.6 | 23.4 | 6.10E-15 | 2.33E-15 | 5.18E-15 | |
| 23 | 222.237701 | 9.022778 | 6.8 | 116.0 | 69.6 | 1.53E-14 | 4.71E-15 | 1.59E-14 | |
| 24 | 222.240295 | 9.047250 | 5.1 | 8.5 | 44.6 | 1.75E-15 | 1.09E-15 | 2.47E-15 | |
| 25 | 222.244080 | 9.129583 | 6.7 | 17.4 | 25.3 | 6.30E-15 | 3.10E-15 | 4.12E-15 | |
| 26 | 222.247833 | 8.966861 | 5.2 | 86.0 | 48.2 | 1.64E-14 | 7.77E-15 | 9.45E-15 | |
| 27 | 222.248123 | 9.127222 | 6.5 | 43.6 | 25.5 | 1.57E-14 | 4.32E-15 | 1.80E-14 | |
| 28 | 222.249084 | 8.893778 | 7.7 | 18.4 | 36.6 | 4.61E-15 | 1.16E-15 | 5.53E-15 | |
| 29 | 222.250549 | 9.023861 | 6.4 | 14.2 | 66.2 | 1.97E-15 | 8.25E-16 | 2.85E-15 | 0.11 |
| 30 | 222.253876 | 8.912417 | 6.8 | 22.6 | 48.8 | 4.24E-15 | 2.06E-15 | 2.32E-15 | |
| 31 | 222.262787 | 8.984556 | 5.1 | 24.4 | 59.8 | 3.73E-15 | 1.89E-15 | 1.82E-15 | |
| 32 | 222.262878 | 9.025694 | 5.9 | 20.4 | 65.8 | 2.84E-15 | 6.65E-16 | 3.57E-15 | |
| 33 | 222.263046 | 9.069306 | 5.5 | 9.4 | 51.3 | 1.68E-15 | 7.90E-16 | 2.64E-15 | |
| 34 | 222.263214 | 9.043528 | 6.2 | 55.8 | 60.9 | 8.38E-15 | 3.67E-15 | 5.76E-15 | |
| 35 | 222.265961 | 8.882333 | 7.9 | 26.7 | 38.7 | 6.32E-15 | 3.36E-15 | 2.66E-15 | |
| 36 | 222.268753 | 9.060694 | 6.4 | 129.7 | 70.9 | 1.68E-14 | 7.57E-15 | 1.08E-14 | |
| 37 | 222.273209 | 9.097361 | 6.0 | 19.9 | 40.1 | 4.54E-15 | 2.00E-15 | 3.07E-15 | |
| 38 | 222.274124 | 9.018278 | 5.0 | 32.8 | 76.9 | 3.90E-15 | 2.15E-15 | 1.40E-15 | |
| 39 | 222.277084 | 9.043833 | 5.6 | 254.3 | 70.6 | 3.30E-14 | 1.62E-14 | 1.76E-14 | |
| 40 | 222.277878 | 9.035528 | 6.3 | 56.2 | 58.5 | 8.79E-15 | 4.56E-15 | 4.00E-15 | |
| 41 | 222.284210 | 8.854389 | 8.8 | 28.7 | 41.2 | 6.38E-15 | 1.65E-15 | 7.46E-15 | |
| 42 | 222.285797 | 8.895667 | 7.1 | 16.7 | 34.1 | 4.49E-15 | 1.67E-15 | 3.90E-15 | |
| 43 | 222.288589 | 8.925778 | 5.2 | 10.5 | 47.9 | 2.01E-15 | 9.77E-16 | 1.47E-15 | |
| 44 | 222.290375 | 8.978639 | 4.9 | 83.4 | 76.7 | 9.96E-15 | 4.74E-15 | 5.73E-15 | |
| 45 | 222.291122 | 8.870472 | 8.0 | 180.3 | 38.4 | 4.30E-14 | 1.64E-14 | 3.59E-14 | |
| 46 | 222.292206 | 8.947667 | 4.2 | 132.4 | 50.5 | 2.40E-14 | 1.54E-14 | 1.99E-15 | |
| 47 | 222.293457 | 9.050139 | 6.5 | 12.5 | 54.7 | 2.08E-15 | 6.97E-16 | 3.58E-15 | |
| 48 | 222.298370 | 9.002167 | 5.2 | 5.4 | 49.6 | 1.00E-15 | 6.98E-16 | 1.66E-15 | |
| 49 | 222.299667 | 8.932222 | 4.7 | 13.0 | 43.2 | 2.77E-15 | 1.38E-15 | 1.63E-15 | |
| 50 | 222.305252 | 9.020639 | 4.4 | 10.1 | 80.2 | 1.15E-15 | 4.76E-16 | 1.31E-15 | |
| 51 | 222.309830 | 8.853306 | 7.0 | 46.8 | 24.8 | 1.73E-14 | 8.05E-15 | 1.04E-14 | |
| 52 | 222.310379 | 8.939861 | 4.5 | 10.1 | 52.7 | 1.75E-15 | 1.10E-15 | 1.74E-15 | |
| 53 | 222.310455 | 8.961611 | 4.9 | 13.0 | 74.4 | 1.60E-15 | 4.11E-16 | 2.28E-15 | |
| 54 | 222.311172 | 9.137444 | 8.6 | 20.3 | 42.8 | 4.34E-15 | 1.85E-15 | 3.10E-15 | |
| 55 | 222.311874 | 9.127639 | 8.3 | 11.1 | 46.3 | 2.20E-15 | 1.14E-15 | 3.43E-15 | |
| 56 | 222.313416 | 8.872611 | 7.4 | 65.5 | 46.2 | 1.30E-14 | 4.21E-15 | 1.30E-14 | |
| 57 | 222.313416 | 9.012250 | 4.1 | 25.7 | 73.9 | 3.19E-15 | 1.71E-15 | 1.29E-15 | |
| 58 | 222.317245 | 9.102750 | 7.2 | 17.5 | 66.2 | 2.42E-15 | 1.05E-15 | 3.11E-15 | |
| 59 | 222.319458 | 9.095917 | 7.1 | 28.4 | 72.2 | 3.60E-15 | 6.78E-16 | 4.99E-15 | |
| 60 | 222.319702 | 9.032389 | 4.5 | 34.9 | 78.2 | 4.09E-15 | 1.60E-15 | 3.35E-15 | |
| 61 | 222.322952 | 8.994083 | 4.1 | 10.6 | 77.8 | 1.25E-15 | 4.39E-16 | 2.17E-15 | |
| 62 | 222.324493 | 9.036972 | 4.6 | 36.4 | 77.9 | 4.27E-15 | 1.27E-15 | 4.68E-15 | |
| 63 | 222.328293 | 8.853472 | 6.7 | 28.6 | 23.5 | 1.12E-14 | 5.18E-15 | 6.79E-15 | |
| 64 | 222.333252 | 8.986194 | 4.0 | 11.5 | 77.7 | 1.35E-15 | 7.43E-16 | 1.57E-15 | |
| 65 | 222.333328 | 9.136556 | 8.9 | 10.5 | 54.5 | 1.76E-15 | 8.02E-16 | 1.95E-15 | |
| 66 | 222.333923 | 8.944556 | 4.7 | 70.2 | 70.0 | 9.18E-15 | 3.36E-15 | 8.21E-15 | |
| 67 | 222.337250 | 8.964194 | 4.5 | 10.4 | 60.5 | 1.58E-15 | 5.05E-16 | 1.84E-15 | |
| 68 | 222.341919 | 9.116611 | 7.9 | 34.1 | 67.4 | 4.64E-15 | 1.79E-15 | 3.83E-15 | |
| 69 | 222.344254 | 8.866611 | 5.7 | 7.3 | 25.8 | 2.58E-15 | 1.18E-15 | 2.04E-15 | |
| 70 | 222.345673 | 9.039556 | 4.6 | 8.7 | 76.9 | 1.04E-15 | 3.49E-16 | 1.90E-15 | |
| 71 | 222.351044 | 8.835861 | 7.5 | 18.9 | 22.2 | 7.78E-15 | 4.56E-15 | 6.02E-15 | |
| 72 | 222.351868 | 8.993889 | 4.0 | 371.8 | 76.3 | 4.46E-14 | 2.19E-14 | 2.38E-14 | |
| 73 | 222.354004 | 8.941389 | 4.7 | 29.8 | 74.8 | 3.64E-15 | 9.23E-16 | 4.46E-15 | |
| 74 | 222.355118 | 8.987278 | 3.9 | 44.7 | 77.6 | 5.27E-15 | 2.90E-15 | 1.88E-15 | |
| 75 | 222.356873 | 8.973278 | 3.8 | 69.9 | 74.7 | 8.57E-15 | 3.74E-15 | 5.90E-15 | |
| 76 | 222.359833 | 8.903028 | 5.7 | 87.9 | 49.5 | 1.63E-14 | 6.33E-15 | 1.34E-14 | |
| 77 | 222.360703 | 8.991722 | 3.8 | 6.8 | 81.3 | 7.66E-16 | 2.25E-16 | 9.24E-16 | |
| 78 | 222.360840 | 8.971000 | 3.7 | 25.8 | 77.4 | 3.05E-15 | 1.85E-15 | 1.77E-15 | |
| 79 | 222.360916 | 8.935917 | 5.0 | 27.4 | 73.3 | 3.42E-15 | 1.38E-15 | 2.68E-15 | |
| 80 | 222.363464 | 9.049944 | 5.0 | 9.6 | 74.6 | 1.18E-15 | 3.61E-16 | 2.15E-15 | |
| 81 | 222.366379 | 9.068861 | 5.7 | 10.3 | 75.3 | 1.25E-15 | 9.34E-16 | 8.79E-16 | |
| 82 | 222.366455 | 8.944361 | 5.5 | 200.2 | 59.0 | 3.11E-14 | 1.30E-14 | 2.29E-14 | |
| 83 | 222.369370 | 8.804972 | 9.4 | 50.1 | 20.7 | 2.22E-14 | 5.79E-15 | 2.56E-14 | |
| 84 | 222.371368 | 8.814944 | 8.8 | 14.3 | 22.6 | 5.81E-15 | 2.99E-15 | 7.06E-15 | |
| 85 | 222.372208 | 9.079472 | 6.3 | 35.6 | 60.4 | 5.40E-15 | 2.71E-15 | 2.70E-15 | |
| 86 | 222.374298 | 8.966694 | 3.8 | 10.3 | 66.4 | 1.42E-15 | 5.52E-16 | 1.59E-15 | |
| 87 | 222.376877 | 8.993111 | 4.0 | 8.5 | 77.0 | 1.01E-15 | 4.44E-16 | 9.13E-16 | |
| 88 | 222.382050 | 8.992194 | 4.0 | 13.5 | 77.5 | 1.59E-15 | 8.27E-16 | 9.06E-16 | |
| 89 | 222.386246 | 8.872472 | 5.7 | 13.1 | 25.6 | 4.69E-15 | 1.86E-15 | 3.75E-15 | |
| 90 | 222.392044 | 8.882361 | 6.9 | 75.9 | 43.6 | 1.59E-14 | 7.35E-15 | 9.86E-15 | |
| 91 | 222.392090 | 9.049778 | 5.0 | 17.8 | 77.8 | 2.09E-15 | 3.42E-16 | 3.08E-15 | |
| 92 | 222.396042 | 9.087750 | 6.6 | 15.7 | 70.4 | 2.05E-15 | 1.04E-15 | 2.47E-15 | |
| 93 | 222.396500 | 9.008444 | 4.3 | 238.9 | 77.2 | 2.83E-14 | 1.33E-14 | 1.68E-14 | |
| 94 | 222.396835 | 9.060028 | 5.7 | 30.5 | 70.6 | 3.95E-15 | 1.60E-15 | 3.07E-15 | |
| 95 | 222.398087 | 9.012417 | 4.4 | 34.8 | 77.2 | 4.12E-15 | 2.26E-15 | 1.52E-15 | |
| 96 | 222.399750 | 9.030722 | 4.5 | 30.9 | 63.1 | 4.48E-15 | 1.80E-15 | 3.54E-15 | |
| 97 | 222.401077 | 8.891778 | 6.5 | 24.0 | 44.4 | 4.95E-15 | 5.53E-16 | 8.33E-15 | |
| 98 | 222.401382 | 8.854250 | 7.0 | 8.7 | 22.3 | 3.57E-15 | 8.29E-16 | 4.68E-15 | |
| 99 | 222.402206 | 9.080778 | 6.4 | 18.7 | 76.0 | 2.25E-15 | 4.95E-16 | 2.91E-15 | |
| 100 | 222.402206 | 9.141528 | 7.3 | 258.9 | 23.1 | 1.03E-13 | 4.89E-14 | 5.90E-14 | |
| 101 | 222.402588 | 9.135417 | 6.9 | 41.1 | 25.6 | 1.47E-14 | 5.20E-15 | 1.35E-14 | |
| 102 | 222.404160 | 9.073222 | 6.1 | 15.1 | 72.5 | 1.91E-15 | 1.10E-15 | 1.88E-15 | |
| 103 | 222.406876 | 9.055667 | 5.2 | 236.8 | 72.3 | 3.00E-14 | 1.37E-14 | 1.89E-14 | |
| 104 | 222.411285 | 9.133194 | 6.7 | 25.6 | 24.3 | 9.66E-15 | 3.75E-15 | 7.97E-15 | |
| 105 | 222.419876 | 8.877861 | 7.5 | 31.6 | 43.5 | 6.65E-15 | 2.50E-15 | 5.69E-15 | |
| 106 | 222.420868 | 9.037028 | 5.7 | 85.8 | 62.2 | 1.26E-14 | 5.42E-15 | 8.94E-15 | |
| 107 | 222.423752 | 8.922472 | 5.4 | 130.3 | 49.7 | 2.40E-14 | 7.03E-15 | 2.65E-14 | |
| 108 | 222.429993 | 8.889306 | 7.3 | 29.0 | 35.0 | 7.58E-15 | 3.94E-15 | 3.41E-15 | |
| 109 | 222.432129 | 9.099889 | 4.5 | 16.7 | 22.8 | 6.70E-15 | 3.49E-15 | 3.10E-15 | |
| 110 | 222.433624 | 8.998611 | 5.0 | 10.1 | 75.0 | 1.24E-15 | 6.81E-16 | 1.85E-15 | |
| 111 | 222.435333 | 8.979750 | 3.8 | 14.3 | 53.3 | 2.46E-15 | 2.29E-16 | 4.22E-15 | |
| 112 | 222.436493 | 8.990611 | 4.6 | 398.0 | 59.6 | 6.12E-14 | 2.88E-14 | 3.62E-14 | |
| 113 | 222.446289 | 8.906417 | 6.7 | 189.1 | 44.7 | 3.88E-14 | 1.73E-14 | 2.56E-14 | |
| 114 | 222.449036 | 8.961111 | 4.8 | 11.9 | 51.4 | 2.13E-15 | 6.90E-16 | 2.16E-15 | |
| 115 | 222.449921 | 8.990222 | 4.0 | 9.2 | 54.2 | 1.56E-15 | 3.38E-16 | 3.12E-15 | |
| 116 | 222.451797 | 8.999694 | 3.9 | 33.0 | 53.1 | 5.70E-15 | 1.25E-15 | 7.53E-15 | |
| 117 | 222.453247 | 8.981194 | 4.2 | 110.9 | 50.4 | 2.02E-14 | 9.02E-15 | 1.33E-14 | |
| 118 | 222.455078 | 8.911806 | 6.8 | 12.2 | 45.2 | 2.48E-15 | 1.40E-15 | 2.78E-15 | |
| 119 | 222.455215 | 9.031222 | 5.7 | 56.6 | 74.3 | 6.97E-15 | 2.47E-15 | 6.36E-15 | |
| 120 | 222.455826 | 8.934750 | 5.9 | 9.0 | 50.8 | 1.62E-15 | 7.71E-16 | 2.71E-15 | |
| 121 | 222.461044 | 9.083861 | 3.8 | 4.7 | 26.0 | 1.66E-15 | 9.39E-16 | 3.13E-15 | |
| 122 | 222.462250 | 9.025194 | 6.0 | 18.1 | 73.5 | 2.25E-15 | 8.17E-16 | 2.00E-15 | |
| 123 | 222.462372 | 8.878500 | 8.9 | 47.6 | 20.3 | 2.14E-14 | 8.14E-15 | 1.79E-14 | |
| 124 | 222.466049 | 8.887278 | 8.3 | 31.9 | 30.8 | 9.48E-15 | 2.87E-15 | 9.99E-15 | |
| 125 | 222.480576 | 9.088806 | 4.6 | 4.8 | 9.3 | 4.76E-15 | 1.97E-15 | 9.36E-15 | |
| 126 | 222.485123 | 9.011889 | 5.3 | 70.0 | 44.8 | 1.43E-14 | 7.28E-15 | 6.89E-15 | |
| 127 | 222.487000 | 9.073972 | 4.2 | 7.7 | 27.4 | 2.56E-15 | 8.92E-16 | 2.57E-15 | |
| 128 | 222.487045 | 8.943139 | 6.8 | 24.1 | 48.9 | 4.52E-15 | 1.93E-15 | 3.22E-15 | |
| 129 | 222.489670 | 9.038917 | 3.2 | 39.8 | 27.3 | 1.33E-14 | 6.52E-15 | 7.16E-15 | |
| 130 | 222.494003 | 8.986694 | 6.2 | 143.8 | 48.1 | 2.74E-14 | 1.28E-14 | 1.64E-14 | |
| 131 | 222.495285 | 9.018000 | 5.9 | 53.4 | 48.1 | 1.02E-14 | 5.35E-15 | 4.41E-15 | |
| 132 | 222.496750 | 8.995306 | 6.3 | 16.0 | 46.3 | 3.17E-15 | 1.48E-15 | 2.96E-15 | |
| 133 | 222.528961 | 8.990222 | 7.9 | 405.6 | 46.3 | 8.02E-14 | 4.09E-14 | 3.90E-14 | |
| 134 | 222.539291 | 9.110583 | 7.9 | 14.7 | 23.9 | 5.64E-15 | 2.52E-15 | 4.94E-15 | |
| 135 | 222.553131 | 9.052889 | 7.1 | 18.5 | 20.8 | 8.14E-15 | 4.07E-15 | 4.92E-15 | |
| 136 | 222.567291 | 8.994028 | 7.9 | 236.7 | 23.2 | 9.35E-14 | 4.92E-14 | 4.13E-14 | |
| 137 | 222.587585 | 9.026056 | 8.9 | 9.2 | 22.3 | 3.78E-15 | 1.92E-15 | 5.99E-15 | |
| 138 | 222.612335 | 9.036944 | 10.4 | 18.7 | 20.9 | 8.16E-15 | 4.10E-15 | 4.18E-15 |
[x]ccccccc
Soft-band only sources
XID
RA
DEC
Counts
Expo
F(0.5–2 keV)
(deg)
(deg)
(′)
(0.5–2 keV)
(ks)
( )
139 222.328827 9.075750 6.0 8.9 75.1 7.21E-16
140 222.533173 9.078806 6.5 7.7 24.5 1.92E-15
141 222.563248 9.052389 7.7 6.1 23.1 1.61E-15
Hard-band only sources
XID
RA
DEC
Counts
Expo
F(2–10 keV)
(deg)
(deg)
(′)
(2–8 keV)
(ks)
( )
142 222.242661 9.051778 4.7 5.6 38.8 3.76E-15
143 222.402618 9.103194 6.3 6.5 43.0 3.94E-15
144 222.416534 8.932056 4.9 5.8 49.6 3.07E-15
145 222.519257 8.994639 7.4 8.0 50.6 4.04E-15
146 222.526703 8.962861 8.2 8.5 47.7 4.59E-15
147 222.264465 8.930778 5.7 4.0 49.5 2.12E-15
148 222.371552 8.957608 4.1 8.2 75.9 2.84E-15
149 222.305862 8.995367 5.1 10.3 53.9 5.01E-15
XID: X-ray identification number in the Chandra mosaic;
(RA, DEC): X-ray source coordinates;
: off-axis angle at the source position averaged over the Chandra observations;
Counts: source net counts;
Expo: exposure time at the source position (from the exposure maps; see 3.2 for details);
F(0.5–8 keV)/F(0.5–2 keV)/F(2–8 keV)/F(2–10 keV): flux obtained from the count-rate conversion, assuming a
power-law model with =1.8/2.0/1.4/1.4, as described in the text;
HR: hardness ratio. The upper limits (at the 95% confidence level) to the counts, hence the
reported fluxes, were computed according to Kraft, Burrows, & Nousek (1991).
Only five sources are detected in the full band without
being detected in the two sub-bands considered in this work (because of the
adopted detection threshold).


