Star Formation in the Central 400 pc of the Milky Way:
Evidence for a Population of Massive YSOs
Abstract
The central kpc of the Milky Way might be expected to differ significantly from the rest of the Galaxy with regard to gas dynamics and the formation of young stellar objects (YSOs). We probe this possibility with mid-infrared observations obtained with IRAC and MIPS on Spitzer and with MSX. We use color-color diagrams and spectral energy distribution (SED) fits to explore the nature of YSO candidates (including objects with 4.5m excesses possibly due to molecular emission). There is an asymmetry in the distribution of the candidate YSOs, which tend to be found at negative Galactic longitudes; this behavior contrasts with that of the molecular gas, approximately 2/3 of which is at positive longitudes. The small scale height of these objects suggests that they are within the Galactic center region and are dynamically young. They lie between two layers of infrared dark clouds (IRDCs) and may have originated from these clouds. We identify new sites for this recent star formation by comparing the mid-IR, radio, submillimeter, and methanol maser data. The methanol masers appear to be associated with young, embedded YSOs characterized by 4.5m excesses. We use the SEDs of these sources to estimate their physical characteristics; their masses appear to range from 10 to 20 . Within the central pc ( and ) the star formation rate based on the identification of Stage I evolutionary phase of YSO candidates is about 0.14 yr-1. Given that the majority of the sources in the population of YSOs are classified as Stage I objects, we suggest that a recent burst of star formation took place within the last 105 years. This suggestion is also consistent with estimates of star formation rates within the last years showing a peak around 105 years ago. Lastly, we find that the Schmidt-Kennicutt Law applies well in the central 400 pc of the Galaxy. This implies that star formation does not appear to be dramatically affected by the extreme physical conditions in the Galactic center region.
1 Introduction
Understanding the processes occurring in the nuclear disk of our own Galaxy is interesting not only for insight into our own Milky Way Galaxy, but also because its study can potentially provide a template to the closest galactic nuclei. This important region of the Galaxy hosts several sources of energetic activity, and is the site of massive molecular clouds with pockets of past and present massive star formation. On a larger scale, the distribution of molecular clouds is asymmetric in the so-called “central molecular zone” showing 2/3 of the molecular gas on the positive longitude side of the Galactic center region (Bania, 1977; Bally et al., 1988; Oka et al., 2005; Tsuboi et al., 1999; Martin et al., 2004; Morris & Serabyn, 1996). The nature of this asymmetry in the context of gas dynamics is not understood. This unique region is also distinguished from the rest of the Galaxy by the presence of a bar that is responsible for feeding gas into the central few hundred parsecs of the Galaxy. In particular, the non-circular motion of the gas in this region is thought to be induced by the bar’s potential combined with dynamical friction leading to migration of molecular clouds to the Galactic center (Binney et al., 1991; Stark et al., 1991). The collision of these migrating molecular clouds with each other in a small volume of the Galactic center is thought to be the driving mechanism for star formation on a wide range of scales (Wardle & Yusef-Zadeh, 2008). Thus, it is possible that the star formation process depends on the Galactic center environment including the effects of the bar on the gas dynamics.
Although there is a high concentration of dense molecular clouds distributed in the Galactic center region, the star formation rate has shown extreme values. On the one hand, the massive star forming region Sgr B2 points to the closest example of starburst activity in our Galaxy. This region contains some of the most spectacular young and dense stellar clusters having an age of a few million years (Figer et al., 1999; Paumard et al., 2006; Lu et al., 2006). In the context of recently formed stars in the nuclear disk, detailed study using Infrared Space Observatory (ISO) at 7 and 15m indicates the presence of a population of young stellar object (YSO) candidates in the region and (Omont, 2003; Schuller et al., 2006). On the other hand, quiescent giant molecular clouds such as G0.25-0.01 (Lis & Carlstrom, 1994; Lis & Menten, 1998) appear to contain highly inefficient star formation.
One intriguing question is whether the star formation in this region proceeds analogously to that elsewhere in the Galaxy, or whether the central region provides a unique environment and might provide a template for alternative modes of star formation in galactic nuclei generally. For example, the molecular clouds in the Galactic center region have elevated temperatures. Molecular line studies yield temperature estimates of 75 to 200K (Hüttemeister et al. 1993), while far-infrared data indicate dust temperatures 30K (Odenwald & Fazio 1984; Cox & Laureijs 1989; Pierce-Price et al. 2000). This temperature discrepancy suggests direct heating of the molecular gas either by cosmic rays or shocks, which may reduce the efficiency of star formation in the region (Lis et al. 2001b; Yusef-Zadeh et al. 2007b).
In order to census past and present star formation activity and to gain insight into the nature of star formation in the unique environment of the Galactic center, we carried out a 24m survey of the central molecular zone and beyond between and . This is the most recent in a series of papers that have presented sensitive surveys of the Galactic center region at near-IR and mid-IR wavelengths. Our MIPS survey provides an important data point when combined with the survey of the Galactic center region (Ramirez et al., 2008; Stolovy et al., 2006; Arendt et al., 2008). This allows us to distinguish YSOs and AGBs by fitting the spectral energy distribution (SED) of infrared point sources as well as by constructing color magnitude diagrams (CMDs). Furthermore, 24m observations reveal dense, cold dust clouds through their absorption against background emission and identify warm dust clouds through their emission without being contaminated by PAH emission. The presence of large-scale IRDCs in the Galactic center at this wavelength traces potential sites of the earliest phase of active and quiescent star formation. In particular, the correlation of 24m point sources distributed toward infrared dark clouds with 4.5m excess sources, thought to trace shock excited molecular emission, can be used to identify the earliest phase of massive star formation (Chambers et al. 2009). Lastly, 24m emission points to HII regions with embedded thermal sources of heating as well as to sites where synchrotron emission from relativistic particles is produced. The ratio of 24m to radio emission can separate thermal from nonthermal sources (Fuerst et al., 1987).
The structure of this paper is as follows. Section 2 describes details of observations using MIPS, IRAC, and radio data, while section 3 presents the large scale distribution of extended clouds and compact stellar sources. Then in section 4 we focus on the stellar distribution of 24m sources and the color magnitude diagram of the sources covered by the MIPS and IRAC surveys. Section 5 discusses the SEDs of candidate YSOs followed by a brief description of individual candidate sites of on-going star formation activity. The new sites of young, massive star formation are found by the detection of sources with excess 4.5m emission. There is a rich collection of prominent infrared sources toward the Galactic center, some of which such as Sgr A, the radio Arc and Sgr C, are saturated. We discuss elsewhere the distribution of 24m emission from Sgr A (G0.0-0.0) and the Galactic center radio Arc (G0.2-0.0), the Sgr B HII complex (G0.7-0.0) and G0.6-0.0, Sgr C (G359.4-0.1), Sgr E (G358.7-0.0) and the Tornado nebula. Here we assume the distance to the Galactic center is 8.5 kpc (Ghez et al. 2008).
2 Observations and Data Reductions
Apart from the 24m survey, several other surveys of this region have recently been carried out in other wavelength bands, as described briefly below. We have correlated these data with our MIPS survey data.
2.1 MIPS Survey at 24m
The Galactic Center region is very bright at mid-IR wavelengths. Therefore, to cover the full 8 2 °survey area most efficiently, we used MIPS in fast scan mode with large cross-scan steps of 302′′. Because of the permitted scan orientation during the Galactic center visibility window, the map was a parallelogram. This fast scan mode achieved enough individual source sightings for high reliability and reached the specified 1 mJy detection limit. Eight rectangular scans were performed in sequence, each taking approximately 2.3 hours, giving a total observing time of 18 hours. The diffraction limit of the 24m image is 5.8′′2. These data represent the highest spatial resolution and sensitivity large-scale map made of the inner few degrees of the Galactic center at 24m. The source photometry was based on the 24m catalog compiled by Hinz et al. (2009).
Our data are complemented by the Spitzer Legacy program MIPS Inner Galactic Plane Survey (MIPSGAL) which observed 220 deg2 of the inner Galactic plane, and for , at 24 and 70 (Carey et al., 2009) which avoided duplicating coverage of the Galactic center region. MIPSGAL-II post-BCD data were used to fill gaps around the high latitude edges. This was done by reprojecting the MIPSGAL II data over the whole field. The MIPSGAL data are only used where there is zero coverage at the edges of the mosaic.
There are several HII regions where the 24 emission is saturated. The most extended saturated regions lie toward Sgr A, the radio Arc and Sgr C, near , respectively. The point source saturation limit, depending on the background level, ranges between 4 and 4.5 Jy which correspond to 0.60 and 0.51 magnitudes at 24 . In order to remedy the saturation artifacts, we replaced the saturated regions by MSX Band E data (21.34 ) using the following steps. (1) The MSX data are reprojected to match the pixel scale and alignment of the MIPS image. A relative distortion between the positions of sources in MSX and MIPS images was corrected by a 4th-order 2-D polynomial warping of the MSX images. This correction reduced positional differences to 0.5 pixels ( pixels). (2) A linear fit to the correlation between pixel intensities is performed to derive a photometric scale factor and offset to be applied to match MSX Band E intensities with MIPS 24 intensities. The correlation is performed with bright (but not saturated) data by restricting pixel intensities to MJy sr-1 for the MIPS data and in the range of W m-2 sr-1. The derived scale factor was 40% larger than the quoted factor for converting MSX data from W m-2 sr-1 to MJy sr-1. The reason for such a discrepancy is not clear, but part of the difference may be caused by the slightly different nominal wavelengths of the instruments. (3) A mask is defined to identify the saturated regions. The mask is set to 1.0 where the rescaled MSX data are brighter than 1000 MJy sr-1 and then ramped down to 0.0 for any pixels pixels away from these regions. (4) The mask, and 1.0 minus the mask, are then applied as weights in the linear combination of the MSX and MIPS images. Thus, in the resulting image, 99.6% of the pixels contain unmodified MIPS intensities, 0.3% of the pixels contain scaled MSX intensities, and in between 0.1% of the pixels contain a weighted average of MIPS and scaled MSX intensities. (5) Lastly, we interpolate over 10 small MIPS coverage gaps that occupy 0.03% of the image.
Despite the weighted averages, differences in the PSF widths ( for MSX, for MIPS) create artifacts where MSX data replace saturated MIPS point sources. Therefore, any quantitative analysis on MIPS saturated sources should be performed on the original MSX images, rather than the combined MIPS+MSX images. The combined images are useful for qualitative evaluation of the structure and color of bright extended emission, and of course, for any unsaturated emission.
2.2 MIPS Survey at 70m
In order to obtain more complete SEDs of some of the high latitude 24m sources that show excess emission at 4.5m, we selected a total of nine such sources distributed at high Galactic latitudes within our survey. These sources were observed separately with MIPS at 70m. The low-latitude sources were not selected due their possible saturation at low latitudes in the plane. These targets were observed in MIPS photometry mode with the exposure time for each object of 3 seconds and default pixel scale of 10 . All observations were obtained between 2007 September 21 and 23. These data were reduced using the MIPS Instrument Team’s Data Analysis Tool v. 3.06 (Gordon et al., 2007). Aperture photometry was performed utilizing a set of custom IDL scripts. The data were flux calibrated using the conversion factor of 702 MJy sr-1 per raw MIPS units (5% uncertainty) following Gordon et al. (2007). An aperture of was used, with a sky radius of 39. The aperture correction for this configuration is 1.185.
2.3 Radio Surveys
Radio continuum observations at 20cm surveyed the and region with a spatial resolution of and 10′′ using two different array configurations of the Very Large Array (VLA) of the National Radio Astronomy Observatory999The National Radio Astronomy Observatory is a facility of the National Science Foundation, operated under a cooperative agreement by Associated Universities, Inc. (Yusef-Zadeh et al., 2004). Another recent survey at 20cm has extended this region to higher positive latitudes of up to 1°(Law et al., 2008). We obtained 32 overlapping images at 20cm from these two surveys and convolved individual images with a Gaussian having a FWHM=12.8 before the images were mosaiced.
This region has also been observed at 20 and 6cm with the VLA (Becker et al., 1994; Zoonematkermani et al., 1990). However, these surveys are short snapshot observations of a region dominated by bright sources with a wide range of angular scales and poor sensitivity and so are not useful for comparison with infrared sources due to the non-uniform uv coverage. The detection of point sources at 90 and 20cm (Nord et al., 2004; Yusef-Zadeh et al., 2004; Law et al., 2008) does suffer from the artifacts introduced by the lack of uv coverage. More recently, Lang et al. (2009) have completed a 6cm survey of the Galactic center region with a uniform uv coverage. We have used this data set to measure the fluxes of several point sources in the G359.43+0.02 cluster, as described below.
2.4 Other Surveys
A survey of Spitzer/IRAC observations of the central 2° 1.4° ( pc) was recently conducted in the four wavelength bands at 3.6, 4.5, 5.8 and 8m (Stolovy et al., 2006; Ramirez et al., 2008; Arendt et al., 2008). The catalog presented in Ramirez et al. (2008) includes point source photometry from the IRAC survey and correlates those sources with previously published photometry from 2MASS at J, H, and Ks bands (Skrutskie et al., 1997).
A Submillimeter Common-User Bolometer Array (SCUBA) survey of the Galactic center covered a region of 2°05 at 450 and 850m with a spatial resolution of 8′′and 15′′, respectively (Pierce-Price et al., 2000). Given the low resolution of the submillimeter data, the detected submillimeter flux is used as upper limits at 450m and 850m (Di Francesco et al., 2008) in the spectral energy distribution of individual point sources. However, large-scale submillimeter maps of extended sources at 450 and 850m have been used for comparison with radio and mid-IR images.
3 Large-Scale Distribution of 24m Emission
3.1 Extended Sources
Figure 1a shows the large scale view of the surveyed region at 24m. In order to bring out the weak sources, the sources distributed between –1.8 are burned out in this figure. The mean brightness of this region is roughly 4 to 5 times higher than the region beyond the inner few degrees of the Galactic center. Several extended HII regions are identified to have radio continuum and submillimeter counterparts (Yusef-Zadeh et al., 2004; Pierce-Price et al., 2000). An enlarged view of the burned-out 3°2°region is shown in Figure 1b. Prominent Galactic center HII complexes along the Galactic plane are associated with Sgr A – E, the Arches and the Pistol, all of which are labeled, as shown in Figure 1c. We note two extended 24m emitting features G0.23-0.05 and G0.31-0.07 lying between the radio Arc and Sgr B1. The radio Arc, which includes the Arches cluster and the Pistol nebula, consists of a network of nonthermal radio filaments running perpendicular to the Galactic plane (Yusef-Zadeh et al., 1984; Lang et al., 1999). We note a number of parallel filamentary features at 24m associated with G0.31-0.07 which will be discussed elsewhere. At positive latitudes, two extended clouds known as the western and eastern Galactic center lobes are shown prominently in Figure 1b near and , respectively. The striking structure of the western lobe with its strong 24m emission coincides with AFGL 5376 (Uchida et al., 1990). In the eastern lobe, two columns of 24m features with an extension of about 30′ run parallel to each other away from the Galactic plane. These features lie in the region of the Galactic center lobe that is known to emit strong synchrotron emission (Law et al., 2008). The “double-helix” nebula (Morris et al., 2006) lies along the northern extension of the eastern linear feature in the Galactic center lobe. The southern ends of these linear features appear to be pointed toward the large-scale ionized features associated with the Arches cluster G0.12+0.02 and a cluster of HII regions (H1–H5) (Yusef-Zadeh & Morris, 1987; Zhao et al., 1993). In addition, there are several counterparts to foreground H emission line nebulae, RCW 137, 141, and 142, which are prominent at 02.
At positive longitudes, a string of IRDCs is concentrated between l and Sgr B2 near l=0.7. Sub-millimeter emission from these clouds is prominent at 450 and 850m (Lis & Carlstrom, 1994; Pierce-Price et al., 2000). Figure 2a displays an enlarged view of 24m emission from dust clouds and stellar sources distributed at positive longitudes. With careful adjustment of the overall background level, the ratio of IRAC images, such as , are used to highlight the location and structure of the IR dark clouds. This ratio is high for the IRDCs (Figure 2b). The bright feature in this figure corresponds to a dust lane that consists of a string of dust clouds. These clouds appear narrow near l=0.25°and become increasingly wider extending toward negative latitudes near Sgr B2. The kinematics of this dust lane have been studied in numerous molecular line surveys of this region (Oka et al., 1998; Martin et al., 2004).
At negative latitudes, the distribution of dust emission at 24m and the ratio map are shown in Figure 3a,b, respectively. IRDCs are detected toward the well-known molecular clouds M-0.13-0.08 (20 km s-1) and M-0.02-0.07 (50 km s-1) (Herrnstein & Ho, 2005; Armstrong & Barrett, 1985). Both clouds are located near the Galactic center. One of the largest structures in the ratio map is the pair of two dust lanes that run parallel to each other along the Galactic plane between l=0°and l=-40′ on the positive and negative latitudes. The previous CS (1-0) line study of this region has shown the counterpart to the positive latitude dust lane to have a coherent kinematic structure. We also note an elongated dust cloud (called “Vertical IRDC” in Fig. 1c) running toward positive latitudes at l=-40′, b=4′ with a latitude extent of 12′. The prominence of this feature with respect to the dust lanes in the ratio map suggests that it is a foreground cloud.
3.2 Color Distribution of Extended Emission
In order to analyze the color distribution at different bands, a close-up view of the central region of the 24m survey is cropped to the exact size of the 8m survey (Stolovy et al., 2006). Figure 4a shows the combined 24, 8 and 4.5m images with red, green and blue colors, respectively. Figure 4b shows only the 3.6, 4.5, and 8m images in blue, green and red colors, respectively. Overall, there is a great deal of non-uniformity in the color distribution detected between IRAC and MIPS images, as shown in Figure 4a. In contrast, uniform color distribution is noted in IRAC images, as shown in Figure 4b (Arendt et al., 2008). One of the main reasons for the non-uniformity of colors is that 24m emission is an excellent diagnostic of local sources of heating of large dust grains. This is in part due to the fact that thermal emission from large dust grains at 24m becomes significantly enhanced when the radiation field is only 100 times that of the local interstellar radiation field (ISRF) in the solar vicinity (Arendt et al., 2008). In contrast, 8m emission mainly arises from aromatics (hereafter PAHs) that are excited by the interstellar radiation field and nearby OB stars. Thermal emission from small dust grains becomes strong enough to compete with the PAH emission in the 8m band only when the local radiation field is about 104 times that of the solar neighborhood (Li & Draine, 2001). Thus, there is much less variation in the 8m to 5.8m color than in the 24m to 8m color. These color distribution images based on IRAC and MIPS data place a lower limit of 100 times the ISRF throughout the Galactic center region with the exception of the regions known to have a very strong radiation field such as the Arches and Sgr A (see Arendt et al. 2008).
Several extended sources show a distinct pattern of excess 24m emission (red in Fig. 4a) surrounded by 8m emission (green and yellow in Fig. 4a). The 24m excess (or 8m deficit) can be accounted for by the destruction of PAHs by local sources of UV radiation or shocks (Watson et al., 2008; Churchwell et al., 2007; Povich et al., 2007). In contrast to small grains and PAHs that can be destroyed, the large dust grains re-radiate the absorbed UV radiation at long wavelengths, 24m. The most striking example that shows these effects is the optical H line emission nebulae RCW 137, 141 and 142 which are foreground sources and are internally heated. PAHs are destroyed close to the source of heating, but are excited at the edge of the cloud by the external ISM radiation field. The 24m diffuse emission along the Galactic plane traces local sources of heating by HII regions.
There is another type of 24m source that shows neither 8m counterpart nor any evidence for embedded sources of heating. AFGL 5376 (Uchida et al., 1990) is one example that is located at high latitudes. G0.85-0.44 is another source that shows similar characteristics. Alternative mechanisms must be responsible for heating these clouds. One candidate is the high flux of cosmic rays that could be responsible for heating large dust grains but not PAHs.
3.3 Infrared Dark Clouds
We note several IRDCs in Figure 4a with different levels of darkness. These cold, dark clouds are seen in absorption against the diffuse background emission. The IRDCs are optically thick even at 24m. Therefore, their apparent surface brightnesses are more of an indication of the emitting column density on the line of sight to the cloud (i.e., the cloud’s distance) than a sign of the optical depth of the IRDCs. For example, we note that the IRDCs at high and low Galactic plane latitudes, such as G0.2+0.47 and G-0.67+0.18 are the darkest clouds, suggesting that they are distributed locally along the line of sight.
As was shown in the ratio maps, the large scale distribution of IRDCs forming a dust lane implies an early phase of massive star or star cluster formation in the Galactic center region. IRDCs are dense ( cm-3), cold (K) and attain high column densities ( cm-2) in the Galactic disk (Egan et al., 1998; Carey et al., 2000; Simon et al., 2006). The extreme physical properties of the clouds in the Galactic center region should be even more suitable for young, massive star cluster formation. We note the string of IRDCs is coincident with the “Dust Ridge” (Lis et al., 2001), as shown in Figure 1c. What is remarkable is a large-scale east-west ridge of IRDCs tracing dense molecular gas between G0.25+0.01 and Sgr B2. This continuous east-west IRDC ridge shows a sinusoidal appearance on a scale of corresponding to 12 pc. The western half of this large-scale ridge of IRDCs is quiescent (Lis et al., 2001) in its star formation activity whereas the eastern half shows spectacular on-going star formation. The string of submillimeter emitting molecular clouds includes G0.25+0.01 and the Sgr B complex and is darker than the well-known 20 and 50 km s-1molecular clouds M-0.13-0.08 and M-0.02-0.07 as well as clouds in the negative longitude side of the Galactic center. This behavior suggests that the positive-longitude IRDCs are closer than the 20 and 50 km s-1 and Sgr C clouds. The large-scale distribution of IRDCs traces coherent molecular lanes running parallel to the nuclear disk (Bania, 1977; Bally et al., 1988; Oka et al., 2005; Tsuboi et al., 1999; Martin et al., 2004), as shown in ratio maps of Figures 2 and 3. The color contrast of the coherent, large scale dust lane suggests that the molecular gas in the central molecular zone is oriented in the same direction as that of the well-known stellar bar (Binney et al., 1991; Stark et al., 1991).
3.4 Distribution of Compact Sources
The blue color (4.5m emission) in Figure 4a represents the stellar density distribution in Sgr A where the evolved stellar core of the bulge peaks. This is mostly unresolved stellar sources, not intrinsically diffuse emission. A number of red (24m) point sources are also seen in this figure that appear to be embedded within IRDCs suggesting that they are protostellar candidates, as will be discussed in section 5. The red color reveals embedded stellar sources that heat surrounding dust grains to high temperatures. Numerous compact HII regions with radio continuum counterparts are distributed along the Galactic plane near the Galactic center.
To reveal the distribution of intrinsically red compact sources against the strong extended emission, we constructed a 24m to 8m intensity ratio image, which is presented in Figure 5a. Regions with relatively strong 24m emission are light whereas regions with strong 8m (PAH) emission are dark. Most of the emission from the ISM (including that on the line of sight to IRDCs) disappears into a flat gray background. The disappearance of IRDCs is because they are opaque at both 8m and 24m. The extinction ratio (A8μm/A) (Li & Draine, 2001) implies a lack of reddening even for clouds that are not opaque (e.g., their edges). The “removal” of the typical ISM emission and dark clouds accentuates a number of structures and helps reveal some fainter, compact and extended sources with excess 24m emission. The most striking feature in the ratio map is the distribution of compact emission from a high concentration of strong IR-excess objects, candidate YSOs or UCHII regions distributed between and .
Figure 5b shows the relationship between the compact 24m point sources and the molecular gas. It is a composite image indicating 24m in green and 450m in red. Sub-millimetre emission at 450m is optically thin and is known to be an excellent tracer of molecular gas distributed in the central molecular zone. The comparison of the distribution of 24m emission and the ratio map shows two features. One is the distribution of extended sub-millimetre emission being strongest in the positive longitude side the Galactic center. It is clear that molecular gas distribution at is more uniform and more intense at 450m than that at negative longitudes. Similar asymmetric structure is also noted in CS and CO line observations (Bally et al., 1988; Martin et al., 2004; Oka et al., 2005; Tsuboi et al., 1999). This asymmetric distribution shows 2/3 of the mass of molecular gas on the positive longitude side of the Galactic center region (Bally et al., 1988; Oka et al., 2005; Martin et al., 2004). The presence of such an asymmetry is mainly due to massive clouds associated with Sgr B2 and the dust ridge and a lack of massive, dense clouds at with the exception of Sgr C.
The second feature is the distribution of 450m emission at negative longitudes showing that 24m sources anti-correlate with the distribution of dust clouds. Remarkably, the distribution of 24m point sources appears to be sandwiched by two layers of dust and gas clouds running parallel to the Galactic plane and symmetrically distributed with respect to the Galactic center. The “bow-tie” dust layers, as schematically drawn in Figure 1c, stretch along both positive and negative longitudes and coincide with IRDCs at 8m and 24m. Submillimeter emission is also noted from a cloud at negative latitudes b=-5′. This feature is the negative latitude counterpart to the layer of submillimeter emitting cloud in the region between G0.25+0.01 and Sgr B1 at positive longitudes. The negative latitude submillimeter layer does not have an IRDC counterpart, implying that it is most likely located on the far side of Sgr B2. Thus, it is likely that these molecular layers are closer to us at positive longitudes than at negative ones. What is remarkable from the mid-IR and submillimeter images are that the ”bow-tie” structure in fact consists of two layers of molecular and dust clouds that are symmetrically distributed with respect to the Galactic center. However, it is most likely that the positive longitude side of these molecular layers is closer to us than those at negative latitudes.
We also note that unlike the gas and dust distributions, the 24m point sources are more uniformly distributed on the negative longitudes than at positive ones. Given that the chain of IRDCs that include Sgr B2 are thought to be closer than those at negative longitude, it could be that they hide a distant population of 24m sources and create an apparent asymmetry, as discussed in more detail below.
4 Candidate YSOs
To investigate the nature of the 24m compact sources, 8–24m ([8]-[24]m) color magnitude diagrams (CMDs) are constructed for sources within and =1.4 degrees, corresponding to the central 0.4 0.05 kpc region. The CMD of these sources identified in the positive and negative longitudes is shown in Figure 6. These data used the MIPS catalog at 24m (Hinz et al., 2009) and IRAC catalog at 8m (Ramirez et al., 2008). A total of 172,670 sources is detected, 70,794 and 101,876 of which are found in the region restricted to positive and negative longitudes, respectively. There is an excess of 31082 sources identified in negative longitudes. This asymmetry could be explained by the high extinction experienced by mid-IR sources in the region where dense molecular clouds are highly concentrated. Alternatively, the distribution of compact dusty sources could be due to an intrinsic excess of YSOs or evolved AGB stars. The dashed line in Figure 6 is chosen empirically, as discussed below, to separate the reddest YSOs from AGBs. Each of the two possibilities is discussed below.
OH/IR stars are oxygen-rich, mass-losing cool giants that represent evolved AGB stars at the end of their lives (Habing, 1996). These post AGB stars are known to be dusty with excess emission at infrared wavelengths. YSOs are also known to have excess emission in infrared wavelengths and are characterized by dusty envelopes and disks that absorb the radiation from the central protostar (Whitney et al., 2003a; Adams et al., 1987). To explore the color of evolved stars in the Galactic center, we examined the spatial distribution of known OH/IR stars in the region shown in Figure 6 using the OH 1612 MHz catalogs (Lindqvist et al., 1992; Sevenster et al., 1997a, b; Sjouwerman et al., 1998). OH/IR surveys are not affected by visual extinction. These surveys have uniformly sampled the region covered by IRAC observations. The shallow but uniformly sampled survey by Sevenster et al. (1997a) finds a total of 7 and 9 OH/IR stars in the restricted region, for positive and negative longitudes, respectively. Similarly, the spatial distribution of OH/IR stars on a large scale is symmetric with respect to the Galactic center. Although, there are not many OH/IR masers that we found to have infrared counterparts in the restricted region of our survey, we find no evidence of asymmetry in the distribution of OH/IR stars with respect to the Galactic center.
To examine whether the observed color of the infrared sources (Ortiz et al. 2002; Ojha et al. 2007) can be due to the excess of YSOs, we first identify the color of OH/IR stars. The reddening toward these Galactic center sources is minimally affected by the differential extinction between 8 and 24m. Flaherty et al. (2007) have recently derived A(8m) - A(24m) A(K). The color variation between 8 and 24m should be 0.2 mag assuming A(K) or 30 magnitudes of visual extinction. Thus, the observed color of the sources is intrinsic. Here, we make an empirical assumption that the very red sources are likely to be candidate YSOs. Figure 7a shows the CMD of all the 24m sources found in the surveyed region by IRAC. The colors of OH/IR stars that are found using the survey by Sevenster et al. (1997a) are shown as triangles in Figure 7a and are distributed to the left of the dashed line that was selected empirically. The color of OH/IR masers is clearly distinguished from the reddest and faintest sources (by a few magnitudes). The dashed line in Figure 7a is the slope that separates most of the YSO candidates to the right from the rest of the sources that have 24 and 8m counterparts. The left side of the slope in Figure 7a indicates a trend of IR excess sources with luminosity. The CMD of the LMC shows a similar trend among luminous AGB stars due to the relationship between increasing radiation pressure resulting in more mass loss in dust, and therefore more IR excess (see Fig. 3a of Whitney et al. 2008). Thus, we believe the sources to the right of the slope in Figure 7a are dominated by candidate YSOs. The color-color diagram between [8]-[24]m is also shown in Figure 7b where the candidate YSOs are shown as crosses. In the restricted , region the total number of YSO candidates is found to be 347 and 212 distributed on the negative and positive longitudes, respectively. The spatial distribution of candidate YSOs with [8]-[24] greater than 4 is shown in Figure 7c revealing that the reddest infrared sources are distributed mostly along the Galactic plane. The numbers of YSO candidates are lower limits because the colors of stars in the saturated regions near and could not be examined (see Figure 7c). In spite of these restrictions, we note that most of the candidate YSOs are distributed in the negative latitudes, very close to the Galactic equator.
The saturated sources at 24m as well as the contaminating sources limit our ability to address the issue of completeness. However, we believe that the distribution of OH/IR sources validates our empirical choice for the slope of the dashed line used to identify most of the YSO candidates. An additional step is taken in to identify the fraction of YSO candidates via SED fitting of the sources selected from the right region of the CMD of Figure 7. As discussed below, 60-65% of the total number of sources from the CMDs are SED fitted. Ultimately, future spectroscopic measurements of YSO candidates should be able to address the completeness issue.
4.1 Excess Candidate YSOs in l?
To test the possibility that there is an asymmetric distribution of candidate YSOs with respect to the Galactic center, we examined two tracers that are not affected by visual extinction. First, we examined compact radio continuum sources (Yusef-Zadeh et al., 2004) and found 44 and 58 sources in the positive and negative longitude sides of the Galactic center, restricted to the same regions where candidate YSOs are found. It is known that Sgr B2 is one of the most active star-forming sites in the Galaxy at (Mehringer et al., 1998; De Pree et al., 2005). We note that 16 of the 44 compact radio sources at the positive longitudes arise only from ultracompact HII regions in Sgr B2. On the other hand, compact radio continuum sources in the region are distributed more uniformly than in the region at degrees. The excess number of 14 sources at negative longitudes combined with non-uniform distribution of compact radio continuum sources at positive longitudes imply an asymmetry of radio continuum sources that can not be explained by excess extinction at positive latitudes. This is consistent with the excess of infrared sources in the negative longitudes of the Galactic center. Additional support for this picture comes from H2O maser study of the same region showing a similar distribution to that of compact 20cm radio continuum sources. This survey used the (IRAS) Galactic center catalog (Taylor et al., 1993) to search for H2 masers. The largest concentration of star forming water masers is found in Sgr B2 whereas the star forming H2O masers are populated uniformly in the negative longitude sides of the Galactic center (Taylor et al., 1993). For example, the targeted survey by Taylor et al. which excluded the Sgr B2 region, detected a total of 13 and one star forming H2O masers at the negative and positive longitudes, respectively. Although water maser survey observations have not uniformly sampled the Galactic center region, the available data are consistent with the picture that the largest concentration of quiescent molecular clouds such as the string of IRDCs distributed in 0° do not have a high density of 24m sources, H2O masers and ultracompact radio continuum sources (Lis & Carlstrom, 1994).
Since most of the candidate YSOs are distributed asymmetrically on the negative longitude side of the Galactic center, we constructed another histogram of candidate YSOs for . This histogram should be a better representation of the scale height of the uniformly distributed YSO candidates. Gaussian fits to the narrow and broad components give FWHM centered at b=-2.4′ and FWHM centered at , respectively. The scale height of the YSO candidates in l is 6.3 pc is similar to pc when all the sources at both positive and negative longitudes are included.
4.2 Distribution of 24m Sources
To examine the distribution of YSO candidates as a function of latitude, a histogram was made using the data from the central 2.6. Figure 8a shows a broad and narrow component. The broad and narrow components are fitted with two Gaussians. The broad component is centered near with a FWHM= whereas the narrow component is displaced with respect to the Galactic plane at with a FWHM. Figure 8b shows the distribution of the candidate YSOs when they are restricted to . This distribution is consistent with the narrow latitude distribution of YSO candidates with an offset with respect to the Galactic equator near . This value is likely to be close to the true latitude of the Galactic plane since Sgr A*, the massive black hole at the Galactic center, lies at . Unlike the broad distribution that is likely due to foreground sources toward the Galactic center, the narrow distribution of the candidate YSOs suggests a uniform sample of sources located along the midplane of the Galactic center. The scale height of the candidate YSOs is estimated to be 7 pc assuming the distance to the Galactic center is 8.5 kpc. Molecular line observations of this region based on CS (1-0) transition also finds a narrow scale height pc (Bally et al., 1988). The narrow scale height of both candidate YSOs and molecular clouds can be used as a support for the association of infrared sources and the disk population of molecular gas distributed in the Galactic center region. To test that the reddest sources belong to a population of YSOs distributed in the midplane of the Galactic center region, the YSO candidates from the color-magnitude diagrams of Figures 6 and 7 are presented in two dimensional histograms in Figures 8c and 8d to emphasize the higher fraction of brighter, redder YSO candidates within 10′ and the exterior region 10′ , respectively. These CMDs are selected from the point source catalogs. The fraction of redder YSO candidates with [8]-[24] 3, relative to the total number of sources in the inner 10′ is found to be a factor of five to ten higher than the region beyond the inner 10′. This suggests that there are more red YSOs in proportion to the total YSOs detected for the innermost region of the Galactic center than those found in the outermost region. There are 1720 YSO candidates, 599 of which are in the region restricted to and ; there are 347 and 252 sources distributed in the negative and positive longitudes, respectively.
To compare the scale heights of candidate YSOs and the bright 24m point sources, we constructed Figure 9a which shows the distribution of bright unsaturated 24m sources between 0 and 5 magnitudes as a function of latitude within . The narrow and wide components reflect the scale height of all bright stars which include both the evolved dusty stars and YSO candidates. The fitted values give two components with FWM and 96′, both of which are broader than those of the candidate YSO’s. To measure the scale height of the bright dusty stars without being contaminated by the YSO candidates, we subtracted the candidate YSOs and determined the latitude distribution of dusty sources. Two components were fitted with FWHM and 105. The scale height of the narrow and bright component corresponds to a value of pc. The higher values of the scale heights of bright dusty sources compared to YSO candidates suggest they are more evolved dynamically than the YSOs. An important implication of these scale heights is the support for a new population of YSOs distributed in the Galactic center region.
Using the mosaic image based on the combined MSX and MIPS data, we also constructed the brightness distribution of 24m emission as a function of latitude and longitude. Figure 9b shows the latitude distribution where two broad and narrow components are detected. The broad background emission is subtracted followed by a Gaussian fit to the narrow component, giving a FWHM which corresponds to a scale height of pc. This value is slightly thicker than the scale height of candidate YSOs having pc but close to the scale height of molecular gas =10 pc. The fit to the broad component gives FWHM=, representing the scale height of bright sources in the disk distributed along the line of sight.
To examine the brightness distribution of point sources for a given flux, we plot the brightness distribution of 24m sources as a function of longitude and present the results in three different panels in Figure 10. The flux of selected YSO candidates range between 0-5, 5-7 and 7-10 magnitudes corresponding to bright, intermediate and faint sources in the entire region of the 24m survey but restricted only to within . Such a tight latitude restriction most likely selects the sources that populate the Galactic plane. It is clear that the brightest 24m sources show a stronger asymmetry in longitude, as shown in Figure 10a, when compared to the distribution of fainter sources, as shown in Figure 10b,c. The faintest stars dominate at greater longitudes but are not detected in the innermost region of the Galactic center. This is because of the confusion and the saturation caused by the extremely strong background. These distributions indicate that the brightest 24m point sources exhibit an excess at negative longitudes similar to that seen in the candidate YSOs. The fainter 24m sources seem to be uniformly distributed.
5 The SEDs of candidate YSOs
One of the difficulties in identifying YSOs by selecting them from 8–24m color magnitude diagrams is the contamination by dusty and bright AGB stars. In addition, YSOs can populate left of the CMD line as well (as seen in Figs. 6 & 7). In order to have more confidence in identifying YSO candidates and to characterize their properties, we obtained the Spectral Energy Distributions (SEDs) of selected number of YSO candidates using measurements at eight wavelengths from 1.24m to 24m in order to determine the evolutionary phases. The SED fitting technique is motivated by physical models and determines the physical properties of the sources. This technique is used for further refinement of the list of YSO candidates based on the CMD technique with its ad hoc distinctions in color. The SEDs of the sources are analyzed by comparing to a set of SEDs produced by a large grid of YSO models (Robitaille et al., 2006; Whitney et al., 2003b, a). We use a linear regression fitter (Robitaille et al., 2007) to find all SEDs from the grid of models that are fit within a specified range to the data. The of the fit depends on the errors assumed for the data. We set lower limits on the fractional flux error (dF/F) to be 20% to account for variability between the 2MASS, IRAC and MIPS observation dates. The minimum reduced for each source is determined. For all the models with a reduced within 1 of the minimum value, physical parameters corresponding to those models are averaged along with their standard deviations. The models are not always well-constrained due to the incomplete SED information (many lower and upper limits and relatively few overall data points). However, this averaging is constrained by the finite extent of the grid of models.
We carried out our search for candidate YSOs toward two regions, using SED fitting of sources selected from CMDs. One is a small cluster of 24m sources at G359.43+0.02 and the other is the candidate YSOs distributed within and . We caution that the CMD selection biases us to redder sources. In addition, we have employed conservative errors in the SED fitting. Robitaille et al. (2006) defined three evolutionary stages based on their derived model properties, analogous to the classification based on the observed SED slope (Lada, 1987): Stage I objects have envelope infall rate yr-1, Stage II objects have yr-1 and , and Stage III objects have yr-1 and . That is, Stage I objects are young protostars embedded in an opaque infalling envelope. In Stage II objects the envelope has mostly dispersed, and the central star is surrounded by an opaque disk. In Stage III the disk is optically thin. It is not clear if there is a long-lived disk stage (Stage II) in high-mass sources, or if the disk is dispersed with the envelope. There are good reasons for the conservative (20%) error bars, but it means that Stage II and III YSOs with smaller IR excesses may fail to be distinguished from reddened stellar atmospheres. It is clear that the YSO list will be incomplete and biased towards younger evolutionary stages, which are readily distinguishable from even dusty evolved stars. We discuss these two groups separately below and then estimate the star formation rate.
5.1 G359.43+0.02 Cluster
A striking cluster of 24m sources lies about 8′ north of the Sgr C complex G359.4-0.1 with its thermal and nonthermal radio continuum components. Figure 11a,b show grayscale images of G359.43+0.02 at 24m and 20cm, respectively. This cluster of 24m source (G359.43+0.02) is distributed in the region where the northern extension of the nonthermal radio filament of Sgr C dominates the radio continuum emission. In spite of strong extended background emission from the nonthermal filaments, there are several compact radio sources that are detected toward this cluster. The positions, the flux densities at 20 and 6cm and the sizes of individual radio sources are listed in Table 1; column 1 identifies the source number, columns 2 and 3 show the Galactic coordinates, and columns 4 to 7 give the flux densities in mJy and the source sizes at 6 and 20cm, respectively. These values are estimated by two-dimensional Gaussian fits to individual compact radio sources at 6 and 20cm. The finding chart for the radio and 24m sources is shown in Figure 11c. The crosses drawn on Figure 11a,c show the positions of radio continuum point sources whereas the circles drawn on Figure 11b,c show the position of compact 24m sources. Because of the saturation of several 24m sources in this cluster, there are only two radio sources, as listed in Table 1, that have cataloged 24m counterparts.
The CMD covered by the region shown in Figure 11a,b is shown in Figure 11d. A total of 28 candidate YSOs is detected in the YSO candidate region of Figure 11d. We selected these candidate YSOs and fitted their SEDs. The SED fitting leads to the rejection of 10 sources as YSO candidates. Thus the total number of YSO fitted sources is about 64% of the sources that are selected from CMDs. The fraction of Stage I objects is 78% of the total number of SED fitted sources.
The rejected sources are likely to be evolved stellar sources, for which the model YSO SEDs give poor fits. Other reasons for rejecting sources could be i) variability between IRAC and MIPS, ii) errors in photometry, iii) source confusion where multiple sources contribute and give an SED that is not well fit by a single YSO model, iv) bad extraction of data or v) there are no correct models in the grid.
Figure 12a shows the fitted SEDs for each individual YSO candidate source and Table 2 shows the physical characteristics derived from their SED fitting. These sources are assumed to be 8.5 kpc away with Av values rangig between 5 and 50 magnitudes. Given that 9 out of 18 of these have fewer than 5 data points, we note from from Figure 12a that the flux of most cluster members is elevated at 24m when compared to IRAC and 2MASS data points. This supports the identification of these sources as YSOs. The parameters of the fits to these 18 sources suggest that the masses of the individual protostars range between 5 and 11.7 with corresponding luminosities ranging between 6.5 and 104 .
Columns 1-10 of Tables 2, 3 and 4 show (1) the the SST (Spitzer Space Telescope) Galactic center (GC) number based on the IRAC catalogs (Ramirez et al., 2008), (2-3) Galactic coordinates, (4) values, (5) number of acceptably fitting models “nfits”, (6) the visual extinction Av, (7-8) the average mass and luminosity of the protostar, (9) the average mass accretion rate which includes their corresponding standard deviations, and (10) the evolutionary stage of the fitted sources. The error bars are 1 standard deviations of the well-fit values. The standard deviation of the fitted values reflect the limited number od data points that went into a fit. Thus, additional data points in other wavelength bands should improve the reliability in a fit. We examined with values ranging between 0.5 to 2. There were many fits that did not go through the data points when a value of 2 was selected. On the other hand, when we used a value of 0.5, there were not enough fits. Thus, we visually selected fits with . Av values rangig between 5 and 50 magnitudes. Av restriction is unlikely to biase the results. It is restricting some of the less likely models from being included in the fitting. For example, if the Av to a source is 10, and the fitter finds a model with Av=0, it is going to find a more embedded model than it should in order to fit the high extinction. By selecting a reasonable range of Av, we are getting more appropriate YSO models to fit the source.
5.2 Sources within
The number of candidate YSOs, as shown to the right in the CMDs of Figure 7a is 347 and 212 distributed at negative and positive longitudes, respectively. These numbers are obviously lower limits due to the bright saturated background at 24m. SED fitting showed a total of 213, 112 and 35 for Stage I, II, and III sources. We note that % of YSO candidates are identified as Stage I sources. When grouped by longitude, the total numbers of Stage I, II, and III sources are 131, 69, 23 at l whereas 82, 43, 12 sources are distributed at l, respectively. The total number of acceptable sources that are SED fitted within the restricted region is 360. This number is 64% of the total number of sources that are selected from CMDs. A similar fraction of SED fitted stars is found in the G359.43+0.02 cluster. The total fraction of the SED fitted YSOs in Stage I is 60%. Assuming that these sources are within the central region and hence located at distances of 7.5 and 8.5 kpc, Tables 3 and 4 list the physical parameters of individual sources distributed at negative and positive longitudes, respectively.
5.3 Star Formation Rate
5.3.1 G359.43+0.02 Cluster
We now estimate the star formation rate (SFR) from the sum of average masses and luminosities derived from fitting of the SEDs of the YSOs. We first determine the SFR in the G359.43+0.02 cluster which is a subset of the detected YSOs found throughout the nuclear disk. The characteristics of this cluster are described in . The total stellar mass in the cluster is estimated to be . Assuming a distance kpc, SED fitting to a sample of 18 sources yields masses ranging from 8 to 20 and classifies 14 candidates in Stage I, three in Stage II and one in Stage III. This result suggests that the majority (nominally 78%) are Stage I YSOs, which have stellar ages years and masses in excess of 8 . or low-mass stars, The canonical age for a Class I source for low-mass stars is thought to be 1-5 years. This is based on the ratio of number of Class I to Class II sources in nearby star forming regions. The ages of the Class II sources are known from their stellar parameters (temperature, radius) and PMS stellar evolutionary tracks, so a combination of theory and observations. and Class 0 sources are estimated to be yrs, from ratio of the numbers and dynamical timescales of their outflows. For higher mass stars which presumably form much faster, we believe years for a Stage I source is reasonable (Lada, 1999; Beuther et al., 2007).
To compute the total cluster mass of only Stage I YSOs, we adopt a standard broken power-law form of the IMF (Whitney et al., 2008; Kroupa, 2001), with the number of stars per unit mass scaling as between 0.08 and 0.5 and as between 0.5 and 50 M⊙ (designated the Kroupa IMF hereafter). Figure 12b shows the broken power-law form, as a dashed line, which is normalized to pass through the peak in the histogram of the stellar mass distribution derived from SED fitting of the YSOs in the G359.43+0.02 cluster. The stellar mass associated with the Stage I YSOs in this cluster is 1400 .
The lack of observed high mass stars is most likely due to saturated sources and confusion. Another possibility is that the SED models of massive stars with a large inner hole in the surrounding material were not included in the grid, and thus are not represented in this study. Lastly, most massive stars embedded in the dense molecular material, which is on average 102 higher than that in the Galactic disk, may evolve rapidly. The residence time of an expanding remnant in dense molecular clouds such as found in the Galactic center is unknown. Numerical simulations are needed to examine whether the evolution of supernova remnants give shorter residence time in high density medium than in low density medium (Tilley et al., 2006). This may be relevant to the fact that the Galactic center region is known to host a high cosmic ray flux (Law et al., 2008). The advantage of using only Stage I YSOs is that the average lifetime of these sources is better constrained than when all YSOs are included. Assuming that the typical age of Stage I YSOs is 105 years, the SFR in this cluster is .
5.3.2 Nuclear Disk
SFR Using YSO Candidates
We now estimate the SFR in the nuclear disk restricted to a region between and . The characteristics of the YSOs are described in . The stellar mass associated with only Stage I YSOs gives a total mass of . The star formation rate is estimated to be 0.14 yr-1. Figure 12c shows the histogram of the mass distribution for both longitudes as well as the broken power law of the chosen IMF. SFRs for YSOs at negative and positive longitudes are estimated to be 0.1 and 0.05 yr-1, respectively. The SED fitting of YSOs confirms a 105 year duration of star formation because the number of Stage I YSO candidates dominates over Stage II and III YSOs. This implies an asymmetric star formation rate with respect to the Galactic center. The cause of this asymmetry could be due to a short-lived random event causing a lop-sided star formation rate or it might be due to a more stable structure, possibly related to the bar.
The mass of molecular gas in the central region allows us to determine the star formation rate per unit mass and compare it with the efficiency of star formation elsewhere in the Galaxy. The observed anti-correlation of molecular clouds and the population of YSO candidates suggest that molecular clouds have already been consumed in the formation of YSOs. If we make an assumption that a fraction of the molecular mass presently distributed in the central region has gone into formation of YSO candidates, and adopt an initial molecular gas mass of 10 , then the star formation efficiency is estimated to be . The total mass of molecular gas is estimated to be (Pierce-Price et al., 2000). The estimated star formation efficiency of the Galactic disk is 5 yr-1 (Güsten & Philipp, 2004). The dominance of Stage I YSO candidates relative to Stage II suggests that a burst of star formation must have occurred years ago, consistent with our estimate above being higher than the average star formation efficiency. The global properties of interstellar and stellar components of the Galactic center region also suggest star formation occurs in burst (Tutukov & Kruegel, 1978; Loose et al., 1982).
SFR Using Thermal Radio Measurements
If the candidate YSOs are massive and are sufficiently evolved, they are likely to produce HII regions that can be detected at radio wavelengths if their spectral type is earlier than B3 stars (Felli et al., 2000). To examine further the nature of infrared sources that have radio continuum counterparts, the masses inferred from radio data are compared with those inferred from SED fitting. Assuming the fluxes given in Table 1 are HII regions and are produced by optically thin bremsstrahlung radiation, then we can estimate the lower limit to the number of ionizing photons to sustain the ionization. As given by (Condon, 1992),
where Te is the electron temperature, is the observed frequency and Lthermal is the observed luminosity. The number of Lyman continuum photons per second calculated from 5 GHz data for radio sources 5 and 6 in Table 1 are 3.6 and 3.4 mJy corresponding to N. These rates are consistent with B2 ZAMS stars (Vacca et al., 1996; Panagia, 1973). The average masses estimated from SED fitting for sources 5 and 6 are 8.8 and 9.6 , respectively. The discrepancy between the inferred mass from free-free continuum flux and from SED fitting may come from the fact these YSOs are more evolved and SED modeling is not accounting for the Lyman continuum flux and therefore, mass determination may not be accurate. An additional uncertainty is that some of the YSO candidates may not be YSOs. These sources are likely to be found in high galactic latitudes as well as in the regions where there is no evidence for dense molecular clouds or IRDCs.
The resulting population of high-mass stars produces ionizing photons and associated free-free emission. For our adopted IMF, this population produces ionizing photons at a rate s-1 and a brehmsstrahlung flux of Jy at 5GHz. Recent single dish radio observations of this region show a flux density of Jy at 5 GHz which includes both thermal and nonthermal emission (Law et al., 2008). The large scale 4° 1 °radio study of this region shows that only 20% of the flux at 5GHz is likely to be thermal. Thus, the YSO population may contribute up to a quarter of the observed thermal emission from the Galactic center region assuming that the fraction of thermal to nonthermal emission is the same in the central 40050 pc ( and ) as it is in the central 4° 1 °. The remaining thermal flux of 150 Jy may be associated with highly evolved HII regions resulting from earlier generations of star formation activity. This point will be discussed further in section 7.
6 4.5m Excess Sources
In previous sections, we have identified YSO candidates in the Galactic center region by studying the CMDs of the point sources in the surveyed region. We then refined the list of selected point sources from the CMD. The SED fitting of these selected sources used IRAC, MIPS and 2MASS data. These YSOs are identified to be mainly of Stage I with an age of years. We now identify YSOs that may be in a phase of star formation younger than years by examining the color of their emission in the IRAC bands. Recent studies have identified “green fuzzies” on the basis of excess emission at 4.5m (Chambers et al. 2009). (the 4.5m sources are also known as ’extended green objects (EGSs)’ Cyganbowski et al. (2008)). Active cores show a correlation between 24m point sources and the ”green fuzzies” whereas a quiescent core shows no IR emission. The 4.5 m excess emission is considered to be due to shock excited H2 0-0 S(9) line emission (Noriega-Crespo et al., 2004) or the CO =1–0 rovibrational bandhead (Marston et al., 2004). Using this color selection criterion, a recent IRAC survey of the Galactic plane has identified a number of interacting supernova remnants showing excess emission at 4.5m, indicating shocked, excited CO and H2 molecular line emission (Reach et al., 2006). A strong correlation between shocked molecular H2 gas and methanol masers has also been noted (Lee et al., 2001), suggesting outflow is taking place at a very early stage of massive star formation, prior to the formation of a HII region. Also, more recently, the 4.5m excess emission has been detected in DR21, a massive star formation site, in which the excess 4.5m color is considered to be due a shocked molecular outflow (Marston et al., 2004; Smith et al., 2006; Cyganowski et al., 2008) or associated with high-mass protostars within the cores of IRDCs (Rathborne et al., 2005; Beuther et al., 2005).
6.1 Correlation with IRDCs
Since there is a great deal of molecular material as traced by IRDCs in the nuclear disk, we searched for excess emission at 4.5m (“green” in 3-color images combining 3.6, 4.5 and 8 m emission) that traces molecular line emission. A quantified indication of excess 4.5 m emission is obtained by constructing the ratio . This essentially is the ratio of the actual 4.5 m intensity to that determined by a power–law interpolation of the 3.6 and 5.8 m intensities. It was found empirically that a slight (10%) modification to the interpolation coefficients helps emphasize sources with unusually strong 4.5 m emission. In a map of this ratio across the entire IRAC survey of the Galactic center, most point sources exhibit a uniform ratio that is not very different from the background. In regions of high extinction (e.g. IR dark clouds, and Sgr B2), this ratio rises because the reddening reduces the 3.6 m intensity. However, there were of order 100 sources, located in regions of both high and low extinction that exhibit ratios distinctly higher than those of other sources in their vicinity (within several arc minutes). These include 33 sources that were visually selected as “green” sources in 3-color images. Their individual color images are shown in Figure 13; the 4.5m excess sources show both extended and compact emission. The ratio also clearly identifies a number of interesting sources that do not stand out in the 3-color images. Our search should be compared with two recent studies. Using an algorithm that finds “green fuzzies,” Chambers et al. (2009) identified excess 4.5m emission by confining to the cores of IRDCs. Another study by Cyganowski et al. (2008) visually identify “EGOs”. Our technique is sensitive to both compact and extended sources with 4.5m excess emission, unlike other searches.
The spatial distribution of the 4.5m excess sources is marked on Figure 14a which displays the ratio image of the region surveyed by IRAC. There are 33 sources that are characterized to have 4.5m excess emission, three of which (g1, g2 and g4) coincide with known planetary nebulae (Jacoby & Van de Steene, 2004). Thus, there are 30 sources that are candidate YSOs. It is quite possible that the list of 4.5m excess sources is contaminated by additional PNe, distributed in the crowded region of the Galactic center. Half of the 4.5m excess sources are near Sgr B2, G0.25+0.01, M-0.02-0.07, and Sgr C (G359.5-0.0). The rest appear to be distributed away from the Galactic plane, most likely associated with local objects distributed at negative latitudes. Although there is no bias in the selection of of 4.5m excess sources toward IRDCs, Figure 14a shows that most of the 4.5m excess sources are distributed in the vicinity of IRDCs. The highest density of 4.5m excess sources is near Sgr B2.
6.2 Correlation with Methanol Masers
To correlate the position of highly embedded YSO candidates with early sites of massive star formation, as traced by methanol masers, Figure 14b presents the spatial distribution of the known methanol masers on an 8m image. A survey of the inner 2 degrees of the Galactic center showed a total of 23 class II methanol masers at 6.7 GHz (Caswell, 1996). We used limited targeted surveys of class I methanol sources. The crosses show the position of class II methanol masers (Caswell, 1996). The 6.7 GHz methanol maser observations searched the region along the plane between and . Table 5 lists the position of the sources that are found within our IRAC survey. Table 6 shows the positions and fluxes of a subset of 4.5m excess sources that were observed with MIPS at 70m.
It is now well established that methanol masers are signposts of ongoing massive star formation throughout the Galaxy. Class II methanol masers are recognized to be radiatively pumped, unlike class I methanol masers, which known to be collisionally pumped (Menten, 1991). Tables 7 and 8 show the positions of class I and II methanol masers and their corresponding velocities, respectively. The correlation of methanol masers with the 4.5m excess sources in the surveyed region was first reported by Yusef-Zadeh et al. (2007a). The number of 4.5m excess sources distributed in the Galactic center region is 14 but we detected 6 methanol maser counterparts. Given the limited sensitivity of 1 Jy in the maser survey by Caswell (1996), it is possible that many of the 4.5m excess sources have weak maser counterparts or that they signify different evolutionary phases of massive protostars when compared with the onset of methanol maser emission. A more detailed study of the correlation of 6.7 GHz methanol masers and EGOs with IRDCs in the GLIMPSE data was recently reported by Cyganowski et al. (20008).
6.3 The SEDs of 4.5m Excess Sources
Using 2MASS, IRAC and MIPS point source catalogs as well as 850 and 450 m data (Pierce-Price et al., 2000), we constructed the SEDs of individual 4.5m excess sources to be used in model fitting. Due to the lower resolution of the submillimeter data and the excess flux of molecular emission in the 4.5m IRAC band, we show upper limits to the peak flux densities at 4.5, 450 and 850 m (Pierce-Price et al., 2000; Ramirez et al., 2008). The distances to many of the 4.5m excess sources are unknown due to the difficulty in estimating the kinematic distances of sources in the direction toward the Galactic center. We assumed that the sources that are distributed at high galactic latitudes are most likely foreground sources whereas the range of distances for low latitude sources galactic latitudes is restricted to and they are near the Galactic center. The model fitting for foreground sources was restricted to distances ranging between 2 and 6 kpc whereas the the range of distances for low galactic latitudes is between 7.5 and 8.5 kpc. The derived masses and luminosities of the 4.5m excess sources based on the well-fitted SED models are shown in Tables 9 and 10 for Galactic center and foreground sources, respectively. It should be pointed out that if the fitter finds a low-Av model to fit a source, that does not mean that the source is not at the Galactic center. The fitter will find models that can fit a range of Avs even if the source is at the Galactic center by restricting this variable to reasonable values. This restriction allows the underyling YSO models to more appropriate models for fitting that source. We note that for the very young sources that we believe are associated with 4.5m excesses, the YSO mass estimate is the current mass.
Assuming that the sources that are not SED fitted are YSOs, there are currently no available models in the grid to fit these sources. Also, the parameter “nfits” in Table 9 depends on how many datapoints are available. The fewer the datapoints, the more models can fit the data. If there are too many fits to the datapoints, it suggests the source is poorly constrained (which will show up in the standard deviations). On the other hand, if there are too few fits, it suggests the models are wrong (e.g., single source YSO trying to fit a cluster) or the data are bad. We note a a strong correlation between the number of data points and , as well as an inverse correlation between the number of data points and the number of ”acceptable” models. And as the number of acceptable models increases, the (relative) uncertainties also increase, especially for and . Nevertheless, it is clear that the number of fits and standard deviations allow us to identify well-constrained sources, unlike the CMD technique. We identify ten 4.5m sources in Stage I and four in Stage II and III evolutionary phases. The fraction of Stage I sources is 70% which is slightly lower than that found in the G359.43+0.02 cluster (78%) and higher than the fraction of 60% found in the region between and . This is consistent with the idea that the 4.5m excess sources are in their early phase of evolution. The Tables presented here give sufficient information for use of the fits in future studies.
The visual extinction levels derived from fitting the SEDs of the sources which are most likely located near the Galactic center range between 5 and 47 magnitudes. Figure 15a shows the fitted SEDs of selected sources with high extinction. The number of good fits, as seen in Figure 15 and Table 9, depends both on the quality of the data, and the number of models that happen to have an SED that looks like the one fitted. We note from Figure 15 that g0, g5, g27, g31 are not well fit by the models as they seem to have narrow peaks at about m, dropping down on either side. Thus, unlike the rest, these sources are unlikely to be accreting YSOs. The correlation of 4.5m sources and IRDCs is strong and is consistent with recent analysis by Chambers et al. (2009); we found 11 of the 4.5m sources are correlated with IRDCs, half of them are not extended and six of the 14 sources have methanol maser counterparts. The correlation of the majority of 4.5m excess sources with IRDCs, which are known to lie near the Galactic center, supports our initial choice for placing the low latitude 4.5m excess sources at the distance of the Galactic center.
Appendix 1 describes each of the Galactic center and foreground 4.5m excess sources.
7 Discussion
7.1 Star Formation History of the Nuclear Disk
To better understand the nature of star formation history in the complex region of the nuclear disk, we have used several different measurements. These measurements include 4.5m excess sources, Stage I YSOs, thermal HII regions and diffuse nonthermal radio flux, each of which is described below.
We adopt, as in section 5.3, a standard broken power-law form of the IMF (Whitney et al., 2008; Kroupa, 2001) to estimate on going star formation rate based on SED fitted 4.5m excess sources. We believe these excess sources trace the earliest phase of star formation. Given a large uncertainty in the completeness of 4.5m sources, the integrated mass of Stage I sources using Kroupa IMF, as before, is estimated to be 522 . Assuming that typical age of 4.5m excess sources is to years, we estimate SFR 0.017 to 0.009 yr-1, respectively. Given the vast amount of dense molecular gas corresponding to residing in the Galactic center region, the efficiency of star formation is estimated to be yr-1.
A more robust approach to estimate SFR, as discussed earlier in section 5.3.2, is to use the evidence for a population of Stage I YSO candidates in the nuclear disk and make an estimate of the SFR0.14 yr-1 in the last 105 years. The star formation rate during this period appears to be an order of magnitude higher that that estimated from 4.5m excess sources. These excess sources are in an earlier phase of their evolution and are younger than 105 years.
To estimate the SFR from young stellar objects older than 105 years, we used 24m flux density. This flux is representative of the ionizing flux and hence of ages of a few million years. We find a total 24m flux density of Jy within the central region, , (i.e., a radius of 182 pc). The K-band extinction over this region appears to average slightly more than two magnitudes (Dutra et al. 2003) and the observed ratio of A24/AK 0.5 (Chapman et al., 2009). We therefore corrected the observed flux density for 1.1 magnitudes of extinction. For a distance of 8.5 kpc, the resulting 24m luminosity is L⊙. In the formulation of Rieke et al. (2009), this luminosity implies a SFR of 0.07 M⊙ yr-1, assuming a Kroupa IMF. This estimate implicitly assumes that the SED fitted YSOs did not contribute significantly to the total measured flux at 24m.
Lastly, nonthermal radio emission can be used as another proxy to determine SFR. This SFR probably applies to conditions some tens of millions of years ago (Helou & Bicay 1993). The flux density of nonthermal emission is estimated to be 800 Jy at 6cm. If we extrapolate this flux to 21cm flux assuming a power law spectral index of 0.8, we derive a luminosity at this wavelength of 61.2 L⊙. This then yields a SFR of 0.007 M⊙ yr-1 (Rieke et al., 2009).
Taken together the above estimates provide a reasonable picture of large-scale star formation activity in the nuclear disk. We suggest that the region within pc of the Galactic center was in a very quiescent state years ago, and that the SFR has been rising slowly, peaking to a value of 0.14 M⊙ yr-1 around 105 years ago and then perhaps falling since then to the current value of 0.01 M⊙ yr-1.
7.2 The Schmidt-Kennicutt Law in the Galactic Center
A motivation for this work has been to test the influence of the extreme ISM conditions in the central 400 pc of the Milky Way on the process of star formation. We have found that the behavior of various SFR indicators is consistent with expectations from the global properties of other galaxies. The value of q24 = log(f21cm/f24μm) 2.1, where and represent flux densities at 21cm and 24m, respectively, is at the extreme high end of the range for external galaxies and is larger than is typically observed in the centers of nearby galaxies (Murphy et al. 2006) but can be explained in terms of a relatively low rate of star formation in the past. The properties of the individual forming massive stars also are consistent with those of similar objects elsewhere in the Galaxy.
A less ambiguous test for changes in star forming properties is based on the Schmidt-Kennicutt Law. This law is an empirical power-law relation between the surface densities of the interstellar gas and of star formation (see, e.g., Kennicutt 1998). If this law holds between the disk and center of the Milky Way, it would be strong evidence that the high interstellar gas temperatures in the latter region do not fundamentally alter the manner in which stars form there. Fuchs et al. (2009) have determined the relevant surface densities for the Milky Way disk near the sun and show that this region does indeed behave as expected according to the Schmidt-Kennicutt Law. We now estimate the same parameters for the central 0.8 kpc of the Galaxy. We take the mass in gas from Pierce-Price et al. (2000) to be M⊙. Our estimates of the SFR have a range: 0.007 M⊙ yr-1 from the non thermal radio, 0.03 M⊙ yr-1 from the youngest forming massive stars; 0.062 M⊙ yr-1 from the 24m luminosity; and a peak of 0.14 M⊙ yr-1 from the 105 year old YSO candidates. A long term time-averaged value can also be estimated. The enclosed mass in this region is M⊙ (Haller et al. 1996). Therefore, a strict upper limit on the average SFR over the past 1010 years is 0.15 M⊙ yr-1; a more plausible average would be 25% to 50% of this value. This average is in good agreement with our measurements of the recent SFR and suggests that the variations represent fluctuations around this average. We take the typical recent SFR to lie between 0.04 and 0.08 M⊙ yr-1. In Figure 16, we plot the Galactic center values on Figure 4 of Fuchs et al. (2009). In this figure, different types of Sa, Sb, and Sc galaxies are shown as open triangles, open circles, and filled circles. The red star is the value for the solar neighborhood and the blue cross is that for the Galactic center. The black line has a slope of 1.4, corresponding to the Schmidt-Kennicutt relationship found for external galaxies (Kennicutt 1998). The agreement is excellent, suggesting that to first order the star formation in the Galactic center region is not strongly affected by the environmental differences compared with the disk of the Galaxy.
8 Conclusions
In this paper, we have studied the distribution of interstellar dust clouds and the nature of star formation in the Galactic center region using the 24m Spitzer MIPS survey augmented with additional mid-IR, near-IR, submillimeter and radio data. By making use of MSX data in regions where the MIPS data are saturated, we constructed a complete 24 image of the Galactic center region with unprecedented sensitivity and resolution.
The comparison between the 24m and 8m images showed numerous examples of compact regions of 24 emission surrounded by partial shells of 8 emission. These structures are characteristic of H II regions, as seen throughout the Galactic plane, where luminous stars have heated large dust grains thus enhancing 24 emission, and have destroyed PAHs thus suppressing 8 emission.
We noted a number of elongated IRDCs distributed over a wide range of angular scales toward the Galactic center. Many of the IRDCs lie within a “bow-tie” structure, consisting of two layers parallel to the Galactic equator and at both positive and negative longitudes. Molecular line survey studies show counterparts to a large fraction of the IRDC of the bow-tie structure. The darkness of the two coherent IRDC layers provides relative locations of individual clouds with respect to each other. In particular, we note that clouds distributed on the positive longitudes (e.g., Sgr B2 and G0.25+0.01) are closer to us than those on the negative longitudes.
A result of the 24 imaging is the recognition of a population of compact and point sources distributed between the two layers of IRDCs. This population is predominantly found at negative galactic longitudes, and includes a distinct cluster of sources at G359.43+0.02. Many of these sources are YSO candidates. Candidates are selected as particularly red objects in the 24 - 8 color magnitude diagram, and characterized by modeling their SEDs. This led us to estimate the star formation rate of 0.14 yr-1 based on SED fitted Stage I YSO candidates. The preponderance of Stage I YSO candidates implies that massive star formation took place in the nuclear disk about years ago. The derived scale heights of the population of YSO candidates ( pc) as well as that of the molecular layer ( pc) suggest their being dynamically young. These measurements are consistent with a highly efficient burst of high mass star formation in the nuclear disk about 105 years ago. This aspect of the study characterizes the unique nature of the Galactic center region, apart from the general Galactic disk. Evidence for large-scale IRDCs throughout the Galactic center is consistent with the idea that massive star formation and massive cluster formation takes place in the central region of the Galaxy. Future study of this region with its steep gravitational potential provides a testing ground for large-scale formation of massive stars and/or star clusters.
Finally, we explored an independent means of identifying YSO candidates by finding sources with excess 4.5 emission, indicating the presence of shocked molecular emission from protostellar sources. This color distinction was used as a proxy to probe the sites of star formation even earlier than 105 yrs old. We found 33 sources that show excess 4.5m emission. Those at the lowest latitudes were presumed to be at the Galactic Center, while those at higher latitudes often shown indication of being more local sources. SED fitting as well as the correlation of 4.5m excess sources with methanol masers and IRDCs indicated the majority of these YSO candidates in Stage I and are likely to be associated with molecular outflows in sites of on-going star formation. Assuming that the 4.5m excess sources provide us with all the sites of on-going star formation and that the SED fitted mass determination of the 4.5m excess sources is applicable to these protostars, then we conclude that the efficiency of on-going star formation is lower than that estimated for the Galactic disk and is consistent with earlier studies of this region (Lis & Carlstrom, 1994). The estimated values of SFR over different time scales up to years ago suggest that large scale star formation in the nuclear disk is likely to be continuous over a long period. However, mild burst-like activity could increase SFR by an order of magnitude on a year time scale.
We acknowledge the use of SCUBA data taken by D. Pierce-Price. This work is partially supported by the NSF under award number AST-0807400 and JPL/Caltech contract 1255094.
References
- Adams et al. (1987) Adams, F. C., Lada, C. J., & Shu, F. H. 1987, ApJ, 312, 788
- Arendt et al. (2008) Arendt, R. G., Stolovy, S. R., Ramirez, S. V., Sellgren, K., Cotera, A. S., Law, C. J., Yusef-Zadeh, F., Smith, H. A., & Gezari, D. Y. 2008, ArXiv e-prints, 804
- Argon et al. (2000) Argon, A. L., Reid, M. J., & Menten, K. M. 2000, ApJS, 129, 159
- Armstrong & Barrett (1985) Armstrong, J. T. & Barrett, A. H. 1985, ApJS, 57, 535
- Bally et al. (1988) Bally, J., Stark, A. A., Wilson, R. W., & Henkel, C. 1988, ApJ, 324, 223
- Bania (1977) Bania, T. M. 1977, ApJ, 216, 381
- Becker et al. (1994) Becker, R. H., White, R. L., Helfand, D. J., & Zoonematkermani, S. 1994, ApJS, 91, 347
- Beuther et al. (2007) Beuther, H., Churchwell, E. B., McKee, C. F., & Tan, J. C. 2007, in Protostars and Planets V, ed. B. Reipurth, D. Jewitt, & K. Keil, 165–180
- Beuther et al. (2005) Beuther, H., Sridharan, T. K., & Saito, M. 2005, ApJ, 634, L185
- Binney et al. (1991) Binney, J., Gerhard, O. E., Stark, A. A., Bally, J., & Uchida, K. I. 1991, MNRAS, 252, 210
- Carey et al. (2000) Carey, S. J., Feldman, P. A., Redman, R. O., Egan, M. P., MacLeod, J. M., & Price, S. D. 2000, ApJ, 543, L157
- Carey et al. (2009) Carey, S. J., Noriega-Crespo, A., Mizuno, D. R., Shenoy, S., Paladini, R., Kraemer, K. E., Price, S. D., Flagey, N., Ryan, E., Ingalls, J. G., Kuchar, T. A., Pinheiro Gonçalves, D., Indebetouw, R., Billot, N., Marleau, F. R., Padgett, D. L., Rebull, L. M., Bressert, E., Ali, B., Molinari, S., Martin, P. G., Berriman, G. B., Boulanger, F., Latter, W. B., Miville-Deschenes, M. A., Shipman, R., & Testi, L. 2009, PASP, 121, 76
- Caswell (1996) Caswell, J. L. 1996, MNRAS, 283, 606
- Chapman et al. (2009) Chapman, N. L., Mundy, L. G., Lai, S.-P., & Evans, N. J. 2009, ApJ, 690, 496
- Churchwell et al. (2007) Churchwell, E., Watson, D. F., Povich, M. S., Taylor, M. G., Babler, B. L., Meade, M. R., Benjamin, R. A., Indebetouw, R., & Whitney, B. A. 2007, ApJ, 670, 428
- Condon (1992) Condon, J. J. 1992, ARA&A, 30, 575
- Cyganowski et al. (2008) Cyganowski, C. J., Whitney, B. A., Holden, E., Braden, E., Brogan, C. L., Churchwell, E., Indebetouw, R., Watson, D. F., Babler, B. L., Benjamin, R., Gomez, M., Meade, M. R., Povich, M. S., Robitaille, T. P., & Watson, C. 2008, AJ, 136, 2391
- De Pree et al. (2005) De Pree, C. G., Wilner, D. J., Deblasio, J., Mercer, A. J., & Davis, L. E. 2005, ApJ, 624, L101
- Di Francesco et al. (2008) Di Francesco, J., Johnstone, D., Kirk, H., MacKenzie, T., & Ledwosinska, E. 2008, ApJS, 175, 277
- Dutra et al. (2003) Dutra, C. M., Ortolani, S., Bica, E., Barbuy, B., Zoccali, M., & Momany, Y. 2003, A&A, 408, 127
- Egan et al. (1998) Egan, M. P., Shipman, R. F., Price, S. D., Carey, S. J., Clark, F. O., & Cohen, M. 1998, ApJ, 494, L199+
- Felli et al. (2000) Felli, M., Comoretto, G., Testi, L., Omont, A., & Schuller, F. 2000, A&A, 362, 199
- Figer et al. (1999) Figer, D. F., Kim, S. S., Morris, M., Serabyn, E., Rich, R. M., & McLean, I. S. 1999, ApJ, 525, 750
- Flaherty et al. (2007) Flaherty, K. M., Pipher, J. L., Megeath, S. T., Winston, E. M., Gutermuth, R. A., Muzerolle, J., Allen, L. E., & Fazio, G. G. 2007, ApJ, 663, 1069
- Fuerst et al. (1987) Fuerst, E., Reich, W., & Sofue, Y. 1987, A&AS, 71, 63
- Gaume et al. (1995) Gaume, R. A., Claussen, M. J., de Pree, C. G., Goss, W. M., & Mehringer, D. M. 1995, ApJ, 449, 663
- Gordon et al. (2007) Gordon, K. D., Engelbracht, C. W., Fadda, D., Stansberry, J., Wachter, S., Frayer, D. T., Rieke, G., Noriega-Crespo, A., Latter, W. B., Young, E., Neugebauer, G., Balog, Z., Beeman, J. W., Dole, H., Egami, E., Haller, E. E., Hines, D., Kelly, D., Marleau, F., Misselt, K., Morrison, J., Pérez-González, P., Rho, J., & Wheaton, W. A. 2007, PASP, 119, 1019
- Güsten & Philipp (2004) Güsten, R. & Philipp, S. D. 2004, in The Dense Interstellar Medium in Galaxies, ed. S. Pfalzner, C. Kramer, C. Staubmeier, & A. Heithausen, 253–+
- Habing (1996) Habing, H. J. 1996, A&A Rev., 7, 97
- Haschick et al. (1990) Haschick, A. D., Menten, K. M., & Baan, W. A. 1990, ApJ, 354, 556
- Herrnstein & Ho (2005) Herrnstein, R. M. & Ho, P. T. P. 2005, ApJ, 620, 287
- Hinz et al. (2009) Hinz, J. L., Rieke, G. H., Yusef-Zadeh, F., Hewitt, J., Balog, Z., & Block, M. 2009, ApJS
- Jacoby & Van de Steene (2004) Jacoby, G. H. & Van de Steene, G. 2004, A&A, 419, 563
- Jones et al. (2008) Jones, P. A., Burton, M. G., Cunningham, M. R., Menten, K. M., Schilke, P., Belloche, A., Leurini, S., Ott, J., & Walsh, A. J. 2008, MNRAS, 386, 117
- Kerber et al. (2003) Kerber, F., Mignani, R. P., Guglielmetti, F., & Wicenec, A. 2003, A&A, 408, 1029
- Kroupa (2001) Kroupa, P. 2001, MNRAS, 322, 231
- Lada (1987) Lada, C. J. 1987, in IAU Symposium, Vol. 115, Star Forming Regions, ed. M. Peimbert & J. Jugaku, 1–17
- Lada (1999) Lada, C. J. 1999, in NATO ASIC Proc. 540: The Origin of Stars and Planetary Systems, ed. C. J. Lada & N. D. Kylafis, 143–+
- Lang et al. (1999) Lang, C. C., Morris, M., & Echevarria, L. 1999, ApJ, 526, 727
- Law & Yusef-Zadeh (2004) Law, C. & Yusef-Zadeh, F. 2004, ApJ, 611, 858
- Law et al. (2008) Law, C. J., Yusef-Zadeh, F., Cotton, W. D., & Maddalena, R. J. 2008, ApJS, 177, 255
- Lee et al. (2001) Lee, J.-K., Walsh, A. J., Burton, M. G., & Ashley, M. C. B. 2001, MNRAS, 324, 1102
- Li & Draine (2001) Li, A. & Draine, B. T. 2001, ApJ, 554, 778
- Lindqvist et al. (1992) Lindqvist, M., Habing, H. J., & Winnberg, A. 1992, A&A, 259, 118
- Lis & Carlstrom (1994) Lis, D. C. & Carlstrom, J. E. 1994, ApJ, 424, 189
- Lis et al. (2001) Lis, D. C., Keene, J., Phillips, T. G., Schilke, P., Werner, M. W., & Zmuidzinas, J. 2001, ApJ, 561, 823
- Lis & Menten (1998) Lis, D. C. & Menten, K. M. 1998, ApJ, 507, 794
- Loose et al. (1982) Loose, H. H., Kruegel, E., & Tutukov, A. 1982, A&A, 105, 342
- Lu et al. (2006) Lu, J. R., Ghez, A. M., Hornstein, S. D., Morris, M., Matthews, K., Thompson, D. J., & Becklin, E. E. 2006, Journal of Physics Conference Series, 54, 279
- Marston et al. (2004) Marston, A. P., Reach, W. T., Noriega-Crespo, A., Rho, J., Smith, H. A., Melnick, G., Fazio, G., Rieke, G., Carey, S., Rebull, L., Muzerolle, J., Egami, E., Watson, D. M., Pipher, J. L., Latter, W. B., & Stapelfeldt, K. 2004, ApJS, 154, 333
- Martin et al. (2004) Martin, C. L., Walsh, W. M., Xiao, K., Lane, A. P., Walker, C. K., & Stark, A. A. 2004, ApJS, 150, 239
- MarVsálková (1974) MarVsálková, P. 1974, Ap&SS, 27, 3
- Mehringer et al. (1998) Mehringer, D. M., Goss, W. M., Lis, D. C., Palmer, P., & Menten, K. M. 1998, ApJ, 493, 274
- Menten (1991) Menten, K. M. 1991, ApJ, 380, L75
- Morris & Serabyn (1996) Morris, M. & Serabyn, E. 1996, ARA&A, 34, 645
- Morris et al. (2006) Morris, M., Uchida, K., & Do, T. 2006, Nature, 440, 308
- Nord et al. (2004) Nord, M. E., Lazio, T. J. W., Kassim, N. E., Hyman, S. D., LaRosa, T. N., Brogan, C. L., & Duric, N. 2004, AJ, 128, 1646
- Noriega-Crespo et al. (2004) Noriega-Crespo, A., Moro-Martin, A., Carey, S., Morris, P. W., Padgett, D. L., Latter, W. B., & Muzerolle, J. 2004, ApJS, 154, 402
- Oka et al. (2005) Oka, T., Geballe, T. R., Goto, M., Usuda, T., & McCall, B. J. 2005, ApJ, 632, 882
- Oka et al. (1998) Oka, T., Hasegawa, T., Sato, F., Tsuboi, M., & Miyazaki, A. 1998, ApJS, 118, 455
- Omont (2003) Omont, A. e. a. 2003, A&A, 403, 975
- Panagia (1973) Panagia, N. 1973, AJ, 78, 929
- Paumard et al. (2006) Paumard, T., Genzel, R., Martins, F., Nayakshin, S., Beloborodov, A. M., Levin, Y., Trippe, S., Eisenhauer, F., Ott, T., Gillessen, S., Abuter, R., Cuadra, J., Alexander, T., & Sternberg, A. 2006, ApJ, 643, 1011
- Pierce-Price et al. (2000) Pierce-Price, D., Richer, J. S., Greaves, J. S., Holland, W. S., Jenness, T., Lasenby, A. N., White, G. J., Matthews, H. E., Ward-Thompson, D., Dent, W. R. F., Zylka, R., Mezger, P., Hasegawa, T., Oka, T., Omont, A., & Gilmore, G. 2000, ApJ, 545, L121
- Povich et al. (2007) Povich, M. S., Stone, J. M., Churchwell, E., Zweibel, E. G., Wolfire, M. G., Babler, B. L., Indebetouw, R., Meade, M. R., & Whitney, B. A. 2007, ApJ, 660, 346
- Ramirez et al. (2008) Ramirez, S. V., Arendt, R. G., Sellgren, K., Stolovy, S. R., Cotera, A., Smith, H. A., & Yusef-Zadeh, F. 2008, ApJS, 175, 147
- Rathborne et al. (2005) Rathborne, J. M., Jackson, J. M., Chambers, E. T., Simon, R., Shipman, R., & Frieswijk, W. 2005, ApJ, 630, L181
- Reach et al. (2006) Reach, W. T., Rho, J., Tappe, A., Pannuti, T. G., Brogan, C. L., Churchwell, E. B., Meade, M. R., Babler, B., Indebetouw, R., & Whitney, B. A. 2006, AJ, 131, 1479
- Rieke et al. (2009) Rieke, G. H., Alonso-Herrero, A., Weiner, B. J., Pérez-González, P. G., Blaylock, M., Donley, J. L., & Marcillac, D. 2009, ApJ, 692, 556
- Robitaille et al. (2007) Robitaille, T. P., Whitney, B. A., Indebetouw, R., & Wood, K. 2007, ApJS, 169, 328
- Robitaille et al. (2006) Robitaille, T. P., Whitney, B. A., Indebetouw, R., Wood, K., & Denzmore, P. 2006, ApJS, 167, 256
- Schuller et al. (2006) Schuller, F., Omont, A., Glass, I. S., Schultheis, M., Egan, M. P., & Price, S. D. 2006, A&A, 453, 535
- Sevenster et al. (1997a) Sevenster, M. N., Chapman, J. M., Habing, H. J., Killeen, N. E. B., & Lindqvist, M. 1997a, A&AS, 122, 79
- Sevenster et al. (1997b) —. 1997b, A&AS, 124, 509
- Sharpless (1959) Sharpless, S. 1959, ApJS, 4, 257
- Shiki et al. (1997) Shiki, S., Ohishi, M., & Deguchi, S. 1997, ApJ, 478, 206
- Simon et al. (2006) Simon, R., Rathborne, J. M., Shah, R. Y., Jackson, J. M., & Chambers, E. T. 2006, ApJ, 653, 1325
- Sjouwerman et al. (1998) Sjouwerman, L. O., van Langevelde, H. J., Winnberg, A., & Habing, H. J. 1998, A&AS, 128, 35
- Skrutskie et al. (1997) Skrutskie, M. F., Schneider, S. E., Stiening, R., Strom, S. E., Weinberg, M. D., Beichman, C., Chester, T., Cutri, R., Lonsdale, C., Elias, J., Elston, R., Capps, R., Carpenter, J., Huchra, J., Liebert, J., Monet, D., Price, S., & Seitzer, P. 1997, in Astrophysics and Space Science Library, Vol. 210, The Impact of Large Scale Near-IR Sky Surveys, ed. F. Garzon, N. Epchtein, A. Omont, B. Burton, & P. Persi, 25–+
- Smith et al. (2006) Smith, H. A., Hora, J. L., Marengo, M., & Pipher, J. L. 2006, ApJ, 645, 1264
- Stark et al. (1991) Stark, A. A., Bally, J., Gerhard, O. E., & Binney, J. 1991, MNRAS, 248, 14P
- Stolovy et al. (2006) Stolovy, S., Ramirez, S., Arendt, R. G., Cotera, A., Yusef-Zadeh, F., Law, C., Gezari, D., Sellgren, K., Karr, J., Moseley, H., & Smith, H. A. 2006, Journal of Physics Conference Series, 54, 176
- Taylor et al. (1993) Taylor, G. B., Morris, M., & Schulman, E. 1993, AJ, 106, 1978
- Tilley et al. (2006) Tilley, D. A., Balsara, D. S., & Howk, J. C. 2006, MNRAS, 371, 1106
- Tsuboi et al. (1999) Tsuboi, M., Handa, T., & Ukita, N. 1999, ApJS, 120, 1
- Tutukov & Kruegel (1978) Tutukov, A. & Kruegel, E. 1978, A&A, 67, 437
- Uchida et al. (1990) Uchida, K., Morris, M., & Serabyn, E. 1990, ApJ, 351, 443
- Vacca et al. (1996) Vacca, W. D., Garmany, C. D., & Shull, J. M. 1996, ApJ, 460, 914
- Val’tts et al. (2000) Val’tts, I. E., Ellingsen, S. P., Slysh, V. I., Kalenskii, S. V., Otrupcek, R., & Larionov, G. M. 2000, MNRAS, 317, 315
- Van de Steene & Jacoby (2001) Van de Steene, G. C. & Jacoby, G. H. 2001, A&A, 373, 536
- Wardle & Yusef-Zadeh (2008) Wardle, M. & Yusef-Zadeh, F. 2008, ArXiv e-prints, 805
- Watson et al. (2008) Watson, C., Povich, M. S., Churchwell, E. B., Babler, B. L., Chunev, G., Hoare, M., Indebetouw, R., Meade, M. R., Robitaille, T. P., & Whitney, B. A. 2008, ApJ, 681, 1341
- Whitney et al. (2008) Whitney, B. A., Sewilo, M., Indebetouw, R., Robitaille, T. P., Meixner, M., Gordon, K., Meade, M. R., Babler, B. L., Harris, J., Hora, J. L., Bracker, S., Povich, M. S., Churchwell, E. B., Engelbracht, C. W., For, B.-Q., Block, M., Misselt, K., Vijh, U., Leitherer, C., Kawamura, A., Blum, R. D., Cohen, M., Fukui, Y., Mizuno, A., Mizuno, N., Srinivasan, S., Tielens, A. G. G. M., Volk, K., Bernard, J.-P., Boulanger, F., Frogel, J. A., Gallagher, J., Gorjian, V., Kelly, D., Latter, W. B., Madden, S., Kemper, F., Mould, J. R., Nota, A., Oey, M. S., Olsen, K. A., Onishi, T., Paladini, R., Panagia, N., Perez-Gonzalez, P., Reach, W., Shibai, H., Sato, S., Smith, L. J., Staveley-Smith, L., Ueta, T., Van Dyk, S., Werner, M., Wolff, M., & Zaritsky, D. 2008, AJ, 136, 18
- Whitney et al. (2003a) Whitney, B. A., Wood, K., Bjorkman, J. E., & Cohen, M. 2003a, ApJ, 598, 1079
- Whitney et al. (2003b) Whitney, B. A., Wood, K., Bjorkman, J. E., & Wolff, M. J. 2003b, ApJ, 591, 1049
- Yusef-Zadeh et al. (1999) Yusef-Zadeh, F., Goss, W. M., Roberts, D. A., Robinson, B., & Frail, D. A. 1999, ApJ, 527, 172
- Yusef-Zadeh et al. (2004) Yusef-Zadeh, F., Hewitt, J. W., & Cotton, W. 2004, ApJS, 155, 421
- Yusef-Zadeh & Morris (1987) Yusef-Zadeh, F. & Morris, M. 1987, AJ, 94, 1178
- Yusef-Zadeh et al. (1984) Yusef-Zadeh, F., Morris, M., & Chance, D. 1984, Nature, 310, 557
- Yusef-Zadeh et al. (2005) Yusef-Zadeh, F., Wardle, M., Muno, M., Law, C., & Pound, M. 2005, Advances in Space Research, 35, 1074
- Zhao et al. (1993) Zhao, J.-H., Desai, K., Goss, W. M., & Yusef-Zadeh, F. 1993, ApJ, 418, 235
- Zoonematkermani et al. (1990) Zoonematkermani, S., Helfand, D. J., Becker, R. H., White, R. L., & Perley, R. A. 1990, ApJS, 74, 181
- Zylka et al. (1990) Zylka, R., Mezger, P. G., & Wink, J. E. 1990, A&A, 234, 133
9 Appendix
We assumed that the sources that are distributed at high galactic latitudes are most likely foreground sources whereas the low latitude sources () are near the Galactic center. We first describe 4.5m excesses sources which are most likely located in the Galactic center region followed by foreground sources. In all the figures presented below, the circles mark the position of the 4.5m excess sources. For extended 4.5m sources, the peak of the excess emission is used to identify the closest point sources in the IRAC and MIPS catalogs by Ramirez et al. (2008) and Hinz et al. (2009), respectively.
The squares represent sources that were observed at 70m. The distribution of class I and II methanol masers are also drawn on these figures as plus(+) and cross (x) signs, respectively.
9.1 Galactic Center 4.5m Excess Sources
G1.041-0.072 (g0)
This source lies at the eastern edge of the ridge of IRDCs and
is not well fit as it
shows a narrow peak in its SED, thus it is unlikely
to be at an early phase of a YSO.
The fitted
SED gives a protostellar source with a mass of .
This 4.5m excess
source has a 24m counterpart, as shown in Figure 17a and lies
within an arc-minute of an extended 8m and 24m HII
source G1.05-0.071 at l=1, b=. This extended source is also
shown in the 3-color image, as presented in Figure 13.
Figure 17b shows contours of 850m emission that trace
the elongated east-west
IRDC. The strongest 850m emission coincides
with G1.05-0.071.
G0.826-0.211(g3)
This 4.5m excess source is embedded in the IRDC associated with Sgr B2. The distribution of
the IRDC ridge at the location of g3 widens in a plume-like structure pointed southward of the
Galactic plane. Figure 17c,d show
contours of 450 and 850m emission from this
prominent IRDC. A 24m and 8m source coincides with g3, which is shown as a
circle in
Figure 17. This 4.5m excess source was also observed at 70m, as shown by a
square sign in Figures 17c,d, but was not detected (see Table 6). Most of the
well-known ultracompact HII regions associated with Sgr B2 are
located to the northwest of g3,
as shown in Figure 14a. The SED fit to this source gives a mass of 13.7 . This
4.5m excess source is located within 20′′ of SiO 17452-2819 with a radial velocity of 90
km s-1 (Shiki et al., 1997). The location of this maser source with respect to g3 supports the idea
that this SiO maser is associated with the Sgr B2 star forming region and is a counterpart to a
young stellar object. The correlation of submillimeter emission, IRDC, 24m point source
and excess 4.5m emission is consistent with g3 being a massive YSO associated with an active
core.
Sgr B2 (g6-g10)
The largest concentration of 4.5m excess sources is located in Sgr B2,
which is one of the most massive star forming sites in the Galaxy. SED fits to the five
4.5m excess sources g6 to g10 give the highest protostellar masses among the
4.5m excess sources, ranging between 8 and 22 . Figure 18a,b shows
contours of 450 and 850m emission that are superimposed on 8m and 20cm images
of Sgr
B2, respectively.
It is clear that the IRDC associated with Sgr B2 is traced remarkably
well by submillimeter and molecular line emission
from several active molecular
cores (Jones et al., 2008).
The distribution of compact HII
regions, as shown best at
20cm wavelength, indicates that they lie at the southern edge of
the dark cloud.
The distribution of UC HII regions as well as 24m sources
suggests
a later phase of massive star formation at the southern edge of IRDC where UC HII regions
are concentrated. However, the distribution of methanol sources
are seen silhouetted against the middle of the infrared dark cloud.
Figure
18c makes this point even clearer
by showing that most of the methanol sources
are displaced with respect to
24m sources heated by UC HII regions lie at the edge of the IRDC.
The high column density of Sgr B2 and the saturation of the brighter
24m sources
are likely
responsible for a lack of additional detection of 4.5m excess sources and YSO
candidates in Sgr B2.
Nevertheless, the projected displacement between 24m sources and
methanol sources
is consistent
with a picture that star formation in the IRDC associated with Sgr B2 has
taken place from outside in.
Figure 18d shows contours of emission from one of the 4.5m excess sources, g6, that shows extended emission at 4.5m. Three of the five 4.5m excess sources, g6, g8 and g9, coincide with ultracompact HII regions Sgr B2 R, I and F (Gaume et al., 1995). We note that Sgr B2-F itself breaks up into multiple radio components that are considered to be members of a cluster of massive ultracompact HII regions (De Pree et al., 2005). The parameters of the SED fit to g9 should be considered with caution, given that multiple sources could contribute to the SED. Fortunately, the flux from a cluster of massive stars is likely to be dominated by the most massive star as luminosity is a steep power of mass and thus the assumption of all the luminosity arising from a single cluster member is reasonable.
G0.376+0.04 (g16)
The 4.5m excess
source associated with g16 is detected against the IRDC ridge
at G0.376+0.04. This source coincides with one of the string of
submillimeter emitting clouds, known as the dust ridge in Figure 1c (Lis & Menten, 1998).
g16 coincides with a
class II methanol maser at a velocity of 37 km s-1 that is
listed as source 8 in Table 8.
Molecular line studies of the ridge of IRDCs are dominated by
velocities ranging between 20 and 30 km s-1 (Oka et al., 2005).
Figures 19a,b show contours of 450m and 850m emission
and are superimposed on
grayscale 24m and 20cm images of this cloud. This is the first
evidence that
this cloud shows a signature of massive star formation as the fitted SED
indicates 10 for this YSO, the first evidence that this cloud is a site
of massive star formation (Argon et al., 2000).
Following the definition of active and quiescent cores by Chambers et al. (2009),
the eastern half of the IRDC ridge is in its quiescent phase of
star formation whereas the western half is forming massive YSOs.
The 4.5m excess source also lies in the vicinity
of a nonthermal radio filament that appears to terminate in the IRDC and
about 1′ east of g16, as shown in Figure 19b.
Figure 19c shows contours of 4.5m emission from G0.376+0.04.
G359.932-0.063 (g23)
This 4.5m excess
source lies at the edge of
the 50 km s-1molecular cloud M-0.13-0.08 (Herrnstein & Ho, 2005; Armstrong & Barrett, 1985).
Figures 20a,b show contours of submillimeter emission
from two prominent 50 km s-1 and 20 km s-1 molecular clouds, known to
be the closest clouds to the Galactic center.
Contours of 450m and 850m emission from
these clouds are superimposed on the
8m and 20cm images of the Sgr A region, respectively.
The 50 km s-1 cloud is known to be interacting with the Sgr A E East SNR G0.0+0.0
(Zylka et al., 1990)
and several OH masers at 1720 MHz have trace the interaction site (Yusef-Zadeh et al., 1999).
The shell-like Sgr A East supernova remnant is shown in Figure 20b.
The position of
g23 lies within five arcseconds of OH(1720 MHz) maser H at a velocity of 49 km s-1.
The excess 4.5m emission at this position could be associated with the
supernova shock interaction.
4.5m excess emission has been seen toward a number of
supernova remnants (Reach et al., 2006).
However, the parameters of the SED of this
source suggest that G359.23-0.063
is associated with a 11 protostar (see Table 9).
If so, the protostar presents the earliest phase of massive star
formation in the 50 km s-1 cloud, perhaps triggered by the interaction
with the expanding Sgr A East supernova remnant.
A chain of ultracompact HII regions
northeast of g23 may trace massive star formation at
a later phase than that shown by g23. Figure
20c shows a 24m image
of IRDC associated with the 50 km s-1and clearly shows the IRDC toward the
region where g23 is detected. The evidence for collisionally excited
methanol emission
has also been reported toward the 50 km s-1 ((Haschick et al., 1990), see source 2 in Table 7). This
result supports supports
the presence of massive star formation in this region.
Figure 20d shows contours of 4.5m emission from g23.
The 20 km s-1 and 50 km s-1 IRDCs are also located in a region where 19 radio filaments (A1-A19) have been detected at 20cm (Yusef-Zadeh et al., 2004). Two of these nonthermal radio filaments RF-A3 and RF-A9 are labeled in Figure 20b. The nonthermal filaments (e.g., G359.90-0.07 and G359.88-0.07) may be interacting with the 20 km s-1molecular cloud (Yusef-Zadeh et al., 2005).
G359.841-0.080 (g25)
G359.841-0.08 is another 4.5m excess
source that is found at the western edge of
the 20 km s-1 molecular cloud
M-0.02-0.07 (Herrnstein & Ho, 2005; Armstrong & Barrett, 1985),
which is traced by the prominent
IRDC at 24m, as presented in Figure 20c. Evidence for a signature of star
formation is supported by the presence of star formation by a class I
methanol maser and a HII region
toward the eastern half
of the cloud. The methanol maser source
is detected
at a velocity of 21 km s-1 (Haschick et al., 1990; Val’tts et al., 2000).
Additional observations are needed to confirm the association of
this 4.5m excess
source with the 20 km s-1cloud. Contours of 4.5m emission are
shown in Figure 20d. The peak of submillimeter emission from the
20 km s-1 IRDC shows no signs of star formation, thus, is considered to be
a quiescent core.
G359.599-0.032 (g27)
This 4.5m excess source is projected against the IRDC ridge,
on the negative longitude
side of the Galactic center.
Figure 21a,b shows a 24m and 6cm
continuum images of this
source, respectively, and the contours of 4.5m emission are shown in
Figure 21c. The parameters of
the fit to this source suggests a
14.5 protostar.
However, g27 shows a narrow peak in its SED and
is not fitted well by the
models.
This source is located about 35′′ north of an HII region
and a shell-like structure with a diameter of 30′′ centered at G359.61-0.045.
The shell-like structure is best seen at 24m in Figure 21a.
G359.437-0.102 (g29)
Figure 22a,b shows contours of 450m and 850m emission superimposed
on 8m and 20cm continuum images of the Sgr C HII region, respectively. This
well-known HII region is one of the brightest extended HII regions in the Galactic
center region.
The Sgr C HII
region was saturated at 24m, so we combined the image with the MSX image at the
same wavelength band.
The Sgr C IRDC is elongated and runs roughly along the Galactic plane. It is
detected at both 8m
and 24m, as shown in
Figure 22c. This IRDC is traced by submillimeter emission showing several
cores along its elongated structure.
The peak emission at 24m coincides with the peak HII
emission at 20cm and suggests that warm grains are being heated by the central O4
star.
The 4.5m excess source g29 lies at the peak of the submillimeter emission and is shown as a circle in Figure 22a,b,c. The crosses show the positions of class II methanol masers with velocities of -52 and -53 km s-1. The masers are listed as sources number 1 and 2 in Table 8. Radio recombination line measurements of the Sgr C HII region show a radial velocity of km s-1(Liszt 1992; Liszt and Spiker 1995). Figure 22d shows contours of the extended 4.5m excess emission. The corresponding color image of the 4.5m excess source can be seen in Figure 13. The modeled SED of the 4.5m excess source G359.436-0.102 in Sgr C indicates that the central protostellar candidate coincides with the northern maser source. Figure 15a shows the best fitted models to the data using 2MASS, IRAC, MIPS and SCUBA data accounting for 22 magnitudes of visual extinction. This SED fit is consistent with the identification of the 4.5m excess source with a massive 14 protostellar source (see Table 9) associated with the methanol masers.
The region surrounding 4.5m excess source (g29) is complex. The emission at 4.5 and 5.8m is extended whereas the emission at 8m has a point-like structure and does not appear to have a counterpart at shorter wavelengths. The 8m source is away from the center of the 4.5m emission. There are three other nearby compact sources; higher resolution study is needed to clarify the nature of these 8m sources. However, it is most likely that the extended emission from the region close to the 4.5m excess source represents shocked molecular outflow from the YSO candidate. This is consistent with the presence of submillimeter core, methanol masers, IRDC and 4.5m excess, all of which suggest an active phase of massive star formation at the northwestern edge of Sgr C. The southeastern half of the IRDC shows no signs of active star formation.
There is a puzzling feature at the northeastern boundary of Sgr C IRDC, a lack of strong free-free radio continuum and submillimeter emission l=-, b=. This implies that there is a cavity in the ionized gas and emission by dust at the interface between the submillimeter core and the Sgr C HII region. However, it is possible that the appearance of the cavity results from poor sensitivity in the submillimeter.
At 20cm, there is a compact bright continuum source at l= , b= which is about 1′ or 2.4 pc (the Galactic center distance of 8.5 kpc) from the positions of the methanol masers. The flux density of this source is 20 mJy. The most prominent nonthermal radio filaments of Sgr C, as shown in Figure 22b, becomes quite faint inside the HII complex. The long nonthermal filaments appear to lie at eastern edge of the Sgr C cavity and the HII region. Like other filaments described in the Sgr A and Sgr B clouds, the prominent nonthermal filament appears to terminate at the Sgr C IRDC.
G359.30+0.033 (g30)
This 4.5m excess
source is detected at the edge of an elongated and narrow IRDC at l=40′, b=2′.
This feature appears to widen in the direction away from the Galactic plane,
resembling the vertical molecular Clumps 1 and 2
that are found at l=3550 and l=30 and b=00 (Bania, 1977).
Figures
23a,b show an 8m and 24m images of this remarkable filamentary
dark cloud. The cloud is drawn schematically in Figure 1c. The brightness
of this cloud in the ratio map shown in Figure 3b suggests that it is likely to be
on the front side of the Galactic center.
Contours of 4.5m emission from the region where excess emission is detected
at this wavelength are shown in Figure 23c.
The fit to the SED of this source suggests a 8.9 .
protostar (see Table 9).
G359.199+0.041 (g31)
This 4.5m excess
source is projected against an east-west elongated IRDC.
Figures 24a,b show 24m and
20cm continuum images of this source.
A methanol maser source and a 20cm continuum
source lie in its vicinity, 4′ away from the 4.5m excess
source.
If the methanol source is associated with the same IRDC toward which the 4.5m
excess
source is detected, then the IRDC is a site of massive star formation.
Contours of 4.5m emission from this cloud are shown in Figure 24c.
The fit to the SED of this source suggests a
14.4 protostar (see Table 9). However, the SED is not fitted well
by the models because of the narrow peak at mid-IR wavelengths.
G358.980+0.084 (g32)
The 4.5m excess
source 32 is projected at the center of an IRDC which has a
spidery appearance. Figures 25a,b show 24m and 8m
images of this source. There is no evidence of a compact radio
counterpart at 20cm to the 4.5m excess
source, though, a compact source is
detected about 1′ southwest of it. The
methanol maser coincident with the position of the 4.5m excess
source supports the presence of on-going massive star formation in this dark
cloud.
The SED fit to the source identified by its excess 4.5m emission
gives a 7.6 ṗrotostar. Figure 25d presents contours of 4.5m
emission
from this source.
9.2 Foreground 4.5m Excess Sources
Figure 15b and Table 10 show the SEDs of individual foreground sources and list the physical characteristics derived from the fits, respectively. The estimated Av range between 4 and 33 magnitudes. Due to the distance uncertainty, the mass estimate is not well constrained. We note that with the exception of three sources, all the 4.5m excess sources appear to be extended. In addition, with the exception of one, all the SED fitted sources appear to be in Stage I suggesting their early evolutionary phase.
0.955-0.786 (g1), 0.868-0.697 (g2) and 0.780-0.740 (g4)
All the three 4.5m excess
sources g1, g2 and g4 are
located at the edge of the region surveyed with IRAC.
Source g1, g4 and g2 coincide with the positions of
three
planetary nebulae JaST 76 and JaST 70 in (Van de Steene & Jacoby, 2001) and
PN G0.8-0.6 in (Kerber et al., 2003), respectively. The SEDs of these sources
are shown in Figure 16b. The successful fitting of these PNe
shows that SED fitting can not be used
to distinguish them from other source types.
Additional compact
4.5m excess sources may be
PNe that are misidentified as YSOs.
G0.708+0.408 (g5)
This source is projected against an IRDC observed
with the MIPS and IRAC data.
Figures 26a,b show a 24m image and
a 4.5m contour of the 4.5m excess
source.
The SED fit to this source suggests a 6 protostar (see Table 10) as
shown in Figure
16b. However, the SED is not
fit fit well because of its narrow peak.
4.5m Excess
Sources Associated with Sh20 (g11-g15, g12-g14)
Several 4.5m excess
sources associated with Sh20, are distributed at negative latitudes
where several prominent optical emission nebulae have been
identified. The 4.5m excess sources
g11, g12, g13, g14 and g15
are most likely associated Sh20 (Sharpless 20)
centered at l=0.5,
b=-0.3 with
an extent of 10′
(MarVsálková, 1974).
The SED fitting to these 4.5m excess
sources give masses in the range between 2 and 14 (see
Table 10).
Figures 27a,b show 24m and 8m images of G0.542-0.476 where 4.5m excess source g11 is detected. The 4.5m excess source appears to be projected against a dearth of emission at 8m in the vicinity of an elongated IRDC with an extent of 2′. A sharp linear feature with an extent of lies to the north. The lack of a counterpart at 24m and/or at radio wavelengths suggests that this linear feature is likely to arise from PAH emission. Figure 27c shows a radio continuum image of the region where g11 is detected and Figure 27d shows a 4.5m contour map of g11.
Other 4.5m excess sources that appear to be associated with Sharpless 20 are G0.517-0.657 (g12), G0.483-0.701 (g13) and G0.477-0.727 (g14). Figures 28a,b,c show 24m, 8m and 20cm grayscale images of the region where these 4.5m excess sources are detected. The 4.5m emission contours for g12, g13 and g14 are shown in Figures 28d,e,f, respectively. It is clear that this is a region of massive star formation where sharp extended shell-like structures and a compact radio continuum source coincident with g14 are seen at 24m and 20cm. No 8m counterparts are found.
Another HII structure with the appearance of a “question mark” is a component of Sharpless 20. The 4.5m excess source g15 lies at the center of this HII region. Figures 29a,b,c show grayscale images at 24m, 8m, and 20cm, respectively, where as a contour map of g15 at 4.5m is shown in Figure 29d.
G0.315-0.21 (g17)
This 4.5m excess
source lies in the vicinity of two stellar cluster candidates
that are located within one arc-minute of each other and within the Sh2-20
HII region (Sharpless, 1959; Dutra et al., 2003).
This cluster also has variable X-ray emission, indicating very young stars
(Law & Yusef-Zadeh, 2004). Figures 30a,b show contours at
450m and 850m superimposed on a grayscale 24m and
20cm images of this HII region.
Two sources in the 24m and 20cm
images lie in the vicinity of a submillimeter peak.
Contours of 4.5m emission
from both the northern and southern sources are shown in
Figure 30c. The 4.5m excess
source coincides with the southern component
of the emission shown in these figures.
The presence of methanol masers
coincident with the 4.5m excess
source and a bright submillimeter peak
provide strong
evidence for massive star formation in this region.
The fit to the SED of the 4.5m excess
source is also consistent with
12.8 protostar.
G0.167-0.445 (g18), G0.091-0.663 (g19) & G0.084-0.642 (g20)
The 4.5m excess
sources g18, g19 and g20
are projected toward the HII region RCW 141,
which is centered
near l=0.3, b=-0.2
with an extent of 6.
Figures 31a,b show 8m and 20cm grayscale images of g18, respectively.
The two 8m sources appear to be embedded within an IRDC. However, the one
indicated by a cross shows strong excess emission at 4.5m.
A nonthermal radio filament that runs perpendicular to the
Galactic plane is projected
against the 4.5m excess
source.
Figures 32a,b show grayscale 24m and 8m images
of g19 and g20, respectively. It is clear that the southern source
g19 is embedded in an IRDC. Figure 32c shows that neither of these
4.5m excess
sources has 20cm continuum counterparts.
Figures
32d,e show contours of
4.5m emission from g19 and g20, respectively.
G359.939+0.170 (g22)
The 4.5m excess
source g22 is located in an HII complex with an IRDC and
a prominent 8m nebulosity. Figures 33a,b show
contours of 850m emission superimposed on
grayscale images at 24m and 20cm, respectively.
The 850m emission and the IRDC at 24m
appear to lie at the edge of the nonthermal filament, as seen
in Figure 33b.
A large-scale view of the dark cloud and
the extensive 8m emission to its eastern edge are shown
in Figure 33c. Contours of the source responsible for excess
4.5m emission are shown in Figure 33d.
G359.972-0.459 (g21), G359.907-0.303 (g24) & G359.618-0.245 (g26)
The 4.5m excess
sources g21, g24 and g26 are
distributed in the vicinity of RCW 137 which is roughly
centered close to l=0.1, b=-0.3
with an extent of 2. The most interesting of these 4.5m excess
sources is g26, which is embedded in a prominent submillimeter
core tracing an IRDC.
Figures 34a,b show contours of 450m and 850m emission
superimposed on
8m and 20cm grayscale images of the IRDC associated with g26.
The submillimeter cone-shaped structure peaks where
methanol maser emission is detected. The closeness
of methanol masers, the 4.5m excess
source and the submillimeter core support the evidence for
massive star formation in this cloud. Figure 34c shows
contours of 4.5m emission from
g26, which has an estimated 7 protostar (see Table 10).
G359.57-0.27 (g28)
The 4.5m excess
source g28 lies at the edge of an IRDC
that extends for
2′. Images of the region at 24 and 8m are
shown in
Figures 35a,b.
g28 is located in the darkest area of the IR dark cloud, which shows
an east-west elongation.
The source was also detected at 70m, which allows
us to constrain the mass of the YSO candidate to be
4 assuming an Av=4. Contours of 4.5m emission
are shown
Figure 35c.

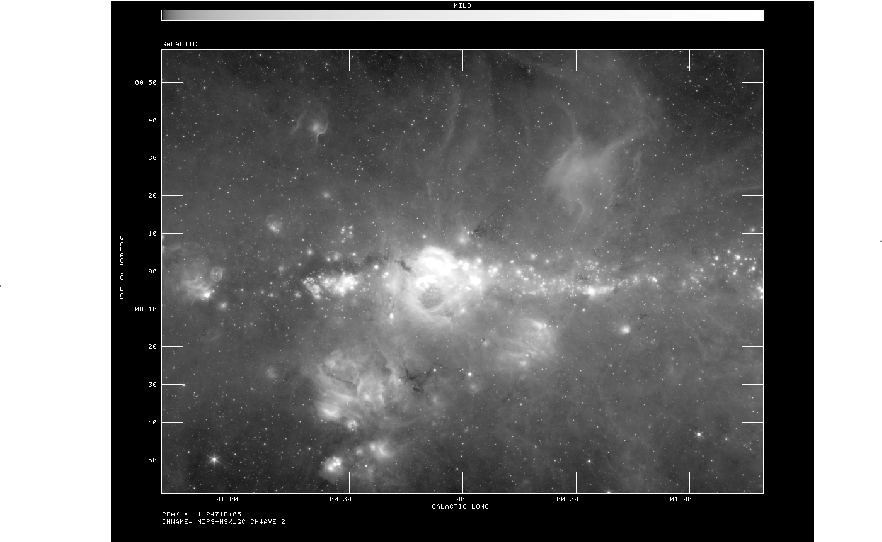
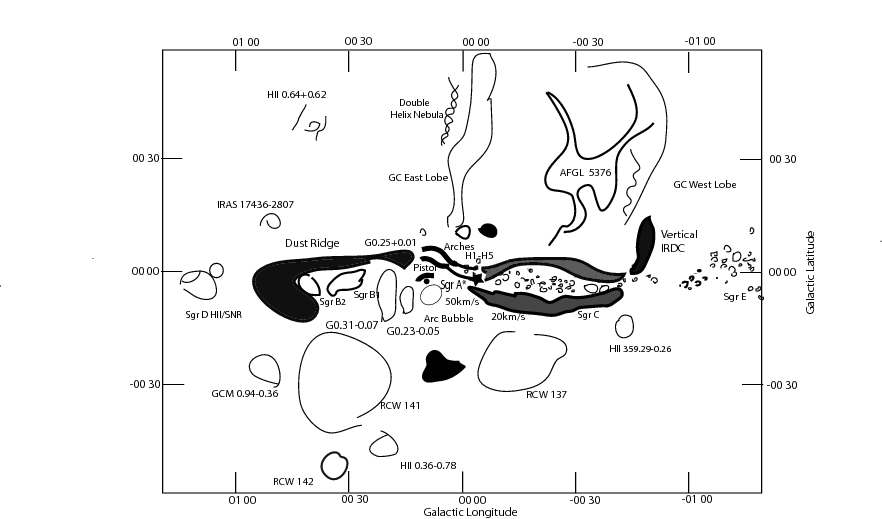


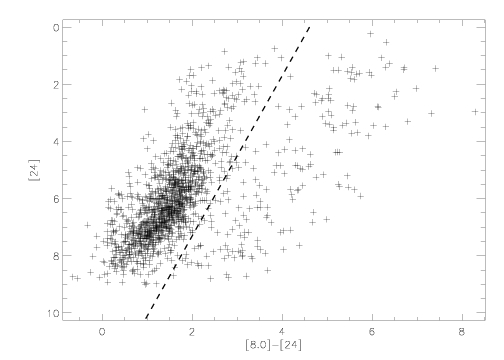
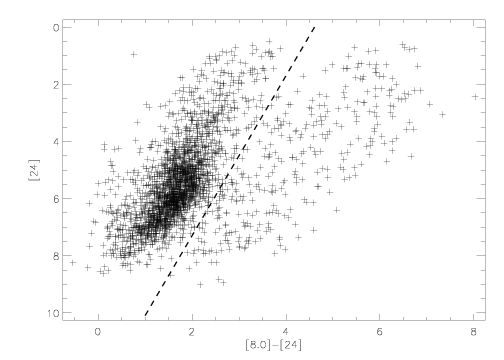
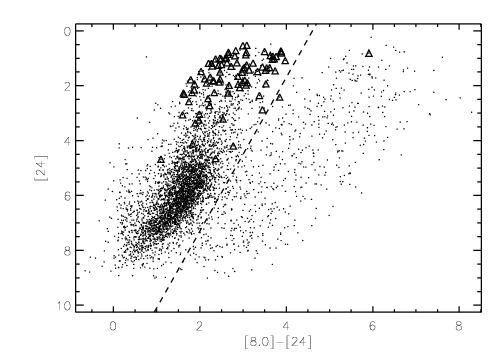
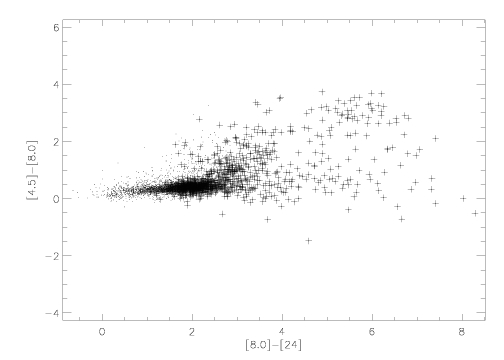
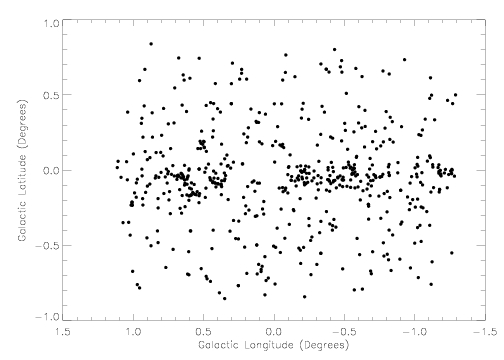
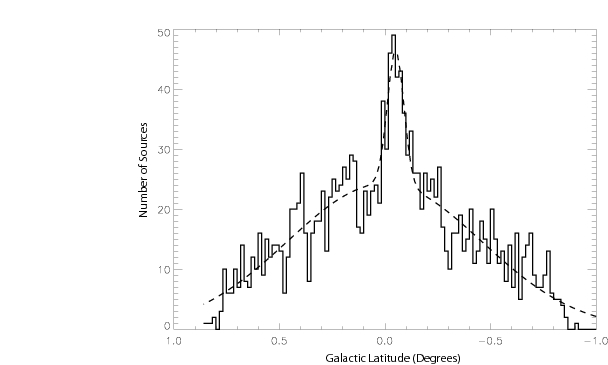
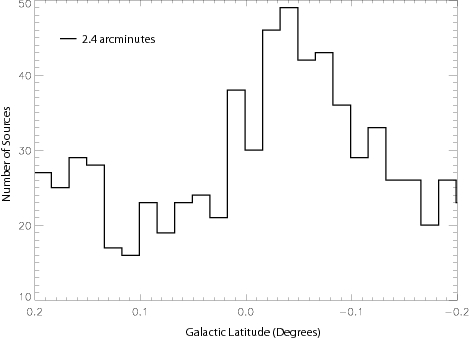


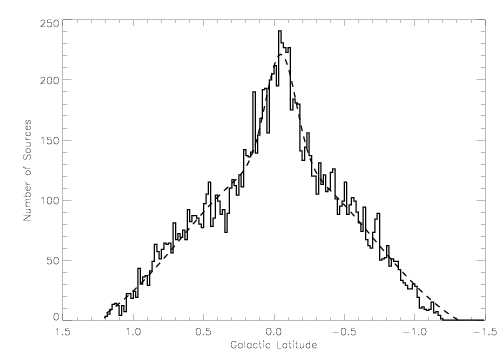
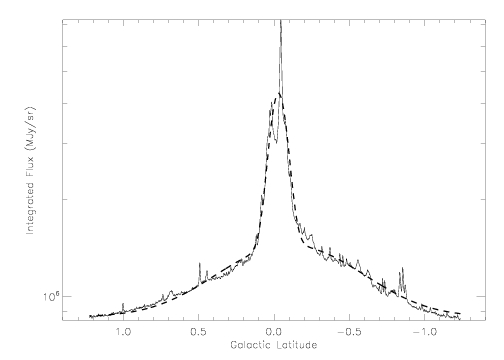
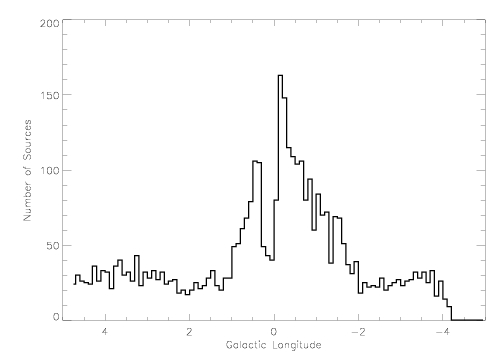
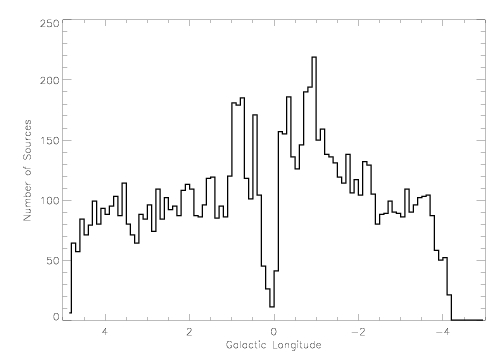
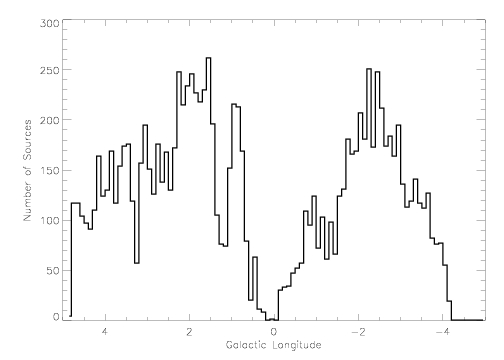
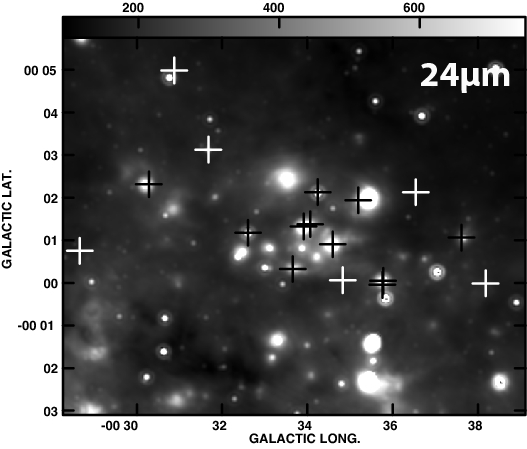
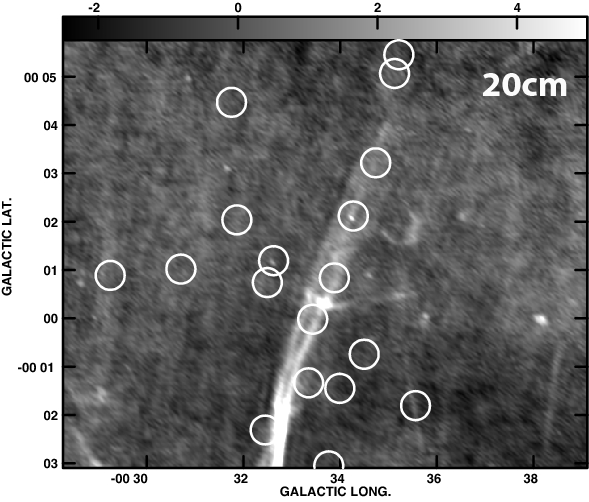
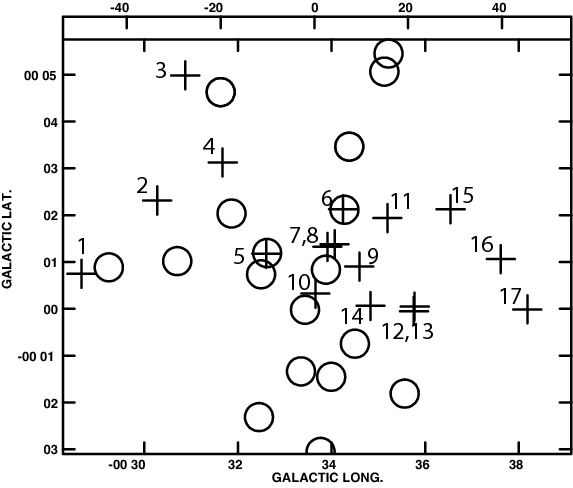
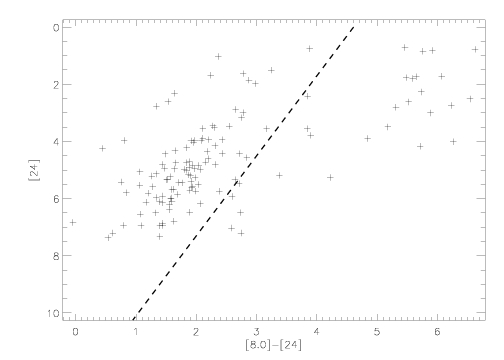
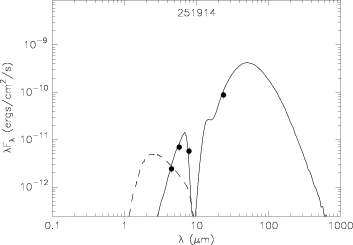
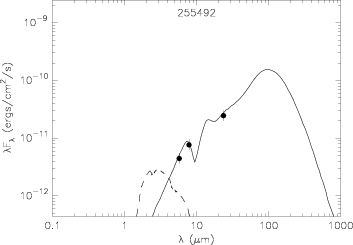
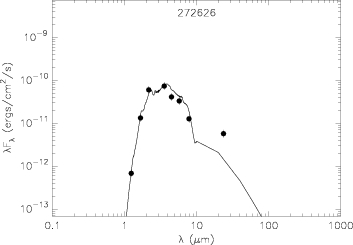
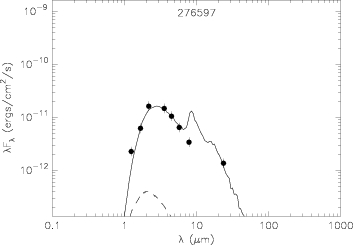
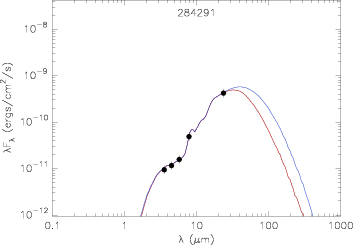
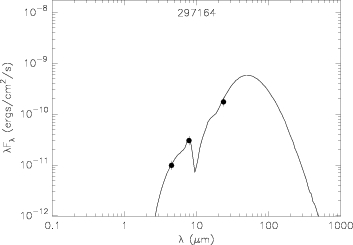
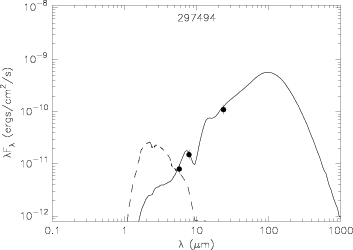
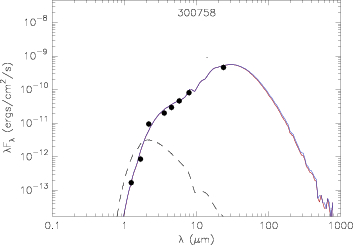
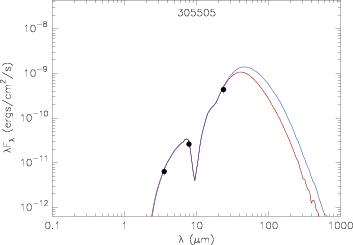
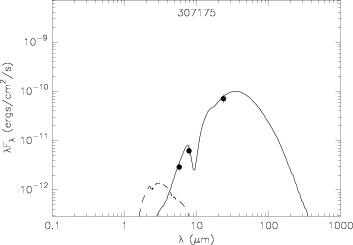
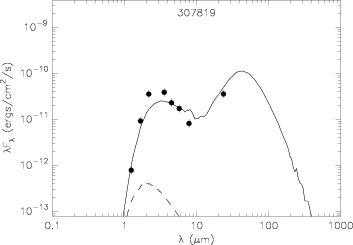
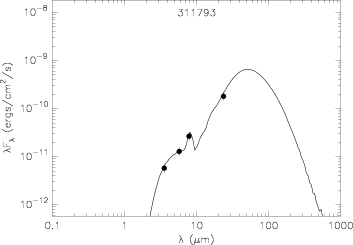
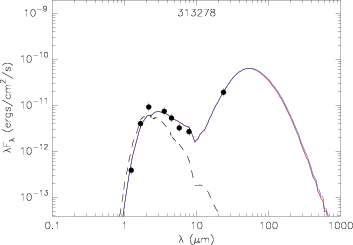
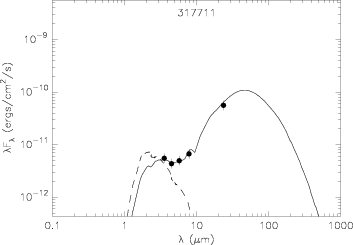
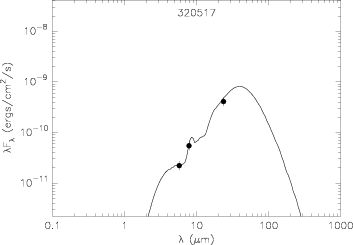
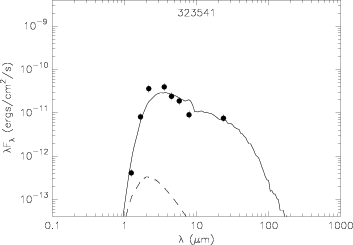
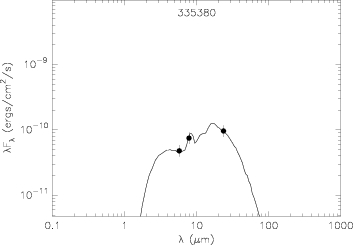
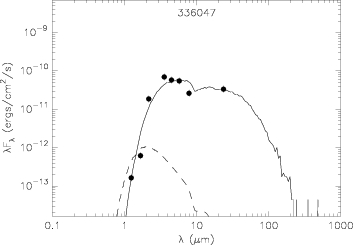
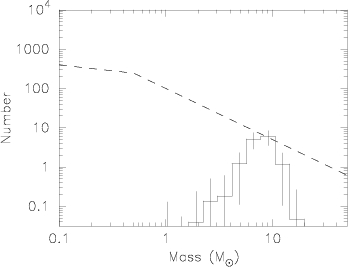
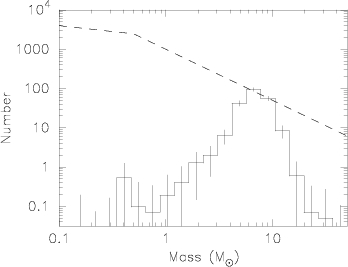
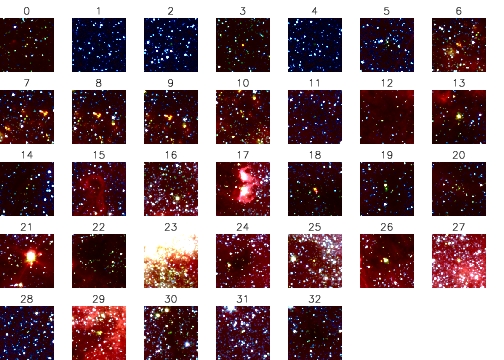
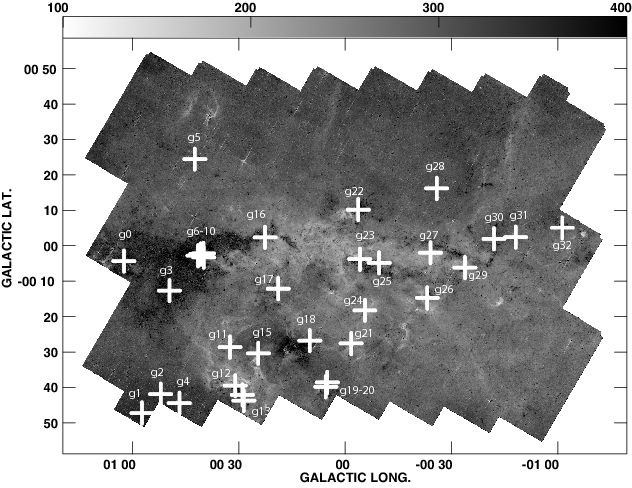

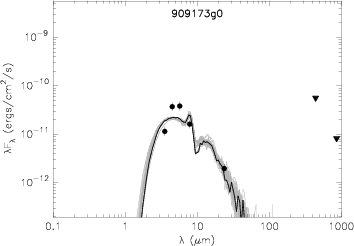
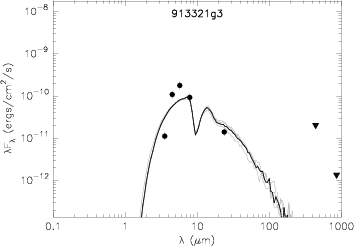
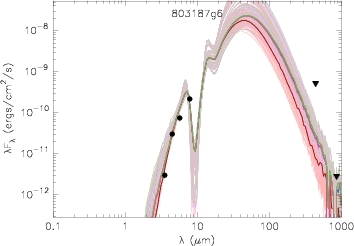
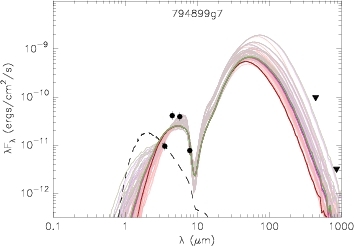
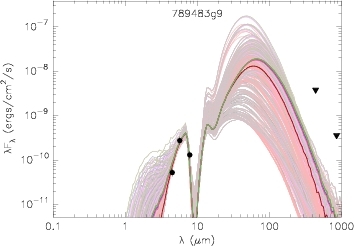
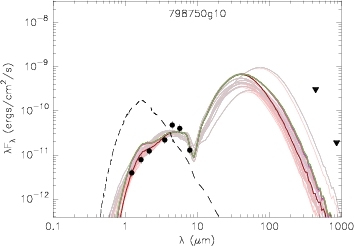
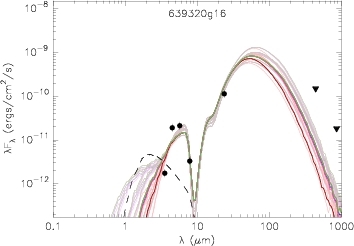
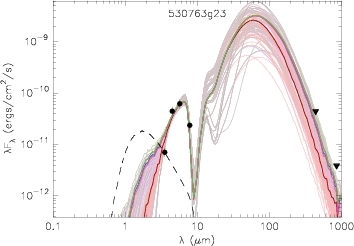
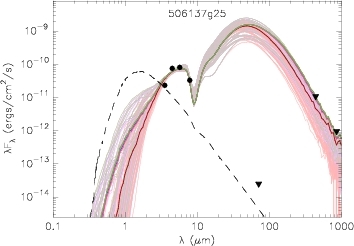
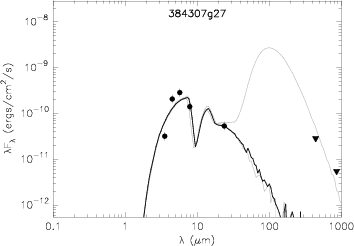
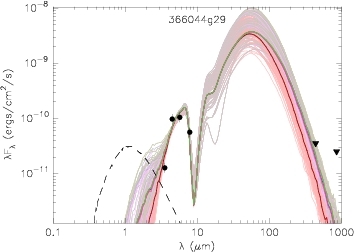
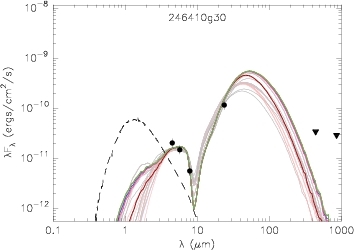
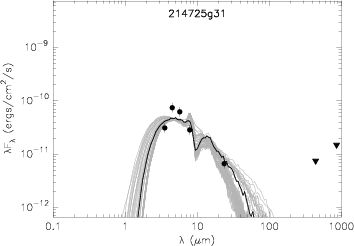
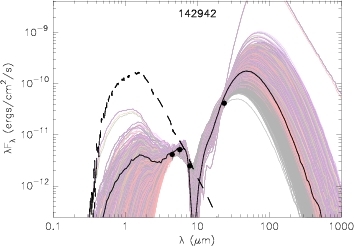
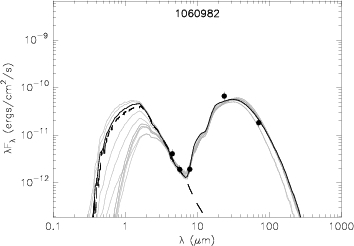
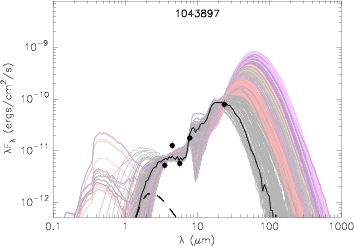
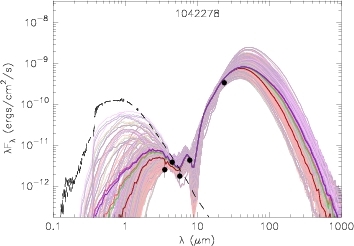
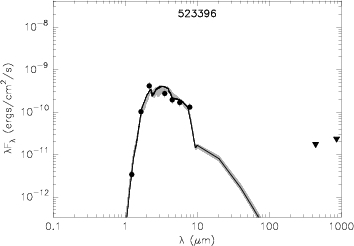
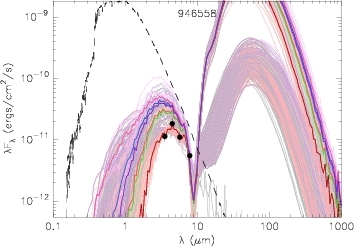
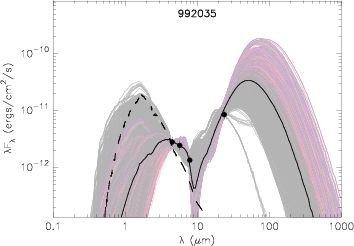
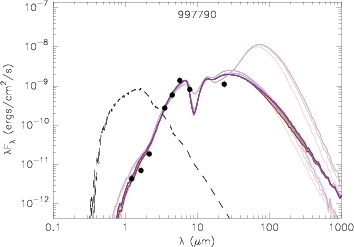
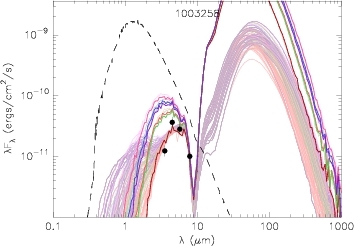
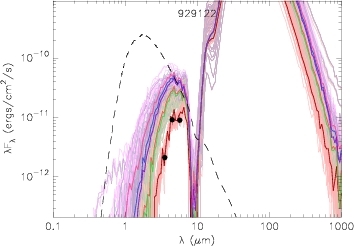
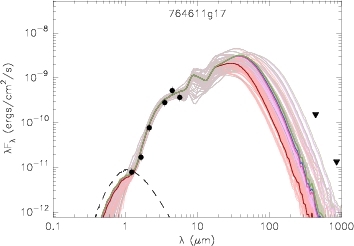
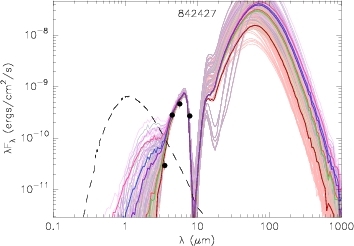
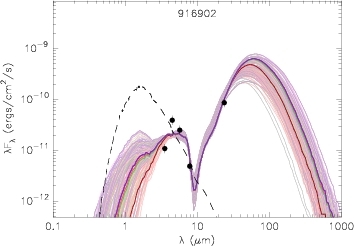
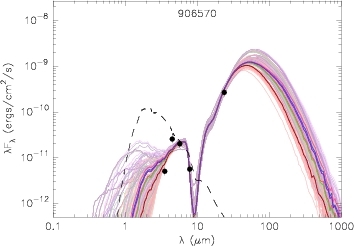
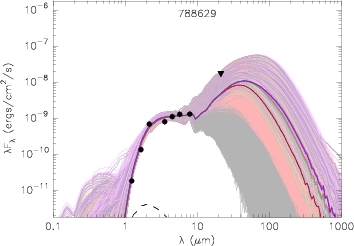
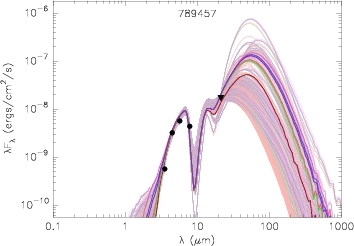
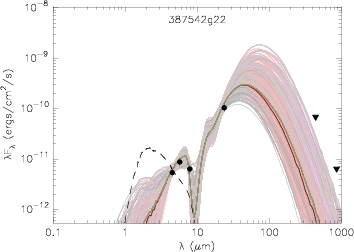
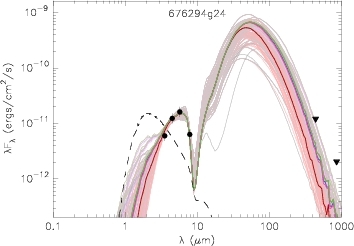
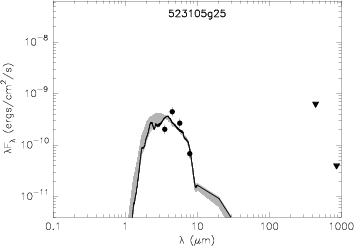
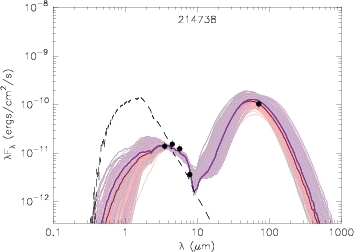
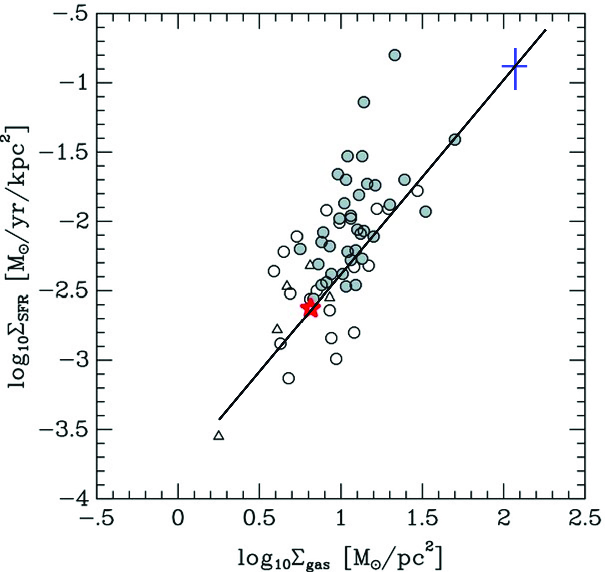
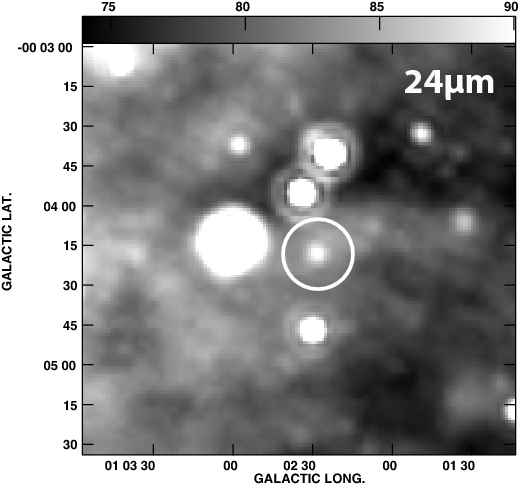


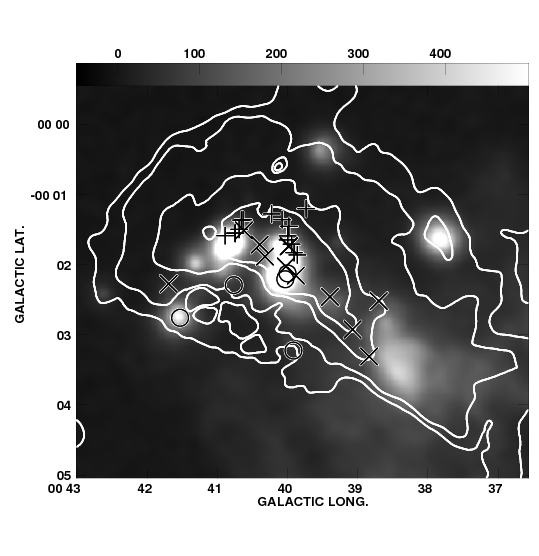

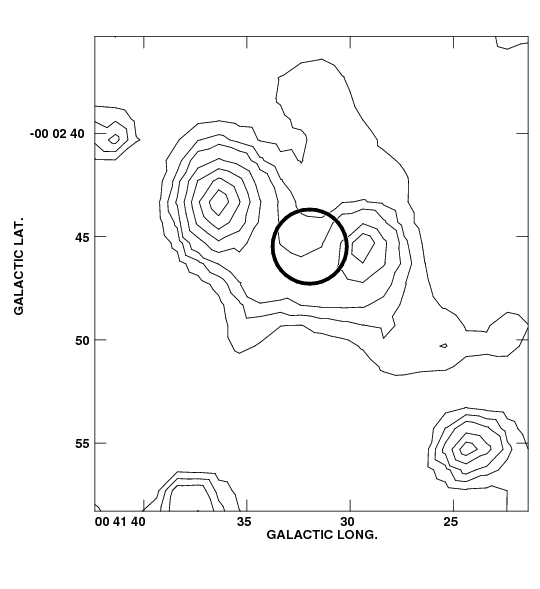


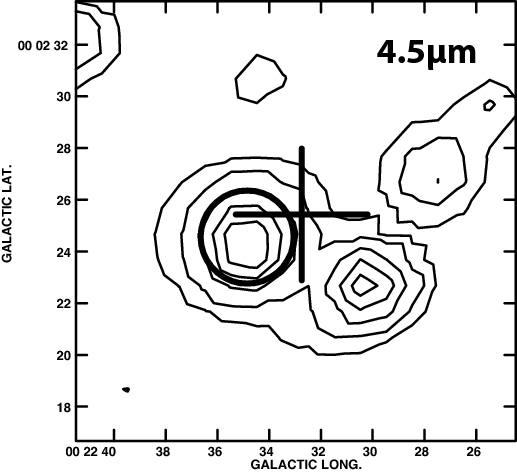


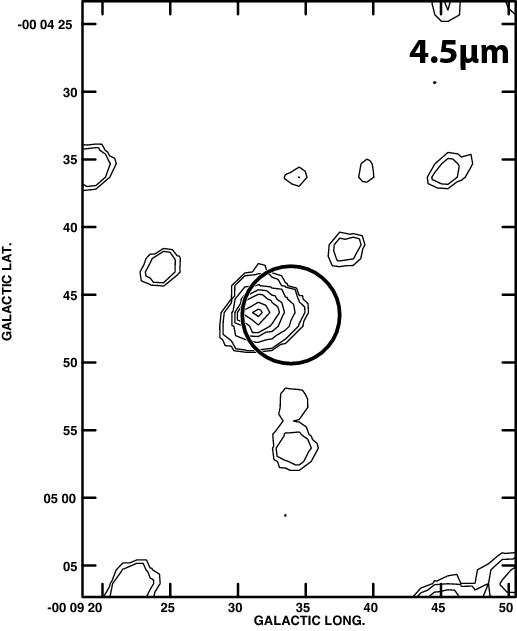
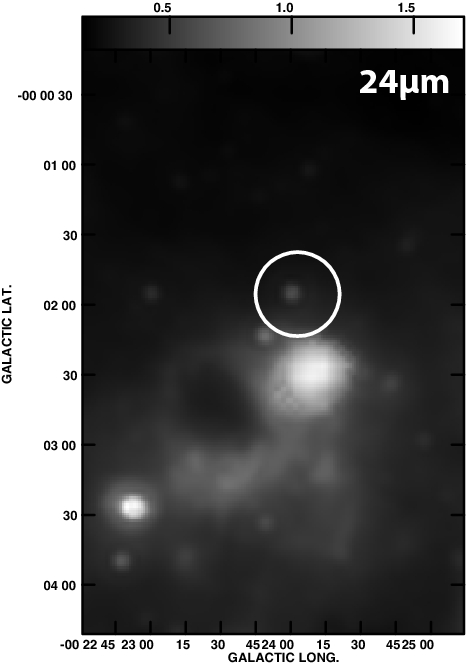
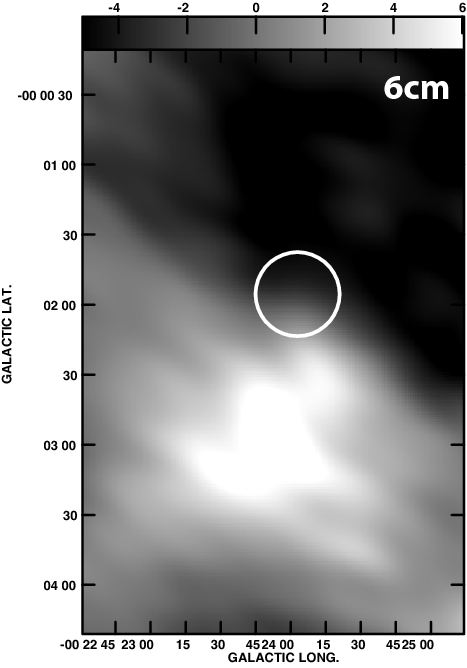

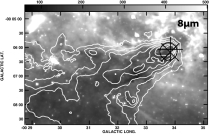
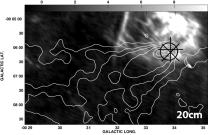
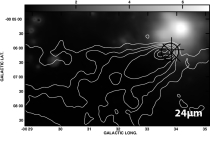
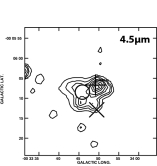
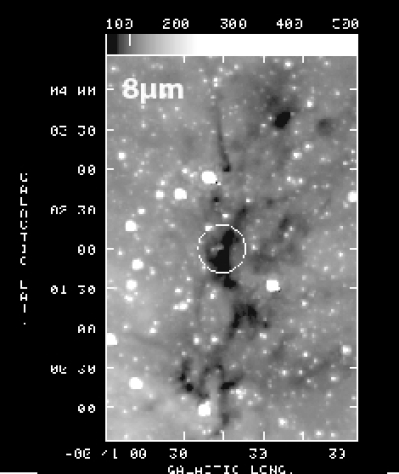
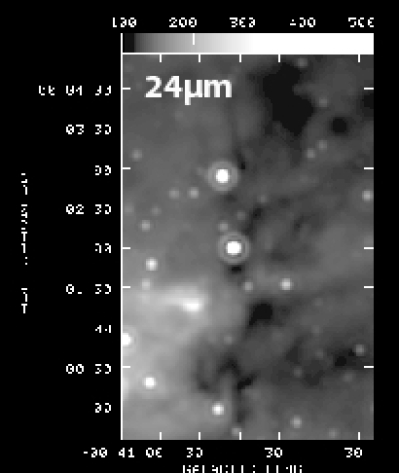
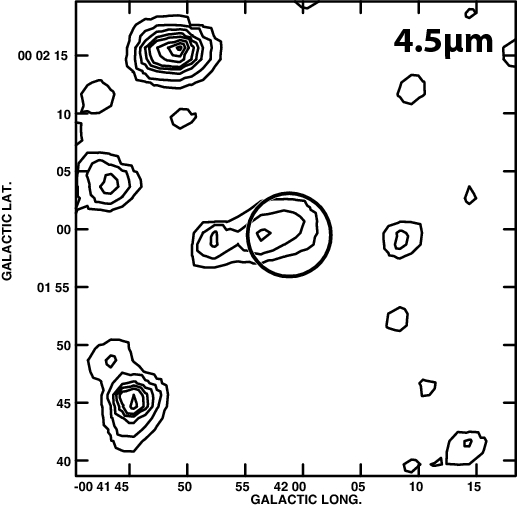
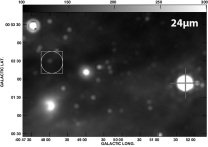
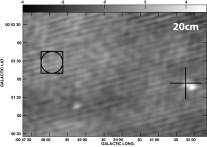
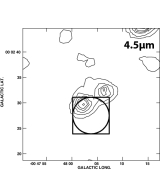
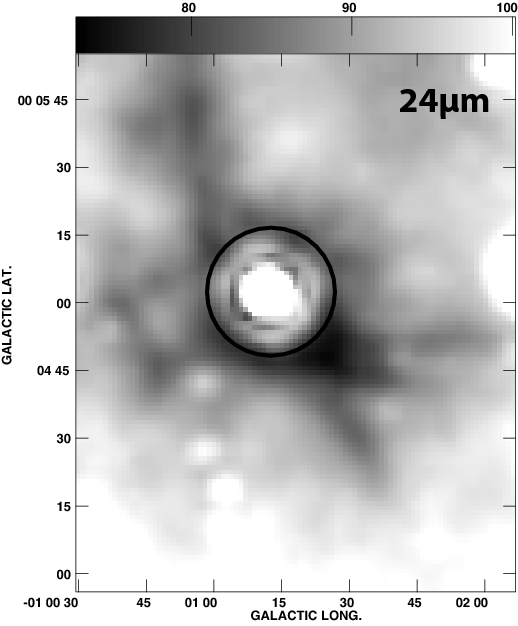
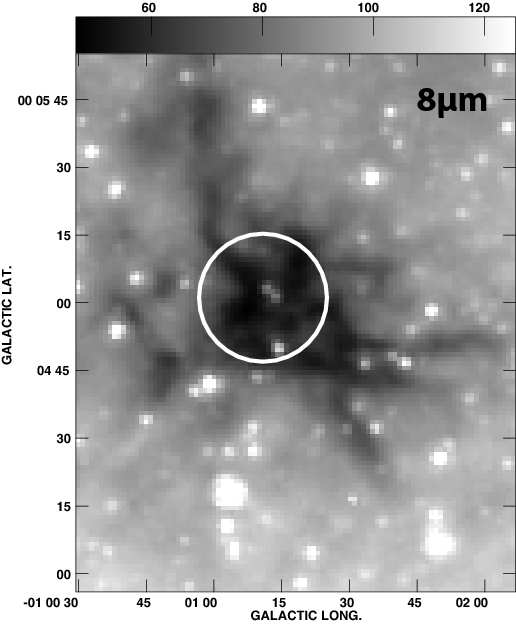
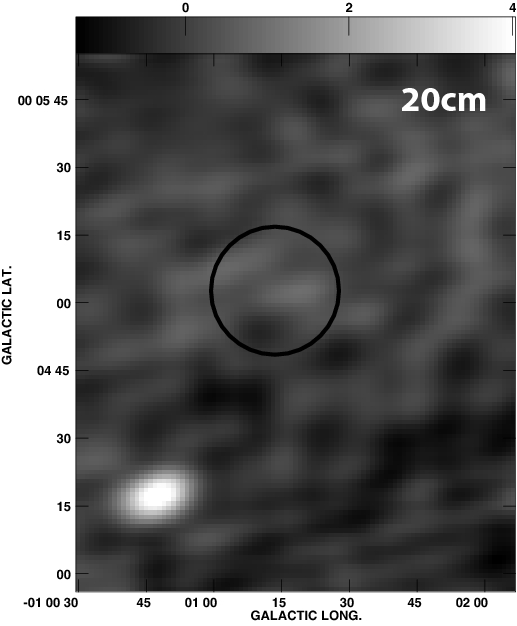
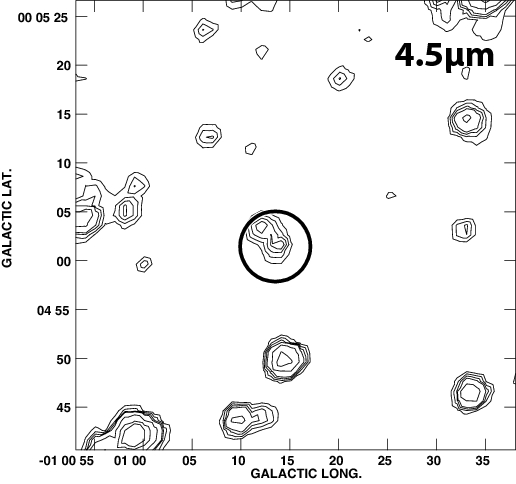
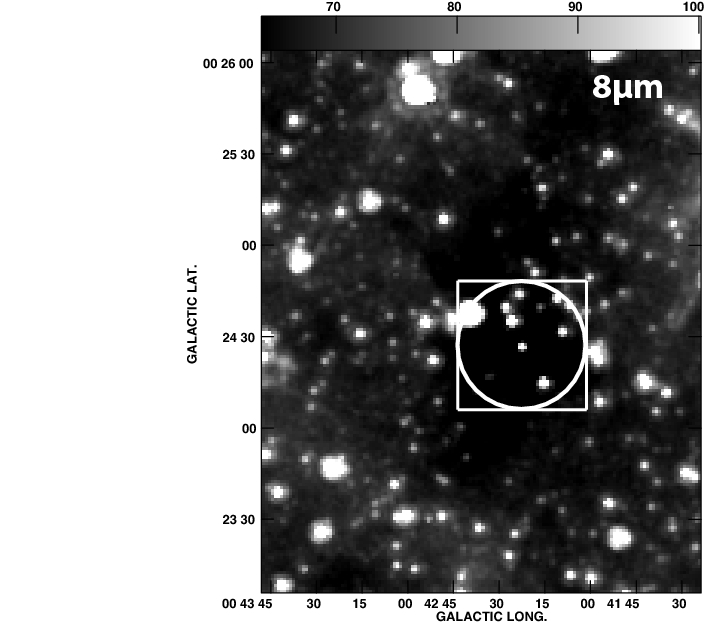
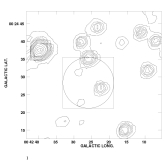
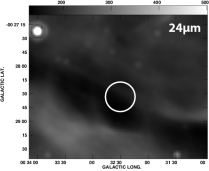
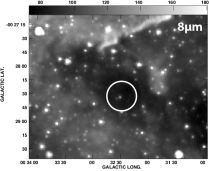
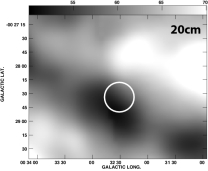
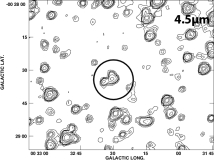
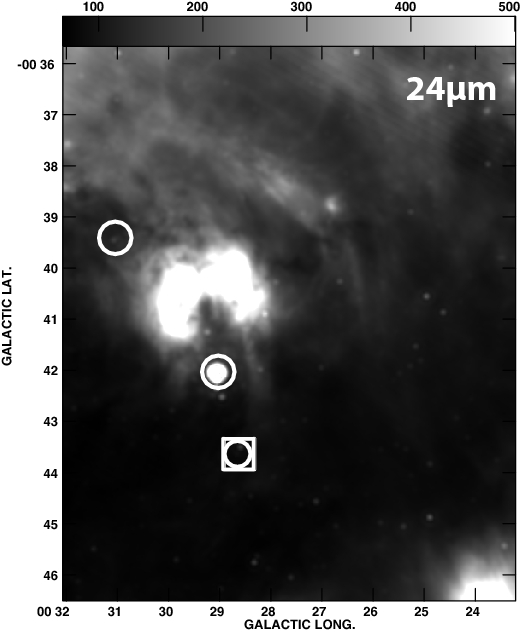
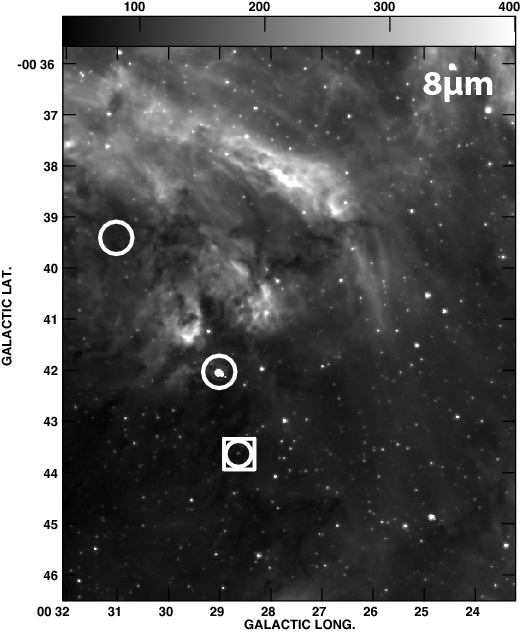
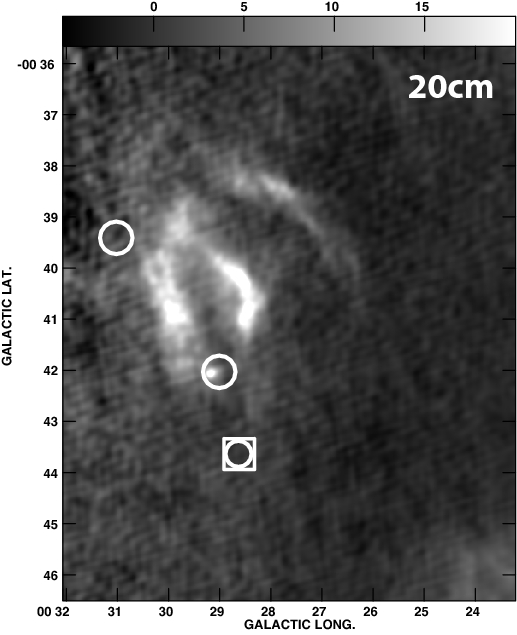
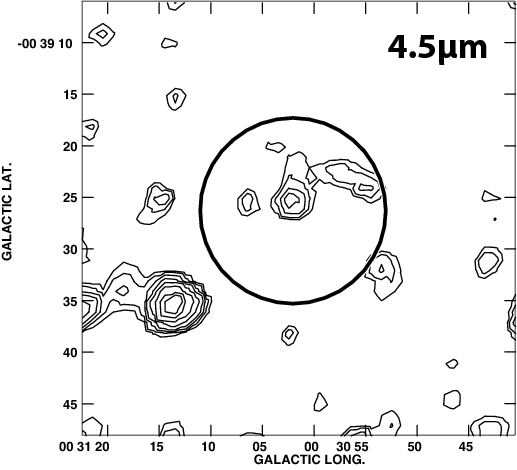
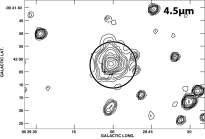
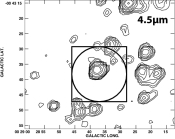
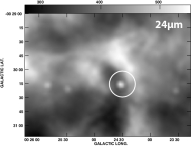
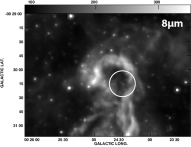
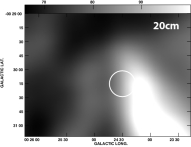
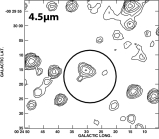
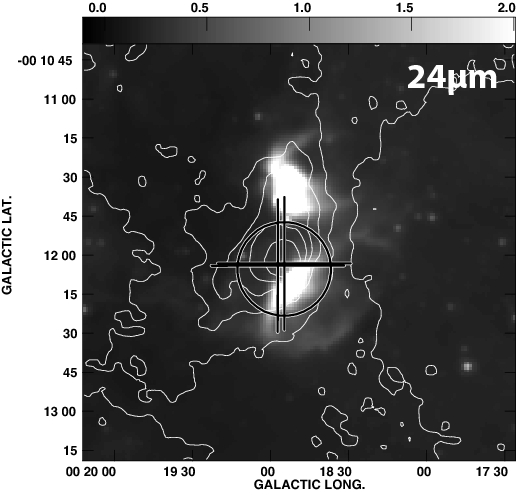
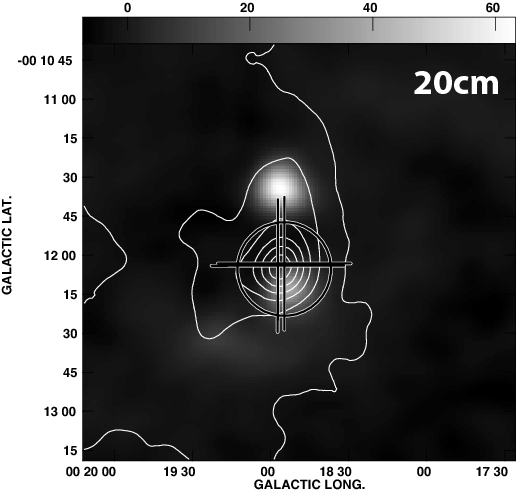
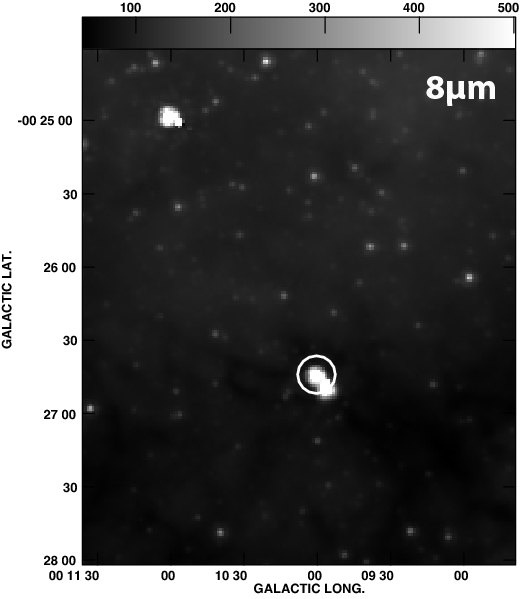
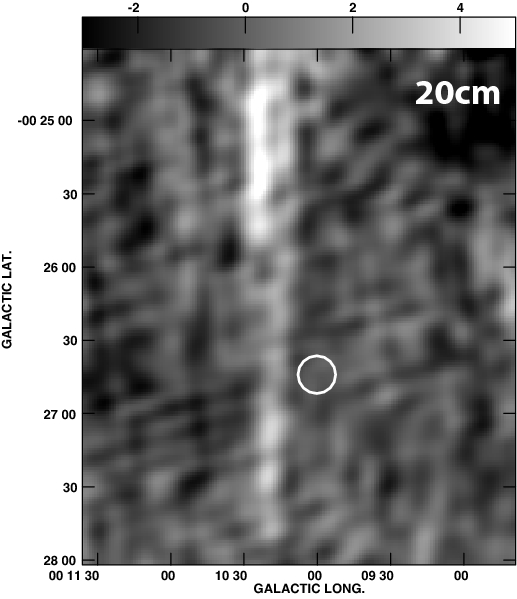
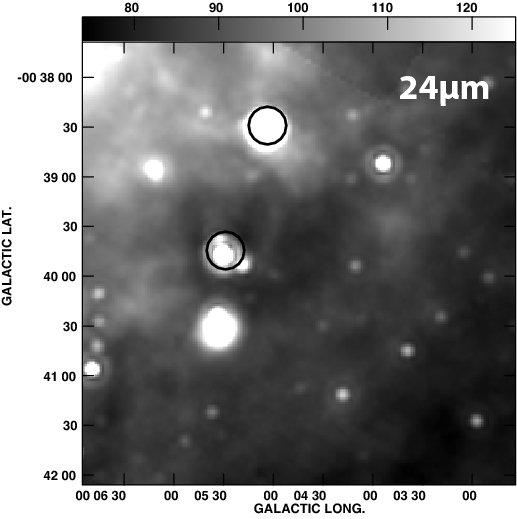
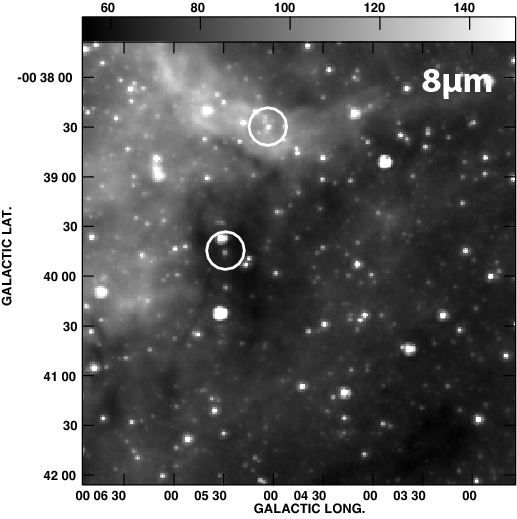
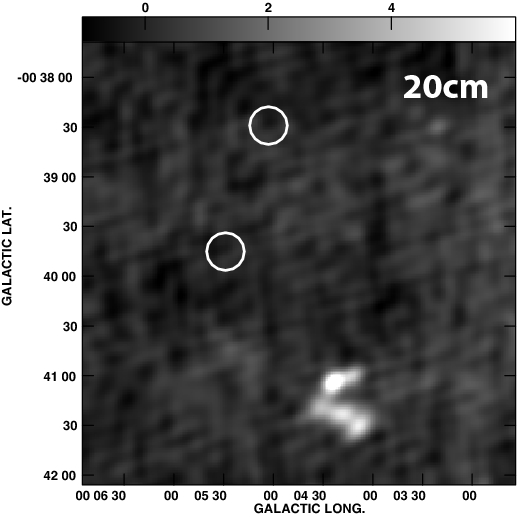
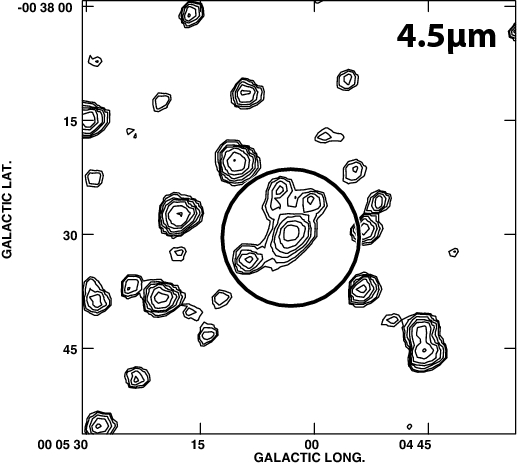
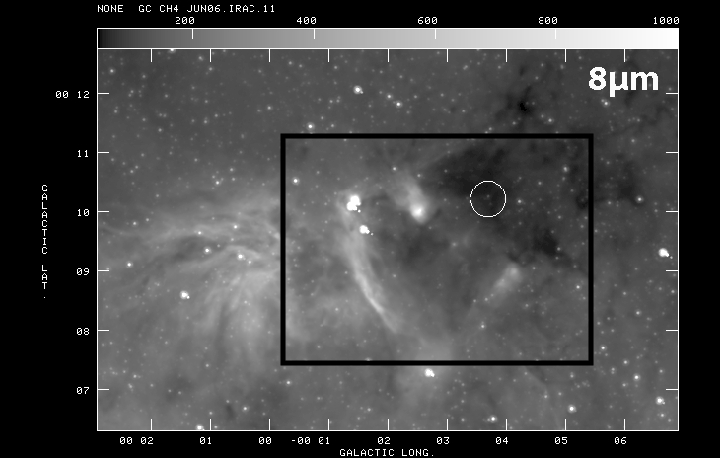
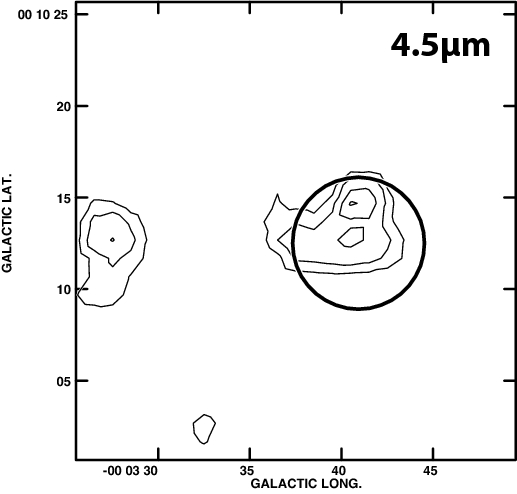
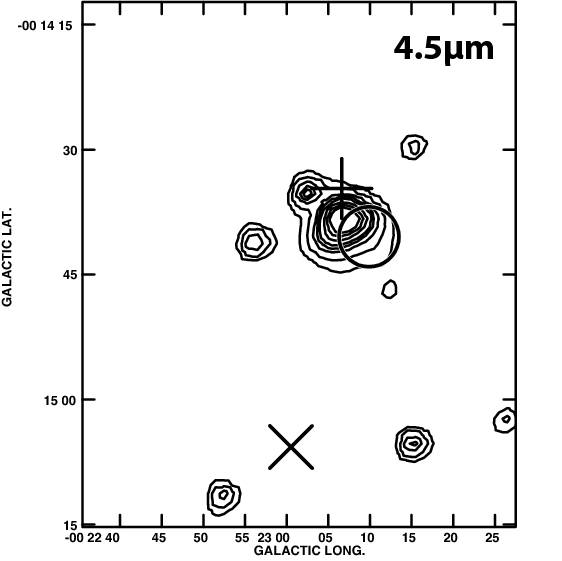
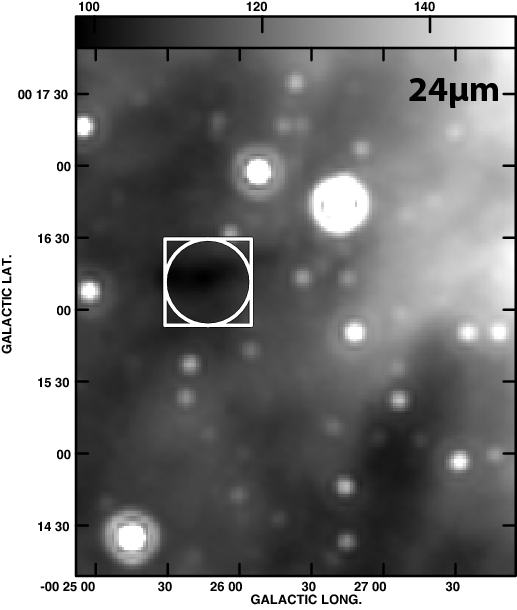
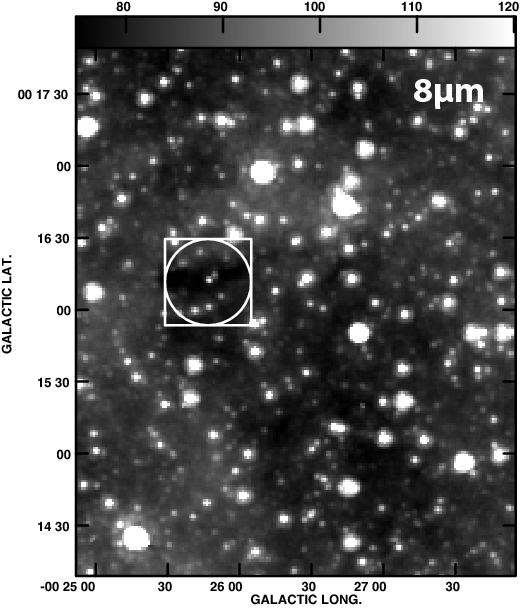
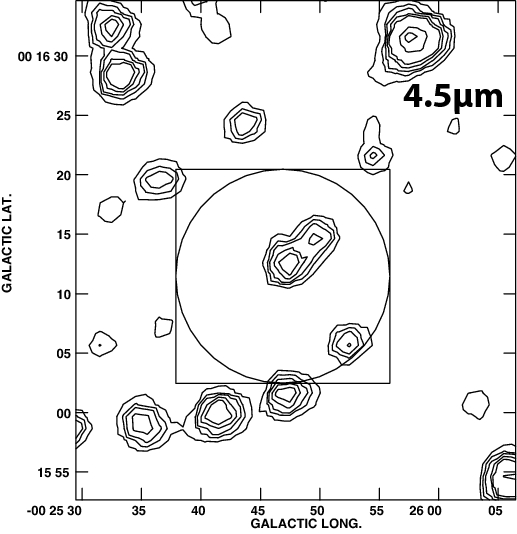
| # | GLON | GLAT | S | S | |||
|---|---|---|---|---|---|---|---|
| 1 | 359.522356 | 0.012511 | 6.51.6 | 4.1 | 8.8 | 2.0 | |
| 2 | 359.495378 | 0.038569 | 5.2 | 12.9 | 10.2 | ||
| 3 | 359.485425 | 0.083103 | 6.5 | 3.0 | 7.9 | 3.8 | |
| 4 | 359.472092 | 0.052111 | 5.7 | 5.3 | 6.9 | 0.4 | |
| 5bbInfrared counterpart 300758 | 359.456575 | 0.019586 | 3.6 | 2.8 | 4.2 | — | |
| 6aaInfrared counterpart 284291 | 359.429236 | 0.035489 | 3.4 | 4.4 | 5.8 | — | |
| 7 | 359.434825 | 0.022075 | 12.6 | — | 19 | 11 | |
| 8 | 359.432242 | 0.022986 | 14.4 | — | 21.3 | 11.1 | |
| 9 | 359.423431 | 0.015069 | 6.9 | 4.8 | 11 | 7 | |
| 10 | 359.439063 | 0.005402 | 76.0 | 96 | 900′′2 | ||
| 11ccfootnotemark: | 359.413464 | 0.032297 | 1.4 | 1.3 | 11.1 | — | |
| 11eccfootnotemark: | 49 | 40.3 | 1472′′2 | ||||
| 12 | 359.403742 | 0.000797 | 13.8 | 6.0 | 13.4 | 11.6 | |
| 13 | 359.404019 | -0.000811 | 9.5 | 9.7 | 11.4 | 9.6 | |
| 14 | 359.419481 | 0.001042 | |||||
| 15 | 359.390961 | 0.035469 | 4.3 | 9.5 | 8.4 | 5.9 | |
| 16 | 359.373078 | 0.017686 | — | 9.0 | 8.2 | ||
| 17 | 359.363663 | -0.000190 | 25 | 30.8 |
source 11 has a central compact source and an extended component
| SST GC # | nfits | Stage | |||||||
|---|---|---|---|---|---|---|---|---|---|
| 251914 | 359.4130 | 0.09095 | 0.03 | 310 | 32.1 | 8.01.3 | 1.41.2E+03 | 2.7 4.3E-04 | I |
| 255492 | 359.4145 | 0.08451 | 0.00 | 736 | 31.6 | 5.01.6 | 6.57.8E+02 | 1.1 3.5E-04 | I |
| 272626 | 359.4288 | 0.05876 | 4.57 | 240 | 18.8 | 10.10.7 | 6.51.2E+03 | 0.00.0E+00 | II |
| 276597 | 359.4709 | 0.07663 | 5.97 | 52 | 15.0 | 7.50.5 | 2.30.7E+03 | 0.00.0E+00 | III |
| 284291 aaRadio counterpart 6 | 359.4287 | 0.03534 | 0.07 | 204 | 37.6 | 9.51.0 | 5.21.9E+03 | 0.83.8E-04 | I |
| 297164 | 359.4352 | 0.01400 | 0.00 | 739 | 36.2 | 8.40.9 | 2.41.2E+03 | 1.33.5E-04 | I |
| 297494 | 359.4688 | 0.03400 | 0.00 | 703 | 34.9 | 7.50.9 | 1.71.0E+03 | 1.74.6E-04 | I |
| 300758 bbRadio counterpart 5 | 359.4562 | 0.01993 | 1.66 | 59 | 17.6 | 8.81.1 | 3.31.6E+03 | 5.15.2E-05 | I |
| 305505 | 359.4583 | 0.01236 | 0.00 | 837 | 38.0 | 10.11.4 | 5.72.2E+03 | 2.25.1E-04 | I |
| 307175 | 359.4427 | 0.02637 | 0.00 | 443 | 36.1 | 6.91.0 | 1.20.9E+03 | 2.25.5E-04 | I |
| 307819 | 359.4249 | 0.01234 | 4.18 | 20 | 15.0 | 6.20.6 | 1.10.1E+03 | 1.04.7E-04 | I |
| 311793 | 359.4072 | 0.03009 | 0.00 | 453 | 40.8 | 8.30.8 | 2.81.2E+03 | 1.03.4E-04 | I |
| 313278 | 359.4882 | 0.01704 | 1.28 | 18 | 16.8 | 6.30.7 | 2.90.8E+02 | 1.82.3E-04 | I |
| 317711 | 359.4334 | 0.02412 | 0.08 | 450 | 24.7 | 6.50.8 | 8.85.9E+02 | 1.02.9E-04 | I |
| 320517 | 359.4441 | 0.02219 | 0.00 | 784 | 39.2 | 9.61.1 | 5.11.8E+03 | 1.46.3E-04 | I |
| 323541 | 359.5125 | 0.01483 | 5.03 | 55 | 16.6 | 7.01.0 | 2.00.8E+03 | 0.00.0E+00 | II |
| 335380 | 359.4371 | 0.05085 | 0.00 | 346 | 30.2 | 9.52.4 | 5.84.6E+03 | 2.39.5E-04 | I |
| 336047 | 359.4591 | 0.03848 | 7.85 | 6 | 17.0 | 11.70.8 | 1.00.2E+04 | 0.00.0E+00 | II |
| SST GC # | nfits | Stage | |||||||
|---|---|---|---|---|---|---|---|---|---|
| 116907 | 358.7362 | 0.0045 | 0.80 | 13 | 16.3 | 7.70.5 | 1.20.3E+03 | 7.09.5E-04 | I |
| 119577 | 358.8940 | 0.0943 | 18.80 | 3 | 15.0 | 7.00.0 | 4.70.1E+02 | 2.63.5E-04 | I |
| 119780 | 358.8605 | 0.0729 | 0.07 | 471 | 29.7 | 4.70.8 | 4.23.3E+02 | 0.21.8E-04 | I |
| 121566 | 358.8108 | 0.0369 | 5.64 | 10 | 15.5 | 6.90.0 | 1.50.0E+03 | 0.00.0E-00 | III |
| 122375 | 358.7448 | -0.0062 | 0.00 | 1072 | 28.1 | 4.11.6 | 2.52.7E+02 | 0.71.7E-04 | I |
| 126327 | 358.8288 | 0.0347 | 7.12 | 6 | 15.0 | 7.00.1 | 4.90.4E+02 | 3.13.3E-04 | I |
| 127127 | 358.7587 | -0.0108 | 0.00 | 485 | 34.7 | 5.11.5 | 0.81.0E+03 | 0.32.8E-09 | II |
| 127297 | 358.7373 | -0.0245 | 0.00 | 1537 | 38.9 | 8.91.0 | 3.41.4E+03 | 1.13.0E-04 | I |
| 131902 | 358.9174 | 0.0747 | 17.20 | 12 | 15.0 | 9.50.4 | 5.30.8E+03 | 0.00.0E-00 | III |
| 132101 | 358.9409 | 0.0887 | 0.23 | 71 | 39.4 | 12.63.1 | 1.00.5E+04 | 0.91.7E-03 | I |
| 134327 | 358.9658 | 0.0982 | 0.07 | 84 | 15.7 | 5.00.5 | 3.50.9E+02 | 1.24.2E-05 | I |
| 136092 | 358.9102 | 0.0592 | 0.22 | 126 | 18.1 | 8.51.2 | 4.01.8E+03 | 3.29.4E-05 | I |
| 136259 | 358.8728 | 0.0356 | 1.05 | 84 | 15.9 | 7.11.0 | 1.61.3E+03 | 1.24.1E-04 | I |
| 137737 | 358.8181 | -0.0020 | 11.70 | 5 | 15.0 | 6.50.2 | 2.90.4E+02 | 1.30.5E-04 | I |
| 142082 | 358.8714 | 0.0194 | 7.02 | 4 | 15.0 | 6.80.1 | 3.60.4E+02 | 2.33.0E-04 | I |
| 142930 | 358.8283 | -0.0094 | 5.72 | 5 | 15.0 | 6.60.0 | 4.60.0E+02 | 1.70.0E-00 | I |
| 142942 | 358.9795 | 0.0840 | 0.11 | 58 | 21.9 | 7.60.6 | 7.33.4E+02 | 2.52.7E-04 | I |
| 146060 | 358.8148 | -0.0260 | 0.00 | 646 | 37.5 | 5.41.9 | 1.01.4E+03 | 5.22.3E-04 | I |
| 147176 | 358.7761 | -0.0527 | 10.72 | 2 | 15.0 | 6.30.0 | 2.50.0E+02 | 1.80.0E-04 | I |
| 147584 | 358.8293 | -0.0210 | 0.00 | 790 | 28.9 | 7.41.5 | 2.21.5E+03 | 0.62.4E-04 | I |
| 147743 | 358.7765 | -0.0540 | 12.29 | 2 | 15.0 | 6.30.0 | 2.50.0E+02 | 1.80.0E-04 | I |
| 150660 | 358.8131 | -0.0391 | 1.65 | 18 | 15.5 | 5.60.2 | 2.10.3E+02 | 1.11.0E-05 | I |
| 153970 | 358.8569 | -0.0206 | 5.57 | 27 | 15.0 | 8.30.7 | 3.31.0E+03 | 0.00.0E-00 | III |
| 158032 | 358.8088 | -0.0607 | 4.76 | 50 | 15.0 | 4.40.3 | 3.20.9E+02 | 0.00.0E-00 | II |
| 158837 | 358.8657 | -0.0277 | 0.38 | 174 | 17.0 | 4.20.4 | 2.70.9E+02 | 0.33.4E-08 | II |
| 161727 | 358.9833 | 0.0373 | 0.00 | 415 | 37.9 | 9.01.3 | 3.51.8E+03 | 2.68.1E-04 | I |
| 165041 | 358.9781 | 0.0254 | 15.11 | 3 | 15.0 | 6.70.2 | 4.54.0E+02 | 2.63.5E-04 | I |
| 166903 | 358.8068 | -0.0850 | 0.00 | 683 | 34.7 | 6.51.8 | 1.82.1E+03 | 0.73.5E-04 | I |
| 168737 | 359.0166 | 0.0399 | 6.03 | 507 | 15.0 | 9.70.5 | 5.71.0E+03 | 0.00.0E-00 | III |
| 170621 | 358.7689 | -0.1181 | 5.02 | 3 | 15.0 | 5.50.0 | 1.50.0E+02 | 7.10.0E-05 | I |
| 173766 | 358.9977 | 0.0149 | 2.62 | 101 | 15.5 | 3.70.9 | 7.32.2E+01 | 0.71.0E-04 | I |
| 175663 | 359.2416 | 0.1607 | 8.10 | 19 | 17.1 | 7.00.7 | 7.02.3E+02 | 1.22.0E-04 | I |
| 179253 | 359.2140 | 0.1343 | 1.73 | 55 | 15.5 | 5.30.5 | 6.72.4E+02 | 0.00.0E-00 | II |
| 180155 | 358.8542 | -0.0901 | 0.00 | 727 | 27.2 | 4.10.7 | 2.31.6E+02 | 0.74.1E-05 | I |
| 187849 | 358.8233 | -0.1286 | 6.13 | 10 | 15.0 | 5.70.4 | 1.80.4E+02 | 2.72.6E-04 | I |
| 188031 | 358.9874 | -0.0278 | 7.34 | 5 | 15.0 | 8.20.2 | 9.91.9E+02 | 5.98.9E-04 | I |
| 188899 | 358.8238 | -0.1308 | 8.31 | 3 | 15.0 | 5.50.0 | 1.50.0E+02 | 7.10.0E-05 | I |
| 189586 | 359.1190 | 0.0497 | 0.00 | 303 | 28.6 | 4.51.7 | 5.16.8E+02 | 1.43.1E-04 | I |
| 193986 | 359.0376 | -0.0106 | 8.56 | 28 | 15.0 | 9.40.6 | 5.11.0E+03 | 0.00.0E-00 | II |
| 194367 | 358.8665 | -0.1171 | 0.00 | 106 | 36.1 | 7.63.3 | 2.97.2E+03 | 4.09.9E-04 | I |
| 194640 | 358.9834 | -0.0455 | 3.29 | 6 | 15.0 | 6.90.1 | 4.80.2E+02 | 3.53.0E-04 | I |
| 198456 | 359.0938 | 0.0138 | 6.56 | 88 | 16.0 | 5.80.7 | 9.13.7E+02 | 0.00.0E-00 | II |
| 201854 | 359.2106 | 0.0782 | 5.57 | 46 | 15.0 | 4.20.4 | 2.50.8E+02 | 2.09.5E-06 | II |
| 202699 | 359.1513 | 0.0397 | 8.60 | 189 | 15.0 | 9.30.6 | 5.11.2E+03 | 0.00.0E-00 | III |
| 204187 | 358.9588 | -0.0824 | 8.50 | 1 | 15.0 | 6.70.0 | 3.20.0E+02 | 4.80.0E-05 | I |
| 204714 | 359.0956 | 0.0007 | 2.13 | 51 | 15.0 | 4.60.7 | 4.03.4E+02 | 0.21.3E-05 | II |
| 206043 | 359.3542 | 0.1572 | 3.38 | 31 | 15.0 | 6.20.5 | 1.00.3E+03 | 0.00.0E-00 | III |
| 207736 | 358.9448 | -0.0992 | 2.03 | 14 | 15.2 | 6.60.4 | 3.40.7E+02 | 2.32.0E-04 | I |
| 208385 | 359.3569 | 0.1534 | 4.00 | 17 | 15.0 | 4.60.4 | 1.70.3E+02 | 1.32.1E-05 | I |
| 212351 | 359.1824 | 0.0368 | 1.48 | 2 | 15.3 | 6.70.0 | 3.20.0E+02 | 4.80.0E-05 | I |
| 212533 | 358.8852 | -0.1468 | 21.18 | 4 | 15.0 | 6.90.1 | 3.90.5E+02 | 4.13.5E-04 | I |
| 214283 | 359.0873 | -0.0262 | 0.15 | 407 | 19.2 | 5.00.9 | 5.69.2E+02 | 0.56.5E-05 | I |
| 214291 | 358.9865 | -0.0883 | 5.69 | 36 | 15.0 | 6.50.2 | 1.20.1E+03 | 0.00.0E-00 | III |
| 214384 | 359.0151 | -0.0708 | 1.51 | 4 | 15.0 | 6.60.0 | 4.60.0E+02 | 1.70.0E-05 | I |
| 215021 | 359.0938 | -0.0238 | 7.90 | 73 | 15.0 | 6.50.2 | 1.20.1E+03 | 0.00.0E-00 | III |
| 215431 | 359.1431 | 0.0056 | 6.00 | 3 | 15.0 | 5.50.0 | 1.50.0E+02 | 7.10.0E-05 | I |
| 216691 | 359.3706 | 0.1428 | 2.42 | 99 | 21.3 | 7.91.4 | 3.12.5E+03 | 0.00.0E-00 | II |
| 219986 | 359.1208 | -0.0185 | 0.01 | 471 | 36.0 | 7.71.1 | 1.20.7E+03 | 2.34.7E-04 | I |
| 223624 | 359.0653 | -0.0610 | 9.33 | 56 | 15.4 | 9.40.8 | 5.21.3E+03 | 0.00.0E-00 | II |
| 224770 | 359.4100 | 0.1489 | 0.54 | 219 | 16.2 | 6.60.8 | 1.40.5E+03 | 0.00.0E-00 | II |
| 225677 | 359.1460 | -0.0158 | 5.60 | 4 | 15.0 | 6.40.0 | 4.10.0E+02 | 7.00.0E-05 | I |
| 229216 | 359.0992 | -0.0525 | 0.98 | 91 | 15.1 | 4.60.5 | 2.41.0E+02 | 2.59.5E-05 | I |
| 231270 | 359.3173 | 0.0771 | 0.00 | 637 | 29.8 | 7.31.6 | 2.21.9E+03 | 1.35.7E-04 | I |
| 235473 | 359.4716 | 0.1627 | 0.01 | 683 | 28.7 | 5.91.2 | 1.10.9E+03 | 0.11.5E-04 | I |
| 235995 | 359.0383 | -0.1052 | 9.89 | 183 | 15.0 | 10.60.1 | 7.50.3E+03 | 0.00.0E-00 | III |
| 237228 | 359.1848 | -0.0177 | 20.81 | 4 | 15.0 | 8.50.0 | 3.60.0E+03 | 0.00.0E-00 | II |
| 238167 | 359.4078 | 0.1174 | 2.40 | 78 | 15.3 | 7.90.7 | 2.91.1E+03 | 0.00.0E-00 | III |
| 241266 | 359.2441 | 0.0096 | 6.91 | 53 | 15.0 | 6.90.5 | 1.60.4E+03 | 0.00.0E-00 | III |
| 243433 | 359.4619 | 0.1388 | 6.30 | 65 | 15.0 | 5.00.3 | 4.91.2E+02 | 0.00.0E-00 | II |
| 243522 | 359.1801 | -0.0348 | 0.51 | 20 | 15.1 | 5.90.4 | 4.42.0E+02 | 3.76.9E-05 | I |
| 246410 | 359.3009 | 0.0334 | 2.57 | 15 | 18.1 | 8.80.8 | 1.80.4E+03 | 2.01.7E-04 | I |
| 251494 | 359.1027 | -0.0992 | 6.36 | 10 | 15.0 | 7.10.2 | 1.80.2E+03 | 0.00.0E-00 | II |
| 251914 | 359.4130 | 0.0909 | 0.03 | 310 | 32.1 | 8.01.3 | 1.41.2E+03 | 2.74.3E-04 | I |
| 253913 | 359.5316 | 0.1597 | 15.95 | 2 | 15.0 | 5.50.0 | 1.50.0E+02 | 7.10.0E-05 | I |
| 254708 | 359.0599 | -0.1321 | 0.00 | 595 | 38.6 | 7.71.5 | 3.02.7E+03 | 0.11.2E-04 | I |
| 255492 | 359.4145 | 0.0845 | 0.00 | 736 | 31.6 | 5.01.6 | 6.57.8E+02 | 1.13.5E-04 | I |
| 258517 | 359.0967 | -0.1172 | 9.05 | 162 | 15.0 | 7.20.0 | 1.90.0E+03 | 0.00.0E-00 | III |
| 258882 | 359.2085 | -0.0492 | 4.98 | 23 | 15.0 | 7.40.6 | 2.10.8E+03 | 0.00.0E-00 | II |
| 262648 | 359.0669 | -0.1440 | 11.83 | 8 | 15.0 | 16.41.0 | 2.70.4E+04 | 0.00.0E-00 | II |
| 263857 | 359.2346 | -0.0431 | 0.09 | 406 | 38.9 | 8.90.9 | 4.11.5E+03 | 0.52.7E-04 | I |
| 264669 | 359.4653 | 0.0970 | 0.00 | 572 | 20.6 | 4.00.6 | 2.31.5E+02 | 0.23.6E-07 | II |
| 265278 | 359.3205 | 0.0067 | 0.14 | 104 | 16.6 | 4.90.6 | 2.20.8E+02 | 3.27.4E-05 | I |
| 268132 | 359.1003 | -0.1343 | 3.01 | 11 | 15.0 | 5.50.4 | 1.70.3E+02 | 4.33.9E-04 | I |
| 268877 | 359.2461 | -0.0461 | 0.03 | 171 | 36.5 | 9.70.9 | 5.81.8E+03 | 0.81.5E-05 | II |
| 272626 | 359.4288 | 0.0587 | 4.57 | 240 | 18.8 | 10.10.7 | 6.51.2E+03 | 0.00.0E-00 | II |
| 274996 | 359.2906 | -0.0309 | 1.38 | 4 | 28.0 | 6.80.7 | 8.01.1E+02 | 7.48.1E-04 | I |
| 275827 | 359.2791 | -0.0397 | 1.05 | 9 | 15.1 | 8.40.3 | 1.00.2E+03 | 4.87.0E-04 | I |
| 276597 | 359.4709 | 0.0766 | 5.97 | 52 | 15.0 | 7.50.5 | 2.30.7E+03 | 0.00.0E-00 | III |
| 277526 | 359.2104 | -0.0854 | 0.25 | 255 | 20.7 | 5.70.7 | 8.74.0E+02 | 1.59.9E-06 | II |
| 278053 | 359.1057 | -0.1508 | 2.38 | 20 | 45.1 | 9.94.5 | 6.48.6E+03 | 0.51.5E-03 | I |
| 279979 | 359.1129 | -0.1501 | 4.59 | 82 | 17.3 | 7.00.6 | 1.80.5E+03 | 0.00.0E-00 | II |
| 282944 | 359.2387 | -0.0788 | 5.65 | 28 | 15.0 | 4.30.5 | 1.90.7E+02 | 0.61.6E-05 | I |
| 283981 | 359.2434 | -0.0779 | 3.69 | 42 | 15.0 | 4.30.2 | 2.90.7E+02 | 0.00.0E-00 | II |
| 284291 | 359.4287 | 0.0353 | 0.07 | 204 | 37.6 | 9.51.0 | 5.21.9E+03 | 0.83.8E-04 | I |
| 286515 | 359.1828 | -0.1201 | 0.00 | 719 | 32.6 | 7.21.4 | 2.32.0E+03 | 0.11.0E-04 | I |
| 288646 | 359.2087 | -0.1085 | 4.65 | 15 | 15.0 | 9.62.4 | 6.44.1E+03 | 0.00.0E-00 | III |
| 293719 | 359.2453 | -0.0959 | 4.27 | 1261 | 15.0 | 6.60.0 | 1.30.0E+03 | 0.00.0E-00 | III |
| 295788 | 359.2963 | -0.0687 | 0.07 | 191 | 35.3 | 7.41.2 | 1.71.4E+03 | 2.24.4E-04 | I |
| 297164 | 359.4352 | 0.0140 | 0.00 | 739 | 36.2 | 8.40.9 | 2.41.2E+03 | 1.33.5E-04 | I |
| 297494 | 359.4688 | 0.0340 | 0.00 | 703 | 34.9 | 7.50.9 | 1.71.0E+03 | 1.74.6E-04 | I |
| 300758 | 359.4562 | 0.0199 | 1.66 | 59 | 17.6 | 8.81.1 | 3.31.6E+03 | 5.15.2E-05 | I |
| 302651 | 359.3136 | -0.0712 | 0.22 | 318 | 19.6 | 6.60.6 | 1.40.3E+03 | 0.32.4E-04 | I |
| 302664 | 359.2228 | -0.1270 | 6.28 | 15 | 15.2 | 6.30.7 | 1.20.4E+03 | 0.00.0E-00 | III |
| 305505 | 359.4583 | 0.0123 | 0.00 | 837 | 38.0 | 10.11.4 | 5.72.2E+03 | 2.25.1E-04 | I |
| 306363 | 359.5484 | 0.0661 | 0.01 | 441 | 35.1 | 5.71.8 | 1.21.9E+03 | 0.56.7E-05 | I |
| 307175 | 359.4427 | -0.0002 | 0.00 | 443 | 36.1 | 6.91.0 | 1.20.9E+03 | 2.25.5E-04 | I |
| 307819 | 359.4249 | -0.0123 | 4.18 | 20 | 15.0 | 6.20.6 | 1.10.1E+03 | 1.04.7E-04 | I |
| 311087 | 359.7029 | 0.1526 | 9.19 | 141 | 15.0 | 6.40.3 | 1.20.2E+03 | 0.00.0E-00 | III |
| 311793 | 359.4072 | -0.0300 | 0.00 | 453 | 40.8 | 8.30.8 | 2.81.2E+03 | 1.03.4E-04 | I |
| 313278 | 359.4882 | 0.0170 | 1.28 | 18 | 16.8 | 6.30.7 | 2.90.8E+02 | 1.82.3E-04 | I |
| 314042 | 359.2046 | -0.1584 | 4.66 | 106 | 15.2 | 4.70.5 | 4.11.7E+02 | 0.00.0E-00 | II |
| 317583 | 359.2173 | -0.1565 | 0.00 | 830 | 30.3 | 4.01.5 | 1.91.6E+02 | 0.41.3E-04 | I |
| 317711 | 359.4334 | -0.0241 | 0.08 | 450 | 24.7 | 6.50.8 | 8.85.9E+02 | 1.02.9E-04 | I |
| 320517 | 359.4441 | -0.0221 | 0.00 | 784 | 39.2 | 9.61.1 | 5.11.8E+03 | 1.46.3E-04 | I |
| 320729 | 359.3078 | -0.1062 | 7.32 | 14 | 15.0 | 7.10.2 | 1.80.2E+03 | 0.51.0E-06 | II |
| 321628 | 359.3311 | -0.0934 | 0.33 | 78 | 28.1 | 2.92.4 | 2.33.3E+02 | 1.43.6E-04 | I |
| 323541 | 359.5125 | 0.0148 | 5.03 | 55 | 16.6 | 7.01.0 | 2.00.8E+03 | 0.00.0E-00 | II |
| 328013 | 359.4058 | -0.0580 | 0.00 | 823 | 32.0 | 7.71.6 | 3.02.8E+03 | 0.11.7E-04 | I |
| 329968 | 359.4136 | -0.0565 | 5.05 | 73 | 17.7 | 8.91.0 | 4.41.9E+03 | 0.00.0E-00 | II |
| 330325 | 359.3839 | -0.0752 | 0.01 | 279 | 37.5 | 8.40.9 | 2.31.1E+03 | 2.35.8E-04 | I |
| 331261 | 359.2778 | -0.1419 | 6.14 | 48 | 15.3 | 6.00.6 | 1.00.3E+03 | 0.00.0E-00 | II |
| 331513 | 359.5929 | 0.0510 | 45.54 | 2 | 15.0 | 7.10.0 | 4.50.0E+02 | 7.60.0E-04 | I |
| 335380 | 359.4371 | -0.0508 | 0.00 | 346 | 30.2 | 9.52.4 | 5.84.6E+03 | 2.39.5E-04 | I |
| 336047 | 359.4591 | -0.0384 | 7.85 | 6 | 17.0 | 11.60.8 | 1.00.2E+04 | 0.00.0E-00 | II |
| 343554 | 359.4277 | -0.0701 | 0.24 | 160 | 35.3 | 7.41.8 | 2.63.0E+03 | 1.55.3E-04 | I |
| 344255 | 359.3227 | -0.1357 | 3.44 | 7 | 15.5 | 5.20.5 | 6.02.2E+02 | 0.00.0E-00 | II |
| 344820 | 359.3390 | -0.1266 | 11.32 | 2 | 15.0 | 6.30.0 | 2.50.0E+02 | 1.80.0E-04 | I |
| 345503 | 359.5740 | 0.0164 | 1.96 | 140 | 17.7 | 6.60.7 | 1.50.5E+03 | 0.00.0E-00 | II |
| 346221 | 359.2843 | -0.1625 | 0.53 | 3 | 24.3 | 5.60.6 | 6.73.2E+02 | 6.56.1E-04 | I |
| 348310 | 359.5823 | 0.0168 | 1.54 | 64 | 16.1 | 5.00.5 | 5.32.0E+02 | 0.00.0E-00 | II |
| 349188 | 359.5809 | 0.0144 | 0.13 | 195 | 16.5 | 5.60.6 | 7.92.9E+02 | 0.00.0E-00 | II |
| 351441 | 359.4553 | -0.0662 | 0.03 | 694 | 39.2 | 8.70.9 | 3.41.4E+03 | 1.24.8E-04 | I |
| 358063 | 359.5668 | -0.0086 | 2.02 | 33 | 15.1 | 9.51.4 | 5.72.6E+03 | 0.00.0E-00 | II |
| 359581 | 359.6667 | 0.0501 | 3.94 | 19 | 15.0 | 7.10.3 | 1.80.3E+03 | 0.00.0E-00 | II |
| 359649 | 359.6652 | 0.0491 | 4.13 | 14 | 15.0 | 6.50.5 | 1.10.6E+03 | 1.52.9E-05 | I |
| 360104 | 359.4031 | -0.1123 | 1.09 | 35 | 15.3 | 6.60.3 | 4.11.1E+02 | 2.23.0E-04 | I |
| 360444 | 359.6817 | 0.0578 | 12.18 | 4 | 15.0 | 6.90.1 | 3.90.5E+02 | 4.13.5E-04 | I |
| 362943 | 359.8239 | 0.1410 | 4.26 | 24 | 15.0 | 4.50.3 | 2.60.8E+02 | 0.71.7E-05 | I |
| 362952 | 359.5303 | -0.0390 | 3.97 | 6 | 15.6 | 7.10.1 | 4.70.2E+02 | 2.41.1E-05 | I |
| 363252 | 359.5781 | -0.0101 | 1.55 | 12 | 15.0 | 5.40.3 | 1.70.2E+02 | 2.93.2E-04 | I |
| 365847 | 359.8251 | 0.1370 | 0.21 | 337 | 32.7 | 9.11.5 | 5.12.9E+03 | 0.11.7E-04 | I |
| 366204 | 359.6598 | 0.0350 | 6.06 | 72 | 15.7 | 8.01.3 | 3.31.7E+03 | 0.00.0E-00 | II |
| 370438 | 359.5058 | -0.0663 | 0.22 | 372 | 37.5 | 7.80.9 | 1.91.0E+03 | 1.43.9E-04 | I |
| 370894 | 359.6155 | 0.0001 | 1.21 | 3 | 15.0 | 6.50.1 | 2.50.1E+02 | 1.91.0E-04 | I |
| 371987 | 359.8203 | 0.1238 | 2.36 | 32 | 15.3 | 5.80.5 | 8.93.0E+02 | 0.00.0E-00 | II |
| 372254 | 359.4249 | -0.1189 | 8.40 | 2 | 16.8 | 6.80.0 | 3.40.0E+02 | 6.00.0E-05 | I |
| 372630 | 359.5113 | -0.0666 | 0.06 | 237 | 31.7 | 8.82.8 | 4.65.0E+03 | 2.27.8E-04 | I |
| 373058 | 359.5164 | -0.0641 | 0.03 | 99 | 31.3 | 7.90.6 | 2.21.2E+03 | 1.95.9E-04 | I |
| 374813 | 359.5477 | -0.0478 | 0.03 | 1000 | 38.8 | 9.51.0 | 4.81.8E+03 | 1.04.4E-04 | I |
| 376861 | 359.6040 | -0.0167 | 7.40 | 71 | 15.5 | 7.81.1 | 2.91.3E+03 | 0.00.0E-00 | II |
| 377183 | 359.3960 | -0.1447 | 5.22 | 31 | 16.2 | 7.80.5 | 2.70.6E+03 | 0.00.0E-00 | II |
| 380282 | 359.7906 | 0.0920 | 2.73 | 70 | 15.0 | 6.80.9 | 1.60.8E+03 | 1.07.7E-06 | II |
| 381931 | 359.4557 | -0.1158 | 0.50 | 12 | 27.3 | 3.63.6 | 7.28.5E+02 | 4.56.9E-04 | I |
| 384976 | 359.7965 | 0.0881 | 8.82 | 45 | 15.0 | 10.40.2 | 7.20.4E+03 | 0.00.0E-00 | III |
| 386185 | 359.4817 | -0.1068 | 3.58 | 79 | 15.5 | 7.40.5 | 2.10.6E+03 | 0.00.0E-00 | II |
| 387011 | 359.4816 | -0.1082 | 2.54 | 22 | 15.0 | 5.90.7 | 1.00.3E+03 | 2.74.0E-07 | II |
| 387018 | 359.7330 | 0.0458 | 8.15 | 41 | 15.0 | 10.20.3 | 6.70.8E+03 | 0.00.0E-00 | III |
| 390425 | 359.4830 | -0.1129 | 2.85 | 47 | 15.0 | 5.90.9 | 7.38.8E+02 | 0.51.9E-04 | I |
| 394544 | 359.9475 | 0.1649 | 0.72 | 552 | 27.5 | 5.71.0 | 9.26.1E+02 | 0.45.4E-05 | II |
| 395315 | 359.5677 | -0.0690 | 0.00 | 1400 | 34.7 | 8.70.9 | 3.51.3E+03 | 1.14.4E-04 | I |
| 397703 | 359.9313 | 0.1497 | 0.00 | 526 | 28.8 | 7.71.8 | 2.72.7E+03 | 1.66.7E-04 | I |
| 399231 | 359.9483 | 0.1576 | 0.07 | 528 | 35.1 | 8.01.8 | 3.54.2E+03 | 0.11.2E-04 | I |
| 399927 | 359.5769 | -0.0709 | 6.83 | 8 | 15.0 | 8.20.5 | 3.20.7E+03 | 1.52.6E-09 | II |
| 400062 | 359.5126 | -0.1105 | 0.00 | 379 | 33.1 | 6.51.9 | 1.72.2E+03 | 1.34.1E-04 | I |
| 401264 | 359.5329 | -0.1000 | 0.06 | 281 | 36.0 | 8.81.0 | 3.31.3E+03 | 1.96.3E-04 | I |
| 409238 | 359.6113 | -0.0651 | 8.31 | 7 | 15.0 | 8.70.0 | 4.00.0E+03 | 0.00.0E-00 | II |
| 409373 | 359.5185 | -0.1221 | 2.50 | 88 | 17.8 | 6.51.0 | 1.60.6E+03 | 0.00.0E-00 | II |
| 411192 | 359.6193 | -0.0633 | 0.07 | 303 | 32.6 | 7.02.0 | 2.42.6E+03 | 0.52.0E-04 | I |
| 412509 | 359.7154 | -0.0066 | 0.09 | 136 | 30.8 | 6.81.1 | 1.21.3E+03 | 1.54.0E-04 | I |
| 416141 | 359.9919 | 0.1567 | 15.72 | 13 | 15.0 | 10.71.3 | 8.23.3E+03 | 0.00.0E-00 | II |
| 417301 | 359.8509 | 0.0685 | 0.60 | 293 | 29.1 | 6.21.5 | 1.41.5E+03 | 1.07.0E-08 | II |
| 419271 | 359.5965 | -0.0903 | 0.00 | 1079 | 39.6 | 9.01.0 | 3.71.4E+03 | 1.14.3E-04 | I |
| 420459 | 359.6870 | -0.0368 | 12.33 | 26 | 15.0 | 13.10.9 | 1.40.2E+04 | 0.00.0E-00 | II |
| 421092 | 359.6650 | -0.0513 | 0.02 | 417 | 32.7 | 6.91.0 | 1.31.1E+03 | 1.64.4E-04 | I |
| 421780 | 359.5573 | -0.1183 | 0.00 | 649 | 33.0 | 5.61.9 | 1.11.5E+03 | 0.93.6E-04 | I |
| 431993 | 359.7828 | 0.0031 | 6.64 | 7 | 15.0 | 7.00.0 | 4.80.2E+02 | 2.73.2E-04 | I |
| 436449 | 359.6986 | -0.0554 | 5.46 | 673 | 15.0 | 9.90.3 | 6.10.8E+03 | 0.00.0E-00 | III |
| 440627 | 359.8361 | 0.0218 | 2.03 | 2 | 15.0 | 7.90.0 | 7.50.0E+02 | 4.93.3E-04 | I |
| 441299 | 359.7169 | -0.0521 | 6.74 | 53 | 15.0 | 8.50.7 | 3.81.1E+03 | 0.00.0E-00 | II |
| 442291 | 359.7696 | -0.0215 | 5.83 | 5 | 15.0 | 7.20.2 | 1.90.2E+03 | 0.61.1E-07 | II |
| 442669 | 359.6671 | -0.0848 | 11.06 | 5 | 15.0 | 10.30.1 | 6.80.3E+03 | 0.00.0E-00 | II |
| 447593 | 359.8057 | -0.0080 | 4.63 | 6 | 15.0 | 8.50.0 | 3.60.0E+03 | 0.00.0E-00 | II |
| 448031 | 359.8111 | -0.0054 | 12.85 | 10 | 15.0 | 8.30.7 | 2.91.5E+03 | 1.84.6E-05 | I |
| 454105 | 359.7053 | -0.0798 | 0.00 | 332 | 34.0 | 8.42.3 | 4.55.9E+03 | 0.11.9E-04 | I |
| 454135 | 359.6046 | -0.1414 | 0.01 | 328 | 33.1 | 5.91.9 | 1.21.7E+03 | 1.74.9E-04 | I |
| 457947 | 359.6273 | -0.1336 | 0.08 | 736 | 31.3 | 6.50.9 | 1.00.6E+03 | 0.52.0E-04 | I |
| 458543 | 359.7303 | -0.0716 | 0.19 | 102 | 31.2 | 7.30.9 | 2.01.0E+03 | 0.73.6E-04 | I |
| 460967 | 359.7678 | -0.0526 | 7.90 | 4 | 15.0 | 7.30.0 | 2.00.0E+03 | 6.10.0E-09 | II |
| 462136 | 359.6277 | -0.1401 | 1.96 | 66 | 15.3 | 6.31.4 | 1.41.6E+03 | 0.41.5E-05 | II |
| 462303 | 359.6423 | -0.1314 | 4.23 | 23 | 15.0 | 5.70.2 | 2.30.5E+02 | 1.13.3E-04 | I |
| 464434 | 359.6721 | -0.1166 | 8.13 | 10 | 15.0 | 7.80.7 | 2.71.0E+03 | 0.00.0E-00 | III |
| 466603 | 359.8973 | 0.0175 | 2.58 | 36 | 15.5 | 6.90.6 | 9.73.2E+02 | 0.81.6E-04 | I |
| 470861 | 359.8013 | -0.0478 | 11.32 | 9 | 16.0 | 7.70.4 | 2.40.5E+03 | 3.43.0E-09 | II |
| 472034 | 359.7097 | -0.1056 | 4.29 | 43 | 15.3 | 8.10.8 | 3.11.1E+03 | 0.00.0E-00 | II |
| 474477 | 359.8252 | -0.0389 | 0.00 | 393 | 31.0 | 5.41.6 | 0.71.1E+03 | 1.64.5E-04 | I |
| 475651 | 359.7068 | -0.1132 | 5.01 | 46 | 15.0 | 9.50.6 | 5.31.2E+03 | 0.00.0E-00 | III |
| 476516 | 359.7604 | -0.0818 | 0.00 | 334 | 31.3 | 8.62.2 | 4.54.2E+03 | 1.25.6E-04 | I |
| 479032 | 359.6584 | -0.1481 | 1.39 | 68 | 16.1 | 6.81.0 | 1.61.0E+03 | 0.32.6E-04 | I |
| 482056 | 359.9953 | 0.0529 | 0.00 | 594 | 33.7 | 8.11.3 | 1.71.0E+03 | 2.14.4E-04 | I |
| 487249 | 359.7847 | -0.0839 | 5.60 | 25 | 15.0 | 10.60.9 | 7.81.8E+03 | 0.00.0E-00 | II |
| 487365 | 359.8346 | -0.0536 | 9.18 | 45 | 15.0 | 8.80.6 | 4.11.0E+03 | 0.00.0E-00 | II |
| 487447 | 359.7735 | -0.0911 | 1.25 | 84 | 16.4 | 5.90.5 | 1.00.2E+03 | 0.22.3E-04 | I |
| 487733 | 359.8448 | -0.0480 | 7.91 | 17 | 15.0 | 9.60.3 | 5.90.6E+03 | 0.00.0E-00 | II |
| 491274 | 359.8231 | -0.0669 | 8.84 | 31 | 15.0 | 8.10.8 | 3.11.1E+03 | 0.00.0E-00 | II |
| 493379 | 359.8663 | -0.0438 | 5.65 | 43 | 15.2 | 9.60.5 | 5.91.2E+03 | 0.00.0E-00 | II |
| 493484 | 359.8327 | -0.0645 | 6.83 | 488 | 16.2 | 10.00.4 | 6.40.9E+03 | 0.00.0E-00 | II |
| 496117 | 359.8746 | -0.0431 | 8.53 | 25 | 15.0 | 10.51.0 | 7.52.1E+03 | 0.00.0E-00 | II |
| 496149 | 359.7832 | -0.0990 | 2.07 | 11 | 15.6 | 10.42.1 | 3.63.0E+03 | 0.61.4E-03 | I |
| 498795 | 359.9022 | -0.0305 | 0.01 | 304 | 30.3 | 8.31.7 | 3.43.0E+03 | 2.07.9E-04 | I |
| 503662 | 359.7937 | -0.1044 | 0.00 | 255 | 29.1 | 6.51.5 | 1.71.6E+03 | 0.00.0E-00 | II |
| 506001 | 359.8503 | -0.0735 | 12.05 | 3 | 15.0 | 6.80.0 | 5.10.0E+02 | 2.90.0E-04 | I |
| 509613 | 359.8985 | -0.0496 | 0.00 | 374 | 33.8 | 8.32.3 | 4.24.5E+03 | 0.74.1E-04 | I |
| 513569 | 359.8789 | -0.0677 | 0.00 | 403 | 23.2 | 5.40.6 | 4.52.4E+02 | 0.31.2E-04 | I |
| 514061 | 359.8771 | -0.0696 | 4.17 | 24 | 15.1 | 7.30.5 | 2.10.8E+03 | 4.29.5E-07 | II |
| 523841 | 359.8422 | -0.1062 | 0.03 | 260 | 34.5 | 5.61.5 | 7.51.1E+03 | 1.93.9E-04 | I |
| 526476 | 359.8701 | -0.0933 | 13.89 | 26 | 15.0 | 8.70.6 | 3.91.0E+03 | 0.63.4E-06 | II |
| 551160 | 359.8313 | -0.1552 | 2.95 | 60 | 15.8 | 6.10.7 | 1.00.4E+03 | 0.00.0E-00 | II |
| 562403 | 359.9172 | -0.1204 | 5.29 | 7 | 15.0 | 7.10.2 | 1.80.2E+03 | 0.71.1E-06 | II |
| 569532 | 359.8820 | -0.1529 | 5.27 | 37 | 15.0 | 10.10.4 | 6.50.8E+03 | 0.00.0E-00 | III |
| 573348 | 359.9211 | -0.1350 | 0.00 | 766 | 27.0 | 6.71.4 | 1.61.4E+03 | 1.14.4E-04 | I |
| 577334 | 359.9021 | -0.1528 | 3.66 | 7 | 15.9 | 6.10.2 | 2.40.2E+02 | 1.20.6E-04 | I |
| 580183 | 359.9629 | -0.1201 | 0.08 | 107 | 30.2 | 7.60.8 | 2.01.4E+03 | 0.93.7E-04 | I |
| 585293 | 359.9357 | -0.1445 | 0.05 | 33 | 24.2 | 10.51.6 | 7.94.1E+03 | 1.54.5E-06 | II |
| SST GC # | nfits | Stage | |||||||
|---|---|---|---|---|---|---|---|---|---|
| 625950 | 0.4807 | 0.1243 | 2.90 | 2 | 15.0 | 8.80.1 | 1.40.2E+03 | 1.50.8E-03 | I |
| 630016 | 0.5217 | 0.1431 | 0.35 | 220 | 36.5 | 10.21.5 | 3.81.4E+03 | 0.41.1E-03 | I |
| 630178 | 0.3082 | 0.0130 | 1.89 | 43 | 15.6 | 6.70.4 | 1.00.6E+03 | 0.61.7E-04 | I |
| 630480 | 0.3268 | 0.0238 | 5.97 | 49 | 15.0 | 8.30.7 | 3.50.9E+03 | 0.00.0E-00 | II |
| 630841 | 0.3311 | 0.0258 | 0.00 | 1087 | 33.4 | 7.71.0 | 2.41.2E+03 | 1.04.2E-04 | I |
| 630883 | 0.1551 | -0.0813 | 7.85 | 62 | 15.1 | 9.60.6 | 5.71.2E+03 | 0.00.0E-00 | II |
| 637548 | 0.5413 | 0.1433 | 6.75 | 7 | 15.0 | 6.20.3 | 2.80.4E+02 | 2.73.8E-04 | I |
| 639320 | 0.3763 | 0.0402 | 10.22 | 5 | 21.6 | 10.00.7 | 3.20.6E+03 | 7.42.7E-04 | I |
| 640649 | 0.5798 | 0.1618 | 0.00 | 806 | 35.8 | 5.31.4 | 8.80.1E+02 | 0.21.6E-04 | I |
| 640996 | 0.5520 | 0.1443 | 6.98 | 14 | 15.1 | 15.21.7 | 2.20.7E+04 | 0.00.0E-00 | II |
| 652737 | 0.4320 | 0.0529 | 3.45 | 10 | 15.0 | 6.90.0 | 1.50.0E+00 | 0.00.0E-00 | III |
| 656573 | 0.4443 | 0.0545 | 7.51 | 232 | 15.6 | 9.60.0 | 5.50.0E+00 | 0.00.0E-00 | III |
| 661922 | 0.1874 | -0.1099 | 14.87 | 17 | 15.0 | 11.20.2 | 8.90.5E+03 | 0.00.0E-00 | II |
| 662019 | 0.1358 | -0.1414 | 0.00 | 726 | 31.1 | 5.31.3 | 5.66.0E+02 | 1.53.8E-04 | I |
| 668833 | 0.4817 | 0.0582 | 0.00 | 327 | 33.6 | 4.81.2 | 6.19.0E+02 | 1.77.2E-09 | II |
| 673150 | 0.4771 | 0.0487 | 7.37 | 6 | 15.0 | 7.30.0 | 1.90.0E+03 | 0.00.0E-00 | II |
| 674497 | 0.4656 | 0.0395 | 0.64 | 58 | 22.0 | 6.20.9 | 3.81.9E+02 | 4.15.6E-04 | I |
| 676058 | 0.3440 | -0.0367 | 0.00 | 670 | 33.8 | 6.11.7 | 1.21.3E+03 | 1.13.6E-04 | I |
| 686815 | 0.5895 | 0.0954 | 5.04 | 17 | 15.0 | 6.50.4 | 1.20.5E+03 | 1.22.7E-05 | I |
| 692917 | 0.3497 | -0.0596 | 0.00 | 441 | 39.3 | 8.81.1 | 2.30.9E+03 | 3.07.4E-04 | I |
| 693461 | 0.4654 | 0.0097 | 0.00 | 953 | 30.4 | 5.71.2 | 9.77.8E+02 | 0.11.4E-09 | II |
| 697182 | 0.7048 | 0.1492 | 3.24 | 13 | 15.0 | 5.10.3 | 1.50.1E+02 | 3.42.8E-05 | I |
| 697485 | 0.4753 | 0.0094 | 8.75 | 3 | 15.0 | 5.50.0 | 1.50.0E+02 | 7.10.0E-05 | I |
| 698825 | 0.7023 | 0.1450 | 7.43 | 292 | 15.6 | 10.20.1 | 6.70.4E+03 | 0.00.0E-00 | II |
| 699821 | 0.7209 | 0.1549 | 5.57 | 54 | 20.7 | 10.11.0 | 6.82.3E+03 | 0.00.0E-00 | II |
| 701002 | 0.3521 | -0.0708 | 0.00 | 268 | 31.9 | 7.21.9 | 2.52.7E+03 | 0.12.0E-04 | I |
| 705059 | 0.6518 | 0.1047 | 0.14 | 317 | 22.6 | 6.21.0 | 1.30.8E+03 | 0.12.5E-05 | II |
| 708923 | 0.3715 | -0.0714 | 0.01 | 187 | 33.6 | 6.51.4 | 1.21.5E+03 | 1.74.0E-04 | I |
| 712604 | 0.7349 | 0.1432 | 11.32 | 2 | 15.0 | 5.50.0 | 1.50.0E+02 | 7.10.0E-05 | I |
| 719022 | 0.4264 | -0.0541 | 0.00 | 831 | 33.0 | 7.70.9 | 2.51.2E+03 | 0.31.5E-04 | I |
| 719445 | 0.4921 | -0.0148 | 0.37 | 236 | 39.1 | 10.72.2 | 4.22.0E+03 | 0.61.3E-03 | I |
| 720672 | 0.5318 | 0.0073 | 0.03 | 319 | 34.3 | 6.90.8 | 1.30.9E+03 | 1.54.3E-04 | I |
| 722141 | 0.5326 | 0.0056 | 0.22 | 89 | 43.8 | 9.41.3 | 2.60.8E+03 | 0.71.2E-03 | I |
| 725275 | 0.3765 | -0.0941 | 0.01 | 263 | 32.1 | 5.91.4 | 0.81.1E+03 | 2.24.7E-04 | I |
| 726772 | 0.3766 | -0.0965 | 7.54 | 20 | 15.0 | 8.80.7 | 3.81.7E+03 | 0.31.4E-04 | I |
| 728239 | 0.4561 | -0.0508 | 0.32 | 129 | 26.0 | 7.82.0 | 3.03.1E+03 | 1.02.4E-04 | I |
| 730947 | 0.3978 | -0.0908 | 2.71 | 24 | 15.7 | 8.00.9 | 3.31.3E+03 | 0.51.3E-05 | II |
| 734229 | 0.7824 | 0.1368 | 4.05 | 173 | 19.3 | 7.70.8 | 2.71.3E+03 | 0.00.0E-00 | II |
| 735664 | 0.4206 | -0.0849 | 0.00 | 1570 | 28.6 | 8.61.0 | 3.41.4E+03 | 1.14.3E-04 | I |
| 735924 | 0.4521 | -0.0663 | 3.94 | 7 | 15.0 | 8.50.0 | 3.60.0E+03 | 0.00.0E-00 | II |
| 736152 | 0.4168 | -0.0880 | 0.20 | 73 | 21.7 | 6.00.7 | 9.35.8E+02 | 0.62.6E-04 | I |
| 738112 | 0.3738 | -0.1175 | 0.50 | 281 | 16.3 | 6.40.8 | 1.30.6E+03 | 0.00.0E-00 | II |
| 738917 | 0.8269 | 0.1559 | 12.34 | 3 | 15.0 | 5.50.0 | 1.50.0E+02 | 7.10.0E-05 | I |
| 747205 | 0.6418 | 0.0293 | 11.93 | 29 | 15.0 | 14.60.0 | 1.90.0E+04 | 0.00.0E-00 | III |
| 748963 | 0.4127 | -0.1127 | 0.00 | 638 | 30.3 | 5.61.4 | 7.28.0E+02 | 1.54.1E-04 | I |
| 749851 | 0.6742 | 0.0442 | 9.31 | 38 | 19.1 | 7.20.8 | 2.00.8E+03 | 0.00.0E-00 | II |
| 751713 | 0.6051 | -0.0012 | 0.07 | 265 | 31.4 | 7.91.6 | 2.92.8E+03 | 1.34.8E-04 | I |
| 753072 | 0.8050 | 0.1175 | 2.25 | 12 | 15.0 | 5.90.4 | 4.00.9E+02 | 5.37.4E-05 | I |
| 754939 | 0.8335 | 0.1313 | 0.01 | 523 | 20.5 | 4.80.6 | 4.52.5E+02 | 0.24.0E-05 | II |
| 759523 | 0.4366 | -0.1178 | 2.95 | 129 | 24.6 | 11.01.0 | 8.92.7E+03 | 0.00.0E-00 | II |
| 760167 | 0.4250 | -0.1261 | 3.07 | 33 | 18.6 | 8.31.1 | 3.42.0E+03 | 0.93.8E-04 | I |
| 760268 | 0.7882 | 0.0938 | 0.00 | 295 | 32.7 | 5.31.8 | 0.91.3E+03 | 0.62.4E-04 | I |
| 762849 | 0.4837 | -0.0957 | 0.00 | 676 | 29.7 | 6.31.5 | 1.51.9E+03 | 0.11.5E-04 | I |
| 763989 | 0.3742 | -0.1642 | 0.00 | 613 | 30.4 | 6.21.8 | 1.52.0E+03 | 0.73.5E-04 | I |
| 764024 | 0.8377 | 0.1166 | 0.11 | 416 | 31.8 | 7.30.9 | 2.21.2E+03 | 0.41.3E-04 | I |
| 769807 | 0.6417 | -0.0130 | 0.04 | 671 | 23.7 | 5.40.9 | 7.75.9E+02 | 0.35.1E-05 | II |
| 770318 | 0.3979 | -0.1617 | 4.30 | 57 | 15.2 | 9.00.4 | 4.40.6E+03 | 0.00.0E-00 | III |
| 772097 | 0.7192 | 0.0294 | 0.00 | 548 | 41.3 | 8.71.0 | 3.11.0E+03 | 1.64.7E-04 | I |
| 772886 | 0.4015 | -0.1644 | 0.22 | 66 | 28.3 | 7.31.4 | 2.21.8E+03 | 0.72.0E-05 | II |
| 773332 | 0.6102 | -0.0389 | 0.00 | 216 | 36.5 | 7.50.8 | 2.10.9E+03 | 1.45.1E-04 | I |
| 776632 | 0.9188 | 0.1418 | 0.14 | 204 | 16.4 | 4.60.6 | 4.02.8E+02 | 0.73.5E-08 | II |
| 776865 | 0.7564 | 0.0429 | 3.25 | 36 | 15.8 | 4.10.3 | 0.26.9E+01 | 0.00.0E-00 | II |
| 779211 | 0.6142 | -0.0477 | 0.02 | 109 | 35.9 | 8.50.9 | 2.91.3E+03 | 2.86.7E-04 | I |
| 780313 | 0.9184 | 0.1345 | 3.81 | 2672 | 15.0 | 14.60.0 | 1.90.0E+04 | 0.00.0E-00 | III |
| 784931 | 0.6437 | -0.0405 | 0.71 | 120 | 44.4 | 9.02.0 | 4.94.8E+03 | 1.75.9E-04 | I |
| 785382 | 0.9154 | 0.1230 | 0.00 | 796 | 39.0 | 8.91.1 | 3.31.2E+03 | 1.65.5E-04 | I |
| 787884 | 0.6428 | -0.0466 | 0.01 | 475 | 35.0 | 9.01.2 | 2.51.1E+03 | 2.87.2E-04 | I |
| 790413 | 0.5867 | -0.0854 | 0.37 | 76 | 29.1 | 8.20.8 | 1.30.5E+03 | 3.87.3E-04 | I |
| 793536 | 0.6484 | -0.0540 | 47.79 | 1 | 15.0 | 7.90.0 | 7.40.0E+02 | 1.50.0E-04 | I |
| 793867 | 0.6818 | -0.0344 | 0.14 | 336 | 36.7 | 8.61.0 | 3.01.7E+03 | 2.06.1E-04 | I |
| 795418 | 0.6355 | -0.0653 | 0.00 | 703 | 31.9 | 6.61.1 | 1.10.9E+03 | 1.64.3E-04 | I |
| 795658 | 0.5621 | -0.1102 | 0.08 | 150 | 38.6 | 5.71.5 | 1.11.7E+03 | 1.34.5E-04 | I |
| 795914 | 0.8815 | 0.0826 | 0.39 | 467 | 35.6 | 5.11.0 | 0.61.1E+03 | 1.38.7E-05 | I |
| 796410 | 0.6606 | -0.0520 | 0.04 | 339 | 32.0 | 7.51.3 | 2.01.8E+03 | 1.65.0E-04 | I |
| 797252 | 0.6810 | -0.0413 | 0.00 | 405 | 30.1 | 7.32.0 | 2.63.2E+03 | 1.45.7E-04 | I |
| 801788 | 0.8674 | 0.0629 | 4.41 | 146 | 15.0 | 4.50.0 | 3.30.0E+02 | 0.00.0E-00 | II |
| 802032 | 0.8693 | 0.0635 | 0.00 | 1040 | 29.9 | 4.40.9 | 3.73.4E+02 | 0.12.6E-07 | II |
| 802748 | 0.7511 | -0.0093 | 0.12 | 199 | 18.2 | 5.10.6 | 3.21.1E+02 | 0.41.5E-04 | I |
| 802877 | 0.8718 | 0.0634 | 2.99 | 14 | 15.0 | 3.80.3 | 1.70.5E+02 | 0.00.0E-00 | II |
| 804299 | 0.8768 | 0.0636 | 0.04 | 423 | 17.7 | 3.70.4 | 1.50.8E+02 | 1.34.8E-08 | II |
| 805200 | 0.6179 | -0.0948 | 0.00 | 462 | 37.5 | 8.50.9 | 3.01.0E+03 | 2.16.9E-04 | I |
| 806191 | 0.6326 | -0.0880 | 0.02 | 154 | 38.9 | 8.81.3 | 2.00.9E+03 | 0.61.1E-03 | I |
| 807365 | 0.9825 | 0.1211 | 0.00 | 502 | 29.2 | 6.01.5 | 1.31.6E+03 | 0.75.8E-09 | II |
| 807789 | 0.5456 | -0.1440 | 0.00 | 510 | 29.4 | 6.31.9 | 1.62.2E+03 | 0.83.7E-04 | I |
| 809058 | 0.5288 | -0.1569 | 8.77 | 9 | 15.0 | 7.60.7 | 2.40.8E+03 | 0.51.0E-06 | II |
| 809602 | 0.9572 | 0.1011 | 1.05 | 306 | 39.1 | 5.31.0 | 7.66.0E+02 | 0.11.1E-04 | I |
| 810562 | 0.6899 | -0.0626 | 0.00 | 555 | 35.9 | 5.91.7 | 1.31.8E+03 | 0.42.3E-04 | I |
| 811158 | 0.5871 | -0.1260 | 0.00 | 1127 | 37.9 | 9.41.1 | 4.51.7E+03 | 1.14.6E-04 | I |
| 811550 | 0.7552 | -0.0252 | 0.02 | 615 | 26.2 | 6.40.7 | 8.64.3E+02 | 0.72.5E-04 | I |
| 812377 | 0.6003 | -0.1205 | 0.12 | 390 | 40.8 | 8.50.8 | 2.91.2E+03 | 1.23.6E-04 | I |
| 814299 | 0.7259 | -0.0485 | 0.02 | 1052 | 29.3 | 5.21.1 | 7.26.2E+02 | 0.39.9E-06 | II |
| 818720 | 0.7520 | -0.0419 | 0.01 | 492 | 30.3 | 6.51.2 | 1.51.1E+03 | 0.00.0E-00 | II |
| 819806 | 0.5527 | -0.1647 | 0.02 | 807 | 35.0 | 6.51.0 | 1.31.0E+03 | 0.31.2E-04 | I |
| 820972 | 0.8029 | -0.0159 | 6.60 | 51 | 15.7 | 6.70.7 | 1.40.5E+03 | 0.94.4E-04 | I |
| 821060 | 0.5660 | -0.1594 | 0.00 | 706 | 30.6 | 5.41.4 | 6.77.6E+02 | 1.33.9E-04 | I |
| 826501 | 0.7728 | -0.0458 | 8.19 | 10 | 17.0 | 5.90.6 | 2.20.3E+02 | 4.03.6E-04 | I |
| 826931 | 0.9561 | 0.0640 | 3.85 | 69 | 15.5 | 5.20.4 | 6.11.8E+02 | 0.00.0E-00 | II |
| 828786 | 0.7263 | -0.0789 | 0.06 | 520 | 27.2 | 4.40.8 | 3.62.4E+02 | 0.01.4E-05 | II |
| 829672 | 1.0693 | 0.1266 | 0.00 | 985 | 27.2 | 4.30.7 | 3.12.5E+02 | 0.12.0E-05 | II |
| 830399 | 0.5877 | -0.1661 | 0.38 | 172 | 16.8 | 4.10.8 | 1.21.0E+02 | 2.56.6E-05 | I |
| 830971 | 0.9619 | 0.0588 | 0.00 | 838 | 27.6 | 5.00.8 | 5.53.9E+02 | 0.13.3E-05 | II |
| 831103 | 1.0790 | 0.1294 | 7.16 | 14 | 15.0 | 6.40.6 | 1.00.6E+03 | 1.52.9E-05 | I |
| 831236 | 0.5899 | -0.1665 | 9.66 | 1 | 15.0 | 6.00.0 | 2.10.0E+02 | 9.80.0E-05 | I |
| 837363 | 0.6703 | -0.1307 | 0.13 | 378 | 22.3 | 4.81.0 | 1.71.0E+02 | 8.61.8E-04 | I |
| 839447 | 0.6195 | -0.1657 | 0.01 | 635 | 41.8 | 11.11.4 | 8.02.6E+03 | 1.76.5E-04 | I |
| 841071 | 0.8188 | -0.0487 | 0.02 | 438 | 35.2 | 6.71.1 | 1.21.0E+03 | 1.33.4E-04 | I |
| 842086 | 0.7590 | -0.0869 | 6.51 | 85 | 22.8 | 9.80.8 | 6.11.5E+03 | 0.00.0E-00 | II |
| 844666 | 0.8868 | -0.0152 | 8.10 | 9 | 46.8 | 9.81.9 | 6.43.8E+03 | 0.00.0E-00 | II |
| 848731 | 0.9049 | -0.0128 | 2.85 | 11 | 15.0 | 3.90.2 | 1.20.4E+02 | 1.51.1E-08 | II |
| 849203 | 0.9969 | 0.0417 | 10.44 | 19 | 15.0 | 7.90.5 | 2.80.7E+03 | 0.00.0E-00 | III |
| 849731 | 0.9969 | 0.0405 | 22.12 | 3 | 15.0 | 6.60.0 | 4.60.0E+02 | 1.70.0E-05 | I |
| 850592 | 0.8439 | -0.0537 | 0.04 | 162 | 33.8 | 9.21.0 | 4.61.6E+03 | 1.37.5E-04 | I |
| 853347 | 1.0547 | 0.0677 | 4.64 | 42 | 15.0 | 9.20.2 | 4.70.4E+03 | 0.00.0E-00 | III |
| 857133 | 1.0477 | 0.0553 | 0.00 | 213 | 34.1 | 7.30.7 | 1.80.9E+03 | 0.52.7E-04 | I |
| 857708 | 0.8444 | -0.0687 | 4.52 | 5 | 15.0 | 6.00.3 | 2.40.4E+02 | 0.17.3E-05 | I |
| 860855 | 0.8333 | -0.0820 | 2.64 | 10 | 15.0 | 6.90.0 | 1.50.0E+03 | 0.00.0E-00 | III |
| 861689 | 0.9902 | 0.0108 | 0.62 | 332 | 32.1 | 8.01.2 | 3.12.1E+03 | 0.68.6E-05 | II |
| 864818 | 0.8977 | -0.0516 | 4.37 | 25 | 43.9 | 11.20.8 | 9.61.9E+03 | 0.00.0E-00 | II |
| 866280 | 0.8145 | -0.1051 | 5.90 | 1156 | 15.0 | 6.60.1 | 1.30.1E+03 | 0.00.0E-00 | III |
| 868530 | 0.7986 | -0.1198 | 1.88 | 65 | 15.0 | 6.00.5 | 1.00.3E+03 | 0.00.0E-00 | III |
| 869198 | 1.0000 | 0.0001 | 5.10 | 47 | 15.2 | 4.10.4 | 2.40.8E+02 | 1.06.7E-06 | II |
| 869219 | 0.8074 | -0.1161 | 6.28 | 3 | 15.0 | 5.10.0 | 1.50.0E+02 | 4.60.0E-05 | I |
| 869244 | 0.9121 | -0.0530 | 3.99 | 72 | 42.1 | 9.60.0 | 5.50.0E+03 | 0.00.0E-00 | III |
| 869472 | 0.9372 | -0.0384 | 0.03 | 426 | 28.4 | 3.70.8 | 1.31.2E+02 | 0.31.8E-04 | I |
| 871019 | 0.7332 | -0.1652 | 6.19 | 735 | 15.0 | 10.00.3 | 6.20.6E+03 | 0.00.0E-00 | III |
| 878691 | 0.8826 | -0.0935 | 0.69 | 5 | 16.5 | 7.90.1 | 1.00.0E+03 | 3.45.5E-04 | I |
| 879350 | 1.0082 | -0.0193 | 5.28 | 24 | 16.0 | 5.90.5 | 9.43.2E+02 | 0.00.0E-00 | II |
| 879793 | 0.7827 | -0.1564 | 2.37 | 16 | 15.0 | 7.30.2 | 1.90.2E+03 | 1.60.4E-08 | II |
| 881125 | 0.7777 | -0.1626 | 11.09 | 17 | 15.0 | 6.80.4 | 1.40.5E+03 | 2.15.7E-05 | I |
| 884709 | 0.9500 | -0.0671 | 0.05 | 1169 | 28.5 | 3.50.7 | 1.51.4E+02 | 0.38.0E-06 | II |
| 884809 | 1.0370 | -0.0149 | 4.32 | 7 | 15.0 | 5.50.0 | 1.70.1E+02 | 5.41.4E-05 | I |
| 887636 | 0.9713 | -0.0612 | 3.59 | 9 | 15.3 | 5.90.6 | 2.50.3E+02 | 2.51.9E-04 | I |
| 891214 | 1.1138 | 0.0161 | 0.01 | 350 | 28.5 | 4.31.8 | 4.46.3E+02 | 1.22.6E-04 | I |
| 891918 | 1.0501 | -0.0239 | 5.60 | 74 | 18.9 | 7.50.5 | 2.30.6E+03 | 0.00.0E-00 | II |
| 892828 | 0.8474 | -0.1484 | 6.14 | 15 | 15.0 | 5.40.2 | 5.02.6E+02 | 1.72.5E-05 | I |
| 899543 | 1.1011 | -0.0113 | 0.06 | 225 | 29.0 | 6.91.9 | 2.33.0E+03 | 0.94.0E-04 | I |
| 899611 | 0.9782 | -0.0856 | 14.19 | 2 | 15.0 | 5.50.0 | 1.50.0E+02 | 7.10.0E-05 | I |
| Source | Galactic | Description | ||
|---|---|---|---|---|
| l b | h m s | |||
| 0 | 1.041-0.072 | 17 48 21.37 | -28 05 00.7 | point |
| 1 | 0.955-0.786 | 17 50 56.34 | -28 31 24.4 | PN, extended? |
| 2 | 0.868-0.697 | 17 50 23.32 | -28 33 11.6 | PN, point |
| 3 | 0.826-0.211 | 17 48 23.59 | -28 20 20.7 | point |
| 4 | 0.780-0.740 | 17 50 21.09 | -28 39 03.2 | PN, extended |
| 5 | 0.707+0.408 | 17 45 42.73 | -28 07 12.1 | extinction of a dark cloud? |
| 6 | 0.692-0.046 | 17 47 26.27 | -28 22 06.7 | extended |
| 7 | 0.679-0.038 | 17 47 22.65 | -28 22 31.6 | point |
| 8 | 0.667-0.037 | 17 47 20.60 | -28 23 06.6 | extended? |
| 9 | 0.667-0.035 | 17 47 20.20 | -28 23 05.7 | point |
| 10 | 0.665-0.054 | 17 47 24.28 | -28 23 44.2 | point |
| 11 | 0.542-0.476 | 17 48 45.67 | -28 43 10.9 | point |
| 12 | 0.517-0.657 | 17 49 24.74 | -28 50 02.0 | point |
| 13 | 0.483-0.701 | 17 49 30.15 | -28 53 06.8 | point |
| 14 | 0.477-0.727 | 17 49 35.52 | -28 54 15.8 | point |
| 15 | 0.408-0.505 | 17 48 33.53 | -28 50 56.1 | extended |
| 16 | 0.376+0.040 | 17 46 21.44 | -28 35 37.9 | extended |
| 17 | 0.315-0.201 | 17 47 09.17 | -28 46 17.8 | point |
| 18 | 0.167-0.445 | 17 47 45.38 | -29 01 29.7 | point? |
| 19 | 0.091-0.663 | 17 48 25.71 | -29 12 07.4 | extended (+point) |
| 20 | 0.084-0.642 | 17 48 19.86 | -29 11 49.2 | point |
| 21 | 359.972-0.459 | 17 47 20.94 | -29 11 54.0 | extended (+point) |
| 22 | 359.939+0.170 | 17 44 48.62 | -28 53 59.1 | extended |
| 23 | 359.932-0.063 | 17 45 42.23 | -29 01 38.7 | point |
| 24 | 359.907-0.303 | 17 46 35.04 | -29 10 23.2 | point |
| 25 | 359.841-0.080 | 17 45 33.04 | -29 06 49.4 | point |
| 26 | 359.614-0.245 | 17 45 39.29 | -29 23 35.3 | extended |
| 27 | 359.599-0.032 | 17 44 47.27 | -29 17 41.4 | point |
| 28 | 359.570+0.270 | 17 43 32.36 | -29 09 40.8 | point |
| 29 | 359.437-0.102 | 17 44 40.46 | -29 28 10.6 | extended |
| 30 | 359.300+0.033 | 17 43 48.85 | -29 30 55.2 | extended |
| 31 | 359.199+0.041 | 17 43 32.35 | -29 35 51.1 | point |
| 32 | 358.980+0.084 | 17 42 50.45 | -29 45 42.2 | 2 points |
* Visually identified from IRAC data. Many point sources may be multiple or extended sources at higher resolution.
| source | l | b | Flux (mJy) | S/N | ||
|---|---|---|---|---|---|---|
| 1 | 0.95549 | -0.78554 | 17 50 56.34 | -28 31 24.4 | 446 | 9.19 |
| 22* | 0.83579 | +0.18444 | 17 46 52.86 | -28 07 34.8 | 98080 | 43.32 |
| 3 | 0.82608 | -0.21067 | 17 48 23.59 | -28 20 20.7 | – | – |
| 5 | 0.70721 | +0.40788 | 17 45 42.73 | -28 07 12.1 | – | – |
| 10* | 0.49639 | +0.18764 | 17 46 04.07 | -28 24 52.8 | 76270 | 39.54 |
| 14 | 0.47696 | -0.72730 | 17 49 35.52 | -28 54 15.8 | – | – |
| 24 | 359.90724 | -0.30319 | 17 46 35.05 | -29 10 23.2 | – | – |
| 28 | 359.57031 | +0.26985 | 17 43 32.37 | -29 09 40.8 | 2540 | 6.53 |
| 31 | 359.19896 | +0.04097 | 17 43 32.35 | -29 35 51.2 | – | – |
* Source # given is for table of methanol class II maser sources.
| Source | Galactic | vLSR | Reference | ||
|---|---|---|---|---|---|
| l b | h m s | km s-1 | |||
| 0 | 359.617-0.252 | 17 45 41.32 | -29 23 40.5 | +19.3 | S94,V00 |
| 1 | 359.898-0.066 | 17 45 38.21 | -29 03 27.7 | +21 | H90,V00 |
| 2 | 359.982-0.075 | 17 45 52.01 | -28 59 26.7 | +44.5 | H90,V00 |
| 3 | 0.682-0.026 | 17 47 20.19 | -28 22 03.2 | +54 | M97 |
| 4 | 0.678-0.023 | 17 47 18.80 | -28 22 08.3 | +68 | M97 |
| 5 | 0.677-0.023 | 17 47 18.71 | -28 22 09.5 | +70 | M97 |
| 6 | 0.679-0.026 | 17 47 19.72 | -28 22 09.5 | +66 | M97 |
| 7 | 0.679-0.026 | 17 47 19.74 | -28 22 09.6 | +66 | M97 |
| 8 | 0.678-0.025 | 17 47 19.39 | -28 22 10.7 | +62 | M97 |
| 9 | 0.670-0.021 | 17 47 17.43 | -28 22 27.7 | +63 | M97 |
| 10 | 0.668-0.023 | 17 47 17.40 | -28 22 38.0 | +75 | M97 |
| 11 | 0.667-0.026 | 17 47 18.11 | -28 22 49.0 | +78 | M97 |
| 12 | 0.662-0.020 | 17 47 15.98 | -28 22 50.5 | +74 | M97 |
| 13 | 0.667-0.027 | 17 47 18.33 | -28 22 50.8 | +78 | M97 |
| 14 | 0.666-0.028 | 17 47 18.44 | -28 22 55.7 | +73 | M97 |
| 15 | 0.665-0.030 | 17 47 18.84 | -28 23 01.2 | +64 | M97 |
| 16 | 0.664-0.031 | 17 47 18.85 | -28 23 04.8 | +67 | M97 |
| 17 | 0.661-0.027 | 17 47 17.39 | -28 23 05.7 | +46 | M97 |
| 18 | 0.661-0.029 | 17 47 17.83 | -28 23 11.1 | +57 | M97 |
| 19 | 0.655-0.035 | 17 47 18.43 | -28 23 41.3 | +71 | M97 |
| 20 | 0.542-0.855 | 17 50 14.74 | -28 54 50.6 | +16.9 | S94,V00 |
References: H90 = Haschick, Menten & Baan 1990 (44 GHz); S94 = Slysh et al. 1994 (44 GHz); M97 = Mehringer et al. 1997 (44 GHz, multiple sources in Sgr B2); V00 = Val’tts et al. 2000 (95 GHz)
| Source | Galactic | vLSR | Reference | ||
|---|---|---|---|---|---|
| l b | h m s | km s-1 | |||
| 0 | 359.138+0.031 | 17:43:25.69 | -29:39:17.4 | -4.0 | C96,W98 |
| 1 | 359.436-0.104 | 17:44:40.60 | -29:28:16.0 | -52.0 | C96 |
| 2 | 359.436-0.102 | 17:44:40.21 | -29:28:12.5 | -53.6 | C96 |
| 3 | 359.615-0.243 | 17:45:39.09 | -29:23:30.0 | +22.5 | C96 |
| 4 | 359.970-0.457 | 17:47:20.17 | -29:11:59.4 | +23.0 | C96 |
| 5 | 0.212-0.001 | 17:46:07.63 | -28:45:20.9 | +49.2 | C96,W98 |
| 6 | 0.315-0.201 | 17:47:09.13 | -28:46:15.7 | +18.0 | C96,W98 |
| 7 | 0.316-0.201 | 17:47:09.33 | -28:46:16.0 | +21.0 | C96 |
| 8 | 0.376+0.040 | 17:46:21.31 | -28:35:39.3 | +37.0 | C96 |
| 9 | 0.393-0.034 | 17:46:41.12 | -28:37:05.1 | +28.7 | C96 |
| 10 | 0.496+0.188 | 17:46:03.96 | -28:24:52.8 | +0.8 | C96,W98 |
| 11 | 0.645-0.042 | 17:47:18.67 | -28:24:24.8 | +49.1 | C96 |
| 12 | 0.647-0.055 | 17:47:22.07 | -28:24:42.3 | +51.0 | C96 |
| 13 | 0.651-0.049 | 17:47:21.13 | -28:24:18.1 | +48.0 | C96 |
| 14 | 0.657-0.041 | 17:47:20.08 | -28:23:47.1 | +52.0 | C96 |
| 15 | 0.665-0.036 | 17:47:20.04 | -28:23:12.8 | +60.4 | C96,W98 |
| 16 | 0.666-0.029 | 17:47:18.66 | -28:22:54.5 | +72.2 | C96 |
| 17 | 0.667-0.034 | 17:47:19.87 | -28:23:01.3 | +55.2 | C96 |
| 18 | 0.672-0.031 | 17:47:20.03 | -28:22:41.7 | +58.2 | C96 |
| 19 | 0.673-0.029 | 17:47:19.54 | -28:22:32.6 | +66.0 | C96 |
| 20 | 0.677-0.025 | 17:47:19.29 | -28:22:14.6 | +73.4 | C96 |
| 21 | 0.695-0.038 | 17:47:24.76 | -28:21:43.2 | +68.5 | C96 |
| 22 | 0.836+0.184 | 17:46:52.86 | -28:07:34.8 | +3.5 | C96,W98 |
References: C96 = Caswell 1996; W98 = Walsh et al. 1998
| Green # | SST GC # | nfits | A | Stage | ||||||
|---|---|---|---|---|---|---|---|---|---|---|
| g0 | 909173 | 1.0407 | -0.0714 | 4.36 | 31 | 42.4 | 16.13.5 | 2.81.4E+04 | 0.00.0E+00 | III |
| g3 | 913321 | 0.8262 | -0.2108 | 11.45 | 4 | 43.6 | 10.60.0 | 7.60.0E+03 | 0.00.0E+00 | II |
| g6 | 803187 | 0.6934 | -0.0451 | 1.71 | 46 | 46.7 | 29.98.2 | 1.41.0E+05 | 1.30.6E-03 | I |
| g7 | 794899 | 0.6796 | -0.0376 | 7.33 | 20 | 7.5 | 9.41.2 | 3.10.7E+03 | 5.85.8E-04 | I |
| g9 | 789483 | 0.6667 | -0.0352 | 1.37 | 169 | 27.0 | 21.77.0 | 6.16.4E+04 | 1.61.5E-03 | I |
| g10 | 798750 | 0.6655 | -0.0535 | 1.96 | 12 | 5.1 | 9.50.7 | 2.00.5E+03 | 3.58.4E-04 | I |
| g16 | 639320 | 0.3763 | 0.0402 | 10.22 | 9 | 14.0 | 10.10.6 | 3.20.6E+03 | 8.12.7E-04 | I |
| g23 | 530763 | 359.9316 | -0.0626 | 2.72 | 32 | 17.9 | 12.03.2 | 9.94.6E+03 | 1.30.6E-03 | I |
| g25 | 506137 | 359.8412 | -0.0793 | 2.76 | 39 | 12.5 | 10.31.2 | 5.51.9E+03 | 3.11.8E-04 | I |
| g27 | 384307 | 359.5995 | -0.0316 | 4.77 | 3 | 35.0 | 17.53.0 | 3.21.9E+04 | 2.23.1E-03 | II |
| g29 | 366044 | 359.4362 | -0.1017 | 3.18 | 70 | 22.3 | 14.12.4 | 1.90.9E+04 | 1.10.4E-03 | I |
| g30 | 246410 | 359.3009 | 0.0334 | 1.87 | 11 | 9.8 | 8.90.7 | 1.70.5E+03 | 2.01.9E-04 | I |
| g31 | 214725 | 359.1994 | 0.0419 | 2.75 | 69 | 35.9 | 14.44.6 | 2.31.6E+04 | 0.00.0E-00 | II |
| g32 | 142942 | 358.9795 | 0.0840 | 0.00 | 374 | 10.9 | 10.56.0 | 0.81.4E+04 | 0.71.0E-03 | I |
| Green # | SST GC # | nfits | Stage | |||||||
|---|---|---|---|---|---|---|---|---|---|---|
| g1 | 1060982 | 0.9555 | -0.7853 | 0.96 | 12 | 5.6 | 2.40.6 | 2.40.7E+01 | 6.22.4E-06 | I |
| g2 | 1043897 | 0.8679 | -0.6963 | 1.97 | 547 | 33.1 | 5.51.3 | 8.05.7E+02 | 1.03.0E-05 | I |
| g4 | 1042278 | 0.7800 | -0.7395 | 0.77 | 161 | 10.3 | 6.91.9 | 8.98.0E+02 | 9.56.3E-05 | I |
| g5 | 532335 | 0.7062 | 0.4075 | 1.11 | 89 | 4.7 | 6.03.0 | 1.74.4E+03 | 1.21.4E-04 | I |
| g11 | 946558 | 0.5418 | -0.4759 | 0.25 | 152 | 5.0 | 5.22.5 | 0.72.4E+03 | 1.11.2E-04 | I |
| g12 | 992035 | 0.5172 | -0.6569 | 0.00 | 2643 | 9.9 | 2.11.2 | 3.13.4E+01 | 3.47.3E-05 | I |
| g13 | 997790 | 0.4835 | -0.7004 | 1.82 | 4 | 4.7 | 9.91.7 | 3.32.5E+03 | 0.61.0E-03 | I |
| g14 | 1003258 | 0.4771 | -0.7268 | 1.69 | 24 | 4.9 | 7.41.7 | 1.01.3E+03 | 2.71.4E-04 | I |
| g15 | 929122 | 0.4084 | -0.5042 | 0.31 | 45 | 10.3 | 14.34.2 | 1.30.8E+03 | 1.00.4E-03 | I |
| g17 | 764611 | 0.3153 | -0.2010 | 0.66 | 75 | 11.6 | 12.72.6 | 1.00.2E+04 | 1.02.8E-04 | I |
| g18 | 842427 | 0.1667 | -0.4455 | 1.15 | 43 | 19.5 | 14.04.3 | 1.71.0E+04 | 2.11.2E-03 | I |
| g19 | 916902 | 0.0915 | -0.6624 | 6.10 | 45 | 4.4 | 5.51.3 | 2.71.9E+02 | 1.51.4E-04 | I |
| g20 | 906570 | 0.0842 | -0.6415 | 4.54 | 33 | 15.2 | 7.31.3 | 9.37.7E+02 | 2.82.0E-04 | I |
| g21B | 789457 | 359.9695 | -0.4573 | 0.38 | 135 | 23.7 | 23.86.6 | 4.45.5E+04 | 0.51.1E-03 | I |
| g21A | 788629 | 359.9700 | -0.4554 | 0.73 | 7648 | 13.9 | 11.82.5 | 1.10.7E+04 | 0.83.1E-04 | I |
| g22 | 387542 | 359.9386 | 0.1709 | 0.01 | 396 | 8.3 | 4.91.8 | 1.80.9E+03 | 3.25.2E-04 | I |
| g24 | 676294 | 359.9072 | -0.3026 | 0.44 | 50 | 8.6 | 6.32.5 | 2.00.7E+03 | 3.32.4E-04 | I |
| g26 | 523105 | 359.6148 | -0.2438 | 3.63 | 3447 | 0.0 | 7.10.9 | 0.00.0E+00 | 0.00.0E+00 | |
| g28 | 214738 | 359.5701 | 0.2704 | 1.16 | 148 | 4.2 | 4.01.3 | 1.10.8E+02 | 6.06.0E-05 | I |