Ages of M33 Star Clusters Based on the HST/WFPC2 Photometry
Abstract
We present a result of age estimation for star clusters in M33. We obtain color-magnitude diagrams (CMDs) of resolved stars in 242 star clusters from the HST/WFPC2 images. We estimate ages of 100 star clusters among these, by fitting the Padova theoretical isochrones to the observational CMDs. Age distribution of the star clusters shows a dominant peak at . Majority of star clusters are younger than , while ten star clusters are older than . There are few clusters younger than in this study, which is in contrast with the results based on the integrated photometry of star clusters in the previous studies. Radial distribution of the cluster ages shows that young to intermediate-age clusters are found from the center to the outer region, while old clusters are distributed farther from M33 center. We discuss briefly the implication of the results with regard to the formation of M33 cluster system.
1 Introduction
Ages of star clusters in a galaxy are important information for understanding the formation and evolution of star clusters and their host galaxies. In general we estimate ages of star clusters whose stars are resolved by fitting the color-magnitude diagrams (CMDs) of the stars with theoretical isochrones, and ages of unresolved clusters by fitting their integrated photometry or spectra with population synthesis models. Star clusters in the Local Group galaxies are partially resolved into individual stars in the images obtained with the Hubble Space Telescope (HST) so that they play an important role in the study of extragalactic star clusters.
There have been numerous studies that estimated the ages of star clusters in the Local Group galaxies with the photometry of resolved stars in star clusters: for example, LMC (e.g. Mackey et al. (2006) and references therein) and SMC (Glatt et al., 2008), NGC 185, NGC 205 (Sharina et al., 2006), M31 (Rich et al., 2005), and M33 (Sarajedini et al., 2000, 2007).
M33 (NGC 598), Triangulum Galaxy, is a late-spiral galaxy (Scd), and is one of the three spiral galaxies in the Local Group. It is known to have numerous star clusters (see Sarajedini & Mancone (2007); Park & Lee (2007); Zloczewski et al. (2008) and references therein.). It is located at about 900 kpc from us (Galleti et al., 2004) and has a large number of star clusters so that it offers us an excellent opportunity to study the ages of resolved star clusters. At the distance of M33, bright star clusters are easily resolved into stars and even the faint star clusters can be seen with a hint of resolved stars on the images taken with HST/Wide Field and Planetary Camera 2 (WFPC2).
There were several studies on the ages of star clusters in M33. Chandar et al. (1999b, 2001) estimated the ages of M33 star clusters in the catalog of Chandar et al. (1999a, 2001) by comparing the integrated photometry of the star clusters with a simple stellar population (SSP) model in the color-color diagram. Later Chandar et al. (2002) supplemented their age estimates for more M33 star clusters with the spectroscopic data. They found that the age distribution of star clusters in the halo of M33 shows a large age spread, and little progression of abundance with age. They pointed out these properties are consistent with accretion origin for a large fraction of M33 halo but not with monolithic collapse scenario of the halo. From the comparison of globular cluster properties in nearby dwarf galaxies, they claimed M33 halo cluster population might have formed by accretion of lower luminosity dwarf irregular galaxies and dwarf spheroidals rather the ones such as Magellanic clouds. The apparent lack of metallicity gradient among the ten M33 halo cluster samples of Sarajedini et al. (2000) also further supported the accretion scenario.
Ma et al. estimated the ages and metallicity of the M33 star clusters in their series of papers (Ma et al., 2001, 2002a, 2002b, 2002c, 2004a, 2004b). They obtained the integrated spectral energy distribution (SED) of star clusters from the photometry using the Beijing-Arizona-Taipei-Connecticut (BATC) system with 13 narrow band filters. They fitted the SEDs with the SSP model to simultaneously determine the age and metallicity of star clusters. They showed that their age estimations for star cluster samples from Chandar et al. (1999a, 2001) are consistent with previous estimates. Using the age estimates of M33 clusters given by Ma et al., Sarajedini & Mancone (2007) showed that the number of clusters in the age distribution appears to decline with age with no obvious breaks or abrupt changes, being fit well by a single power law.
Sarajedini et al. (2000) estimated ages of ten resolved globular clusters in M33 using the isochrone fitting technique to the deep CMDs of resolved stars derived from the HST/WFPC2 images. They estimated the metallicity from the slope of red giant branch, and found that M33 star clusters show a significant second parameter effect. They concluded from this result that these star clusters might be several Gyrs younger than the Galactic globular clusters if the second parameter is the age. Chandar et al. (2006) estimated the age of a globular cluster, C38 in the list of Christian & Schommer (1982), to be 2-5 Gyrs old, utilizing the integrated spectrum and the resolved member star CMD. Sarajedini et al. (2007) found 24 star clusters from the deep images of two HST/Advanced Camera for Survey (ACS) fields in M33, and derived ages for 20 of them by fitting theoretical isochrones to the features on the CMDs of resolved stars including the main-sequence turnoffs (MSTO). The derived ages of the star clusters range from to . Recently Stonkute et al. (2008) derived an age of Gyr, for one extended cluster at the outer edge of M33, using the CMD of the resolved stars. Zloczewski & Kaluzny (2009) also estimated ages of four M33 star clusters by fitting isochrones to the member star CMD derived from HST/ACS images.
Park & Lee (2007) compiled a comprehensive catalog of 242 star clusters in M33 identified from the HST image data. Along with 32 new star clusters detected from 24 HST/WFPC2 fields, they combined several previous M33 star catalogs (Bedin et al., 2005; Chandar et al., 1999a, 2001; Sarajedini et al., 2007) obtained with HST data only, thus to ensure that the resulting master catalog contains only the confirmed star clusters. This catalog offers a good sample of star clusters for age studies.
As part of our project on studying star clusters in M33, we derived photometry of the resolved stars in and around the star clusters from the HST/WFPC2 images that contain M33 star clusters listed in Park & Lee (2007). We estimated ages of 100 star clusters in M33 using the resulting CMDs of resolved stars.
Section 2 describes the HST/WFPC2 data used in this study, and the data reduction procedures. Section 3 present the CMDs of M33 star clusters, and the estimates of cluster ages. In Section 4, we describe the age distribution of M33 star clusters thus derived, together with their integrated photometric parameters and their radial distributions from the center of M33. In Section 5 we discuss differences among the age estimations for M33 star clusters, and the implications of the results with regard to the formation of M33 cluster system. Finally, summary and conclusion are given in Section 6.
Throughout this paper, we will refer to the star clusters according to IDs in the catalog of Park & Lee (2007). For cross-identifications, we will refer to the star clusters from the catalog of Bedin et al. (2005) with B designation, and ones from Chandar et al. (1999a, 2001) with CBF. CS designation means the star clusters from Christian & Schommer (1982), MKKSS designation means the ones from Mochejska et al. (1998), MD the ones from Melnick & D’Odorico (1978), and SBGHS designation means the star clusters from Sarajedini et al. (2007). Note Sarajedini & Mancone (2007) compiled all published lists of M33 star clusters to build a comprehensive catalog which is being maintained on-line111 http://www.astro.ufl.edu/{̃}ata/cgi-bin/m33_cluster_catalog/index.cgi. For reference, we included their catalog IDs with SM designation.
2 Data & Data Reduction
We used HST/WFPC2 images of M33 fields available in the HST archive. These HST/WFPC2 image sets include the 20 fields listed in Table 1 of Chandar et al. (1999a), 35 fields listed in Table 1 of Chandar et al. (2001), and 24 fields listed in Table 1 in Park & Lee (2007).
We derived the magnitudes of the point sources in the images using HSTphot (Dolphin, 2000a) that is designed for the point spread function (PSF) fitting photometry of point sources in the WFPC2 images. HSTphot uses a library of TinyTim PSF for PSF fitting. Individual images were all coadded with utility program included in HSTphot. HSTphot produces instrumental magnitudes as well as standard magnitudes calibrated with Holtzman et al. (1995)’s relation and zeropoints from Dolphin (2000b) after it automatically applies the correction for Charge Transfer Efficiency (CTE) (Dolphin, 2000b). Since HSTphot only calibrates the instrumental magnitudes of widely used filters, we used only the images obtained with (B), (V), (V), and (I). The resultant photometry data turn out to have small photometric error. Fig. 1 shows that resultant data have photometric errors smaller than at mag even for about 200 sec long image, and as for the data from exposures longer than 1000 sec, the errors get larger than only for .
3 Results
3.1 Age Estimation
Apparent sizes of the star clusters in the images are in most cases, and as large as for some cases with long exposures. We construct the CMDs of resolved stars in cluster-centric radii from to varying on the sizes of the clusters, which are listed in the fifth column of Table 1. To minimize the field star contamination, the CMDs of field stars were compared with those of member stars around each star cluster. Field stars were selected in the annulus of which the inner radius is and of the same area as the member star selection circle.
Since HST/WFPC2 data used in this study were obtained from various observational projects, the depths of the images are not homogeneous. Thus, it happened that a star cluster observed on more than one field in our image sets resulted in different individual star detection on each appearance. In such a case, we used the CMD that has the largest number of detected stars for the analysis.
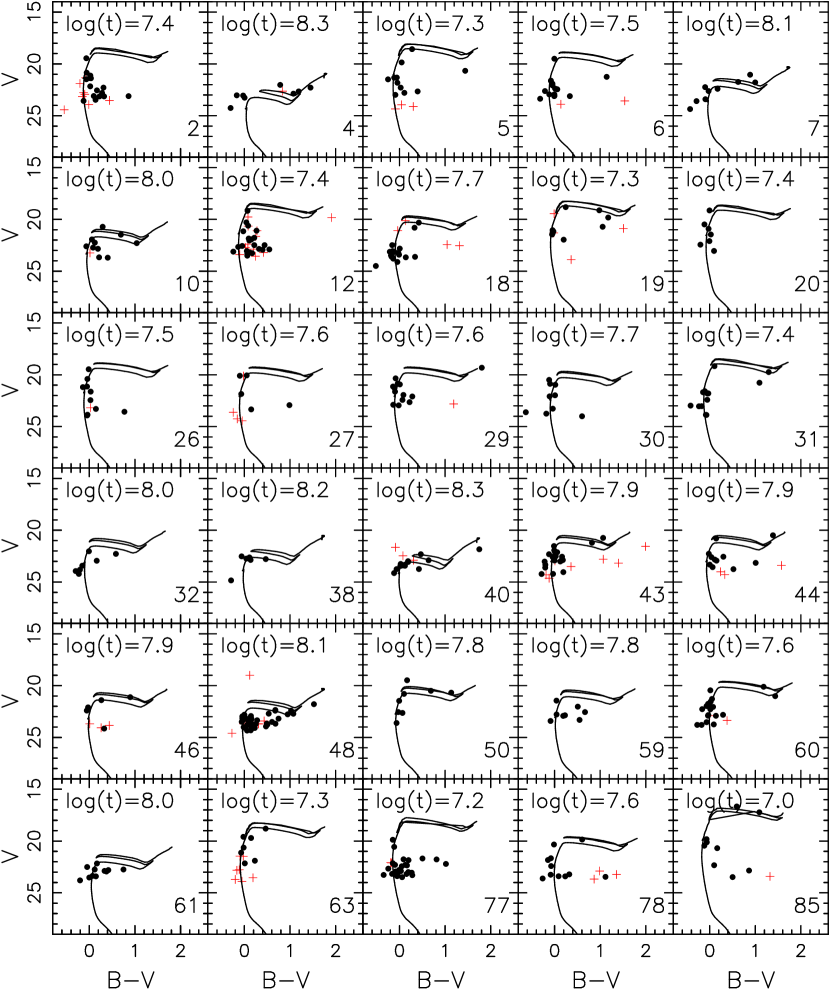
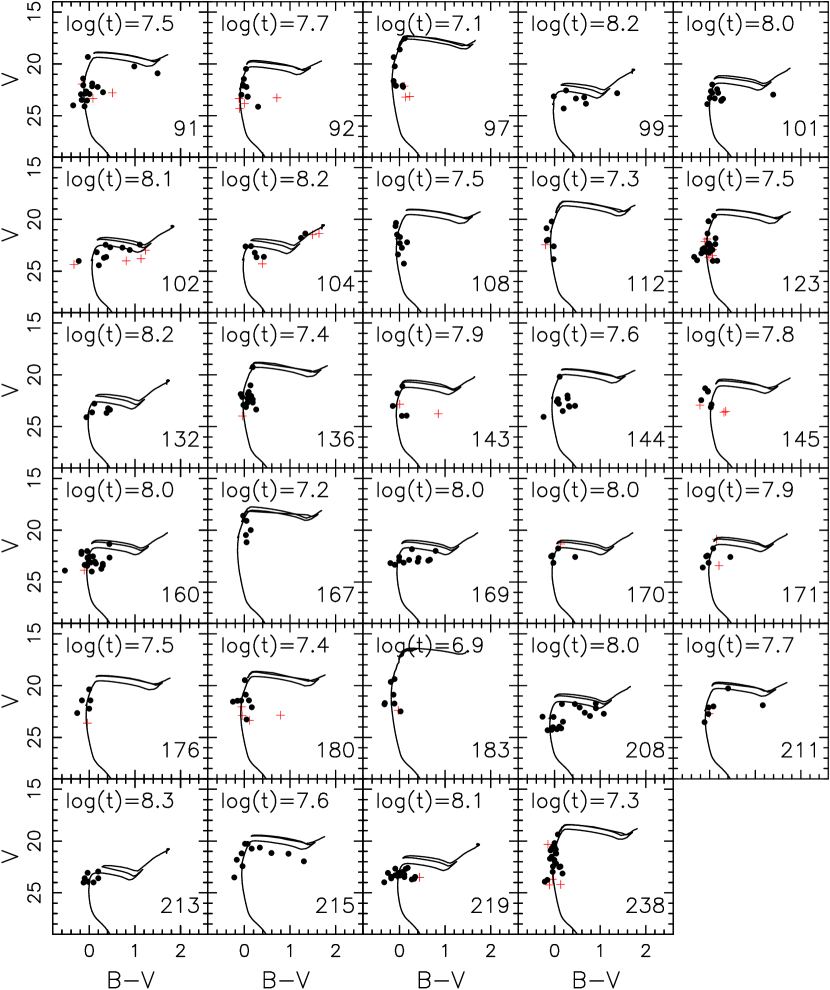
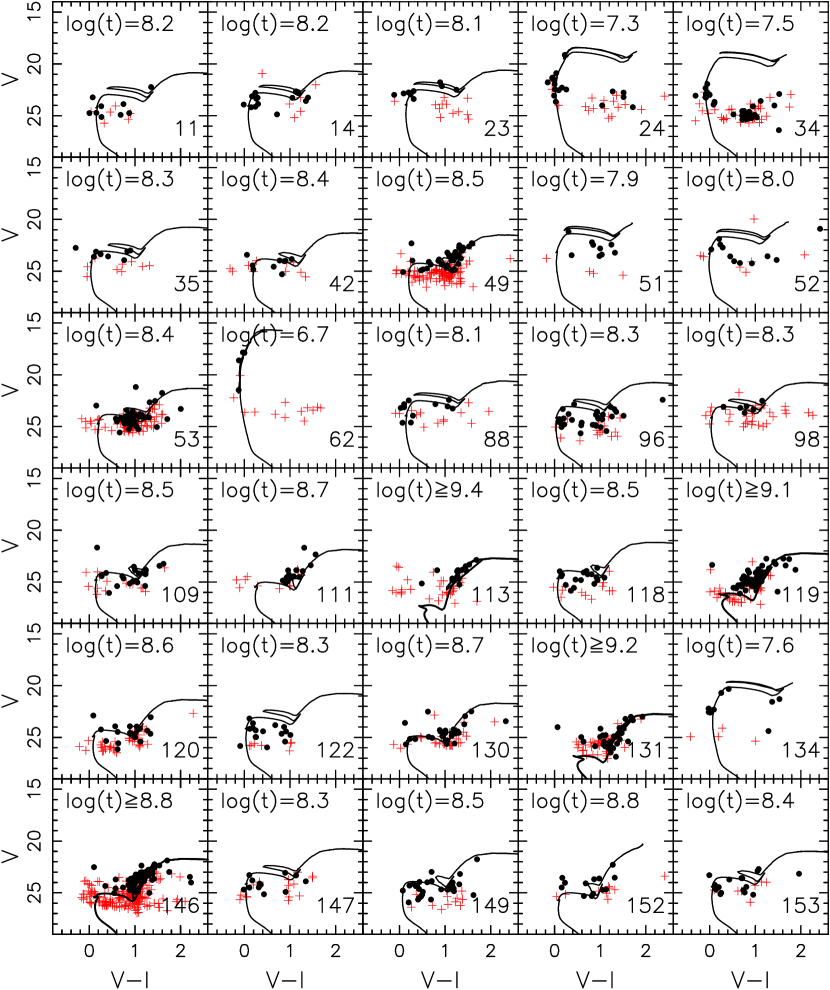
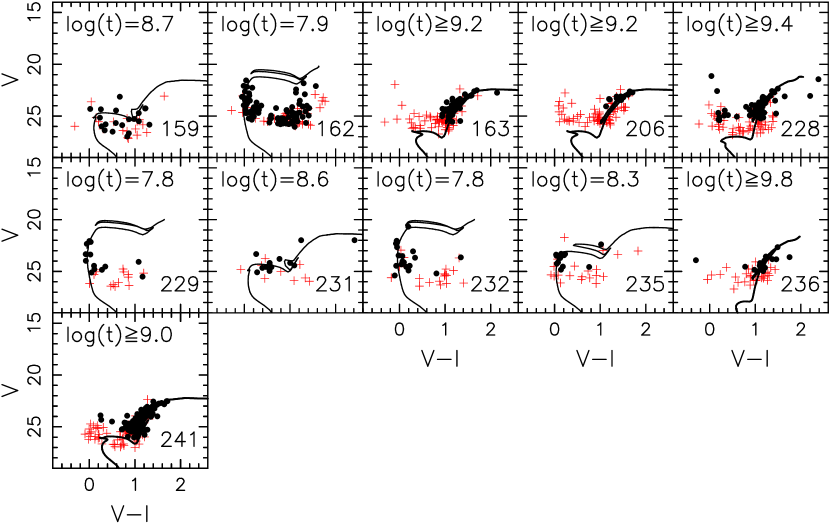
Fig. 2 displays the CMDs of resolved stars in 100 star clusters thus derived. Some CMDs include only a few resolved stars. Nevertheless they show features that can be used for age estimation such as bright MS in young star clusters. The most reliable age determination of star cluster can be made with the location of the MSTO. We regarded the position of the brightest MS star as MSTO for young star clusters. However, even the deepest image set among these could not reveal the positions of the MSTO for old star clusters. In those cases, we had to rely on the RGB feature which is not sensitive to the age. Therefore, we estimated only the lower age limits of the star clusters by fitting the isochrones to the observed part of the RGB.
We used the theoretical isochrones in the Padova models (Girardi et al., 2002) to estimate the age of each star cluster. Chandar et al. (1999b) reported that metallicities of their 60 star clusters span a large range from to , and that their young cluster samples can be well represented by the model, while there is a distinct turnoff to lower metallicity() around . Accordingly, we used the model for for star clusters that turned out to have mainly blue or intermediate color stars and few red stars. As for the old star clusters whose detected members are mainly RGB stars, we used either model of or , whichever metallicity could fit the RGB better. We used the reddening values given in the Park & Lee (2007) for isochrone fitting for each star cluster.
We adopted as the distance to M33, 910 kpc () given by Kim et al. (2002). Note there is a good summary of recent estimates of the distance to M33 obtained in various ways given by (Galleti et al., 2004). Kim et al. (2002) estimated the distance to M33 using the -band magnitude of the tip of red giant branch (TRGB) of field stars (Lee et al., 1993). During this study, we visually checked that the -band magnitude of TRGB for M33 field stars in our images is indeed close to their estimation. Therefore we adopted their result as the distance to M33.
Isochrones were fitted visually, and the upper and lower age limits of a star cluster were also estimated visually. Table 1 lists the ages of the M33 star clusters we derived, along with metallicities and the reddening values used.
3.2 Age distribution
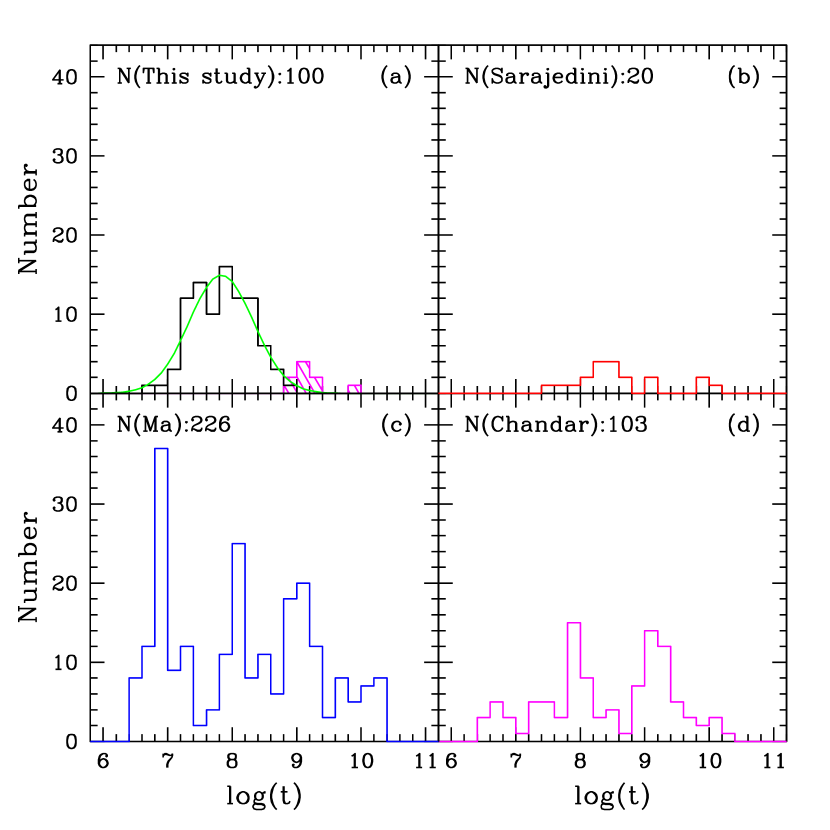
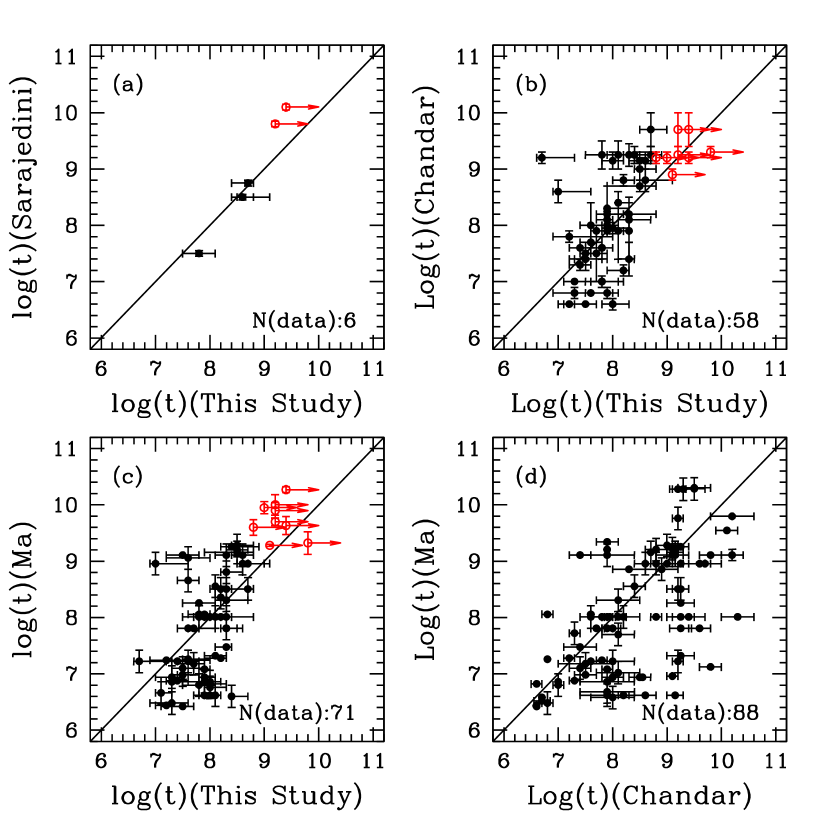
Fig. 6 shows the age distribution for 100 clusters including the ten star clusters with lower age limit only, in comparison with those in previous studies: (a) Chandar sample for 103 star clusters from Chandar et al. (1999b, 2002) who used integrated photometry for age estimation, (b) Ma sample for 226 star clusters from Ma et al. (2001, 2002a, 2002b, 2002c, 2004a, 2004b) who also used integrated photometry for age estimation, and (c) Sarajedini sample for 20 star clusters from Sarajedini et al. (2007) who used the CMD of the resolved stars in clusters for age estimation.
The age distribution of star clusters in this study shows a broad distribution with a peak at , and a small number of star clusters older than . The broad component can be fit well with a Gaussian with the peak age at and the width of . Thus a majority of the clusters in this study are young to intermediate-age and a small number of the clusters are older than about one Gyr. It is noted that there is only one star cluster younger than in the our sample, while the Ma sample shows a large component of young clusters with a peak at and the Chandar sample shows a small component of young clusters with a peak at .
Due to the different depths of HST/WFPC2 images used in this study, it is not easy to estimate the completeness of the age sample. However, we note that the isochrone fitting method used in this study has a bias such that bright, large sparse star clusters are likely to be included more than faint compact ones in the final age sample.
3.3 Integrated color-magnitude diagram
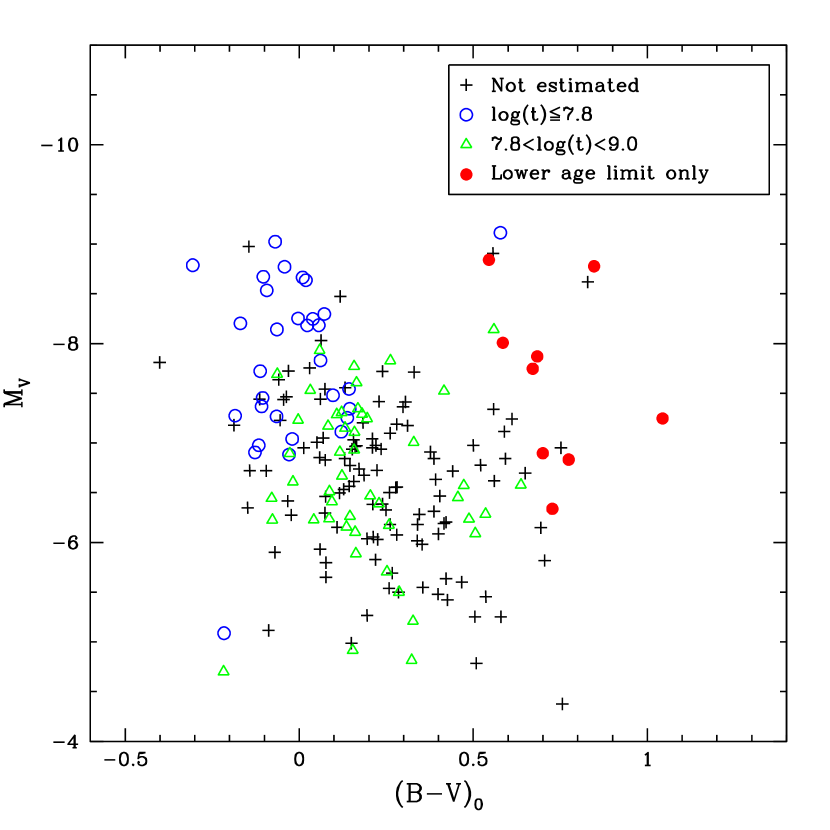
Fig. 7 displays the CMD of integrated photometry for 242 star clusters in M33 from Park & Lee (2007), along with the information of age derived in this study. In general, the age and integrated magnitude/color show consistent behaviors on the CMD. Old star clusters with have colors and magnitudes , which are similar to those of the Milky Way globular clusters (MWGCs), and . Therefore, these old star clusters can be regarded as being analogous to the MWGCs.
One notable star cluster is cluster ID 85 (= MKKSS-27, SM-261), with and . It is the brightest in the sample. These values are typical magnitude and color of an old globular cluster. Chandar et al. (2002) estimated its age to be from integrated photometry, or 2-5 Gyrs from spectroscopy. We obtained PSF photometry of ten stars around this star cluster. Summing the magnitudes of these ten stars, we derive the total magnitude and color and . These values are very similar to those from aperture photometry, and (Park & Lee, 2007). Therefore we regarded PSF photometry recovered most of bright member stars in this cluster. The HST/WFPC2 images of the field including this cluster and the CMD of this cluster show that there are two very bright red stars. The spatial locations of these red stars in the cluster indicate that they are probably member stars, and their locations on the CMD show that they are red supergiant stars. The fluxes of these stars contribute to most of the integrated light of the star cluster. If we remove the light contribution of these two red supergiant stars, we get the integrated photometry of , and . This shows that this cluster is much younger than the age derived from the case including the two stars. We estimated the age of this star cluster to be , which is much younger than previous estimations. This case clearly shows the power of age estimation with resolved star CMD over those based on integrated light.
Intermediate-age star clusters () occupy the intermediate color region in the CMD. It is interesting to note that their integrated magnitude range is quite fainter than those of younger star clusters or of older red star clusters. On the other hand, star clusters younger than have bright young stars whose fluxes contribute the majority of total star cluster light. These stars are bright main sequence stars or supergiants. Consequently, young star clusters are located in the bright, blue regions on integrated CMD.
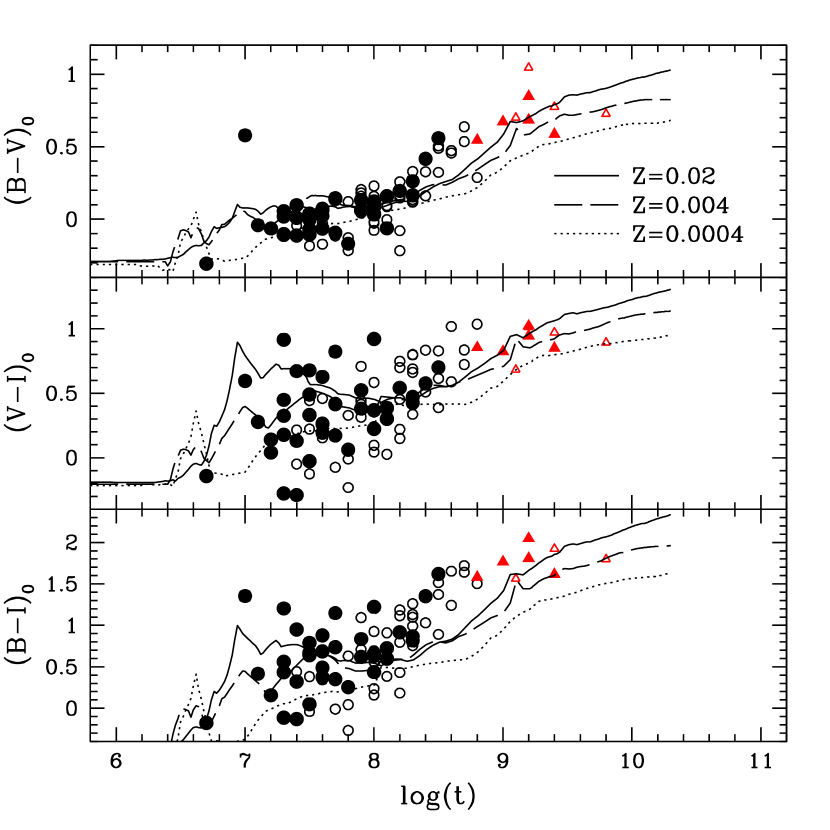
Since the ages in this study were derived in an independent way from using the integrated color of the star clusters, more insight to star cluster properties can be obtained by comparing the ages and the integrated colors of the star clusters. Fig. 8 displays the integrated color versus age diagram. We plotted also the theoretical relations derived from single stellar population models of Bruzual & Charlot (2003), for , 0.004 and 0.0004. The figure shows that the integrated colors of the M33 clusters increase slowly as the age increases, approximately consistent with the theoretical curves. and colors of the young clusters show a large scatter for young star clusters, while their colors show a small scatter around the theoretical curves. It is suspected that this may be due to the large uncertainty in the -band photometry of the clusters. It is needed to obtain better integrated photometry in the -band.
3.4 Radial distribution
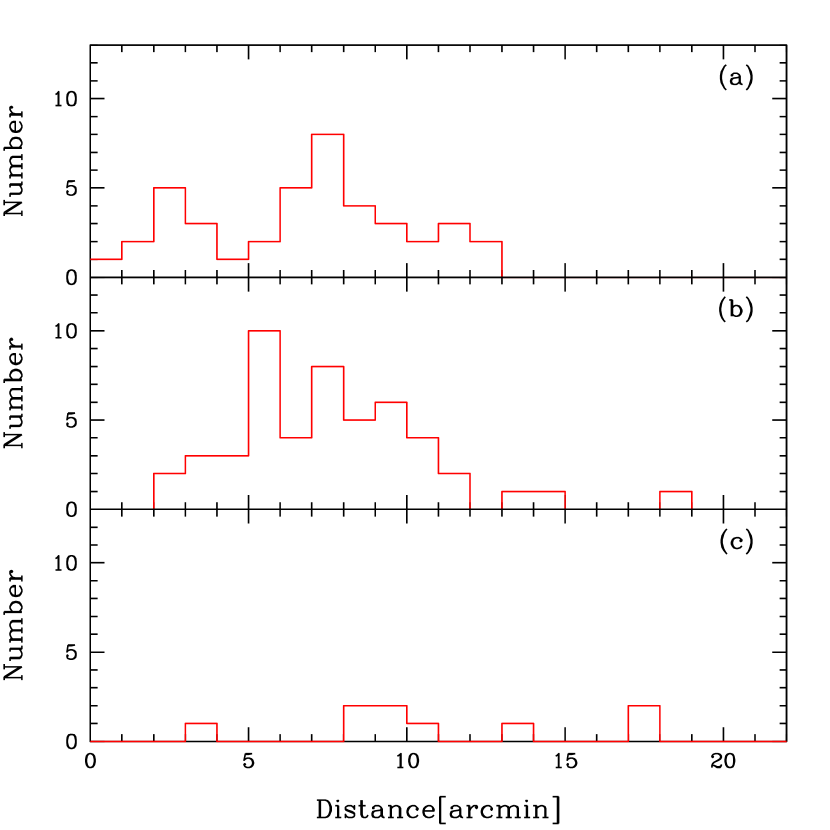
With 100 star cluster samples of known ages in hand, we investigated their radial distribution around M33. With consideration of their integrated colors and the age distribution shown in Fig. 6, we divided the star clusters into three age groups: (1) young star clusters with , (2) intermediate-age star clusters with , and (3) old star clusters with . The boundary value of divides the young population in half seen in Fig. 6, and this age corresponds to the color .
Fig. 9 shows the number of the clusters as a function of the projected radial distance from the center of M33 (1:33:50.9, 30:39:35.8, (Skrutskie et al., 2006)). Although it is not easy to investigate with small number of samples, there exists a tendency that older star clusters are distributed in a wider area than the young star clusters in M33. Only young star clusters are found in the region close to the M33 center, whereas only intermediate-age and old star clusters are found in the outside region. This is consistent with the finding by Sarajedini & Mancone (2007) who used the age estimates derived from integrated photometry.
4 Discussions
4.1 Comparison with other studies
Sarajedini et al. (2007) estimated the ages of 20 star clusters by fitting isochrones to the stellar photometry data derived from HST/ACS images. Sarajedini et al. (2007)’s photometry is deep enough to reach the MSTO for most of their target star clusters. There are six star clusters with age estimates common between this study and Sarajedini et al. (2007)’s: Clusters ID 120 (CBF-110, SM-103), 130 (CBF-108, SM-127), 131(CBF-106, SM-130), 228 (CBF-70, SM-402), 231 (CBF-79, SM-409), and 232 (CBF-78, SM-410). Fig. 10 displays the comparison of two age estimates for these star clusters. The age estimates show a good agreement with Sarajedini et al. (2007)’s for four clusters. We derived only the lower age limits for two clusters: for ID 228 and for ID 131, while Sarajedini et al. (2007) derived and , respectively.
Age estimation of M33 star clusters with integrated photometry was carried out by Chandar et al. (1999b, 2002) for most of their 154 star cluster samples. Chandar et al. (2002) obtained ages for additional 14 star clusters from the catalog of Mochejska et al. (1998) with the same method as in Chandar et al. (1999b), in addition to revising the age estimates for some clusters with spectroscopy. There are 58 star clusters with age estimates common between theirs and this study. Fig. 10(b) shows that both age estimations agree within the error of measurements for many of star clusters. But our age estimates for star clusters of are younger than theirs in general. On the other hand, there are considerable differences for young clusters such that our estimates are mostly , while theirs are .
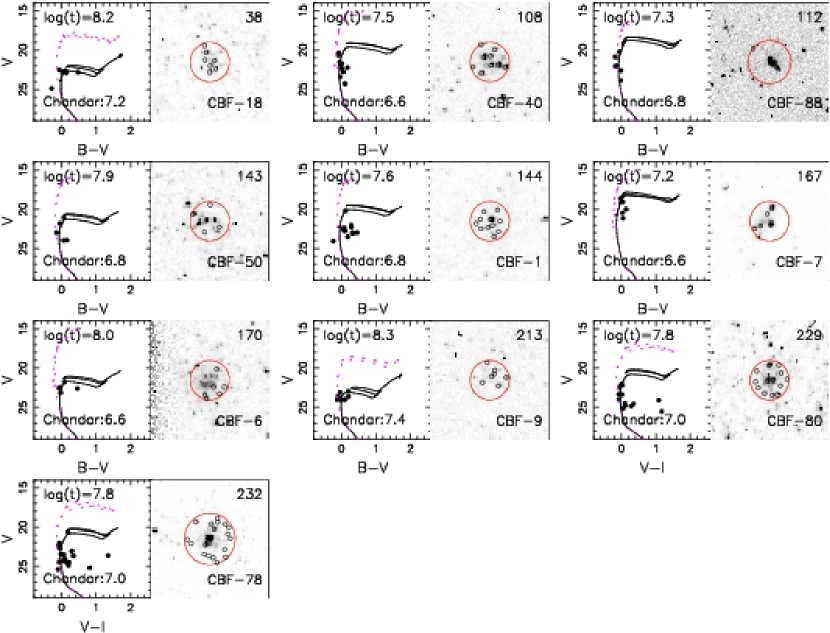
We carefully examined the star clusters for which our age estimates are much different from Chandar et al. (1999b, 2002). Fig. 11 shows the CMDs of ten young star clusters that have large age differences. To compare the age estimations, we plotted the Padova isochrones for both age estimates on each CMD. -band grayscale images of the star clusters are also displayed to show the spatial distribution of detected stars. It is seen that there are some very bright stars that were not detected by HSTphot in clusters ID 143 and 232 (SM-168 and SM-410, respectively).They might have led to younger age estimation of star clusters had they been detected and measured. There are some undetected stars in cluster ID 170 (SM-220), but they look like faint stars. Except for above three star clusters, it seems that HSTphot detected all bright stars in the region of each star cluster. Their resolved star CMDs are more consistent with isochrones for our age estimates than those for their estimates. In short, seven out of ten star clusters show features that are more consistent with our age estimations than with theirs. Therefore, we argue that our age estimations are more reliable than those by Chandar et al. (2002) for most of star clusters with a large discrepancies in the age estimations.
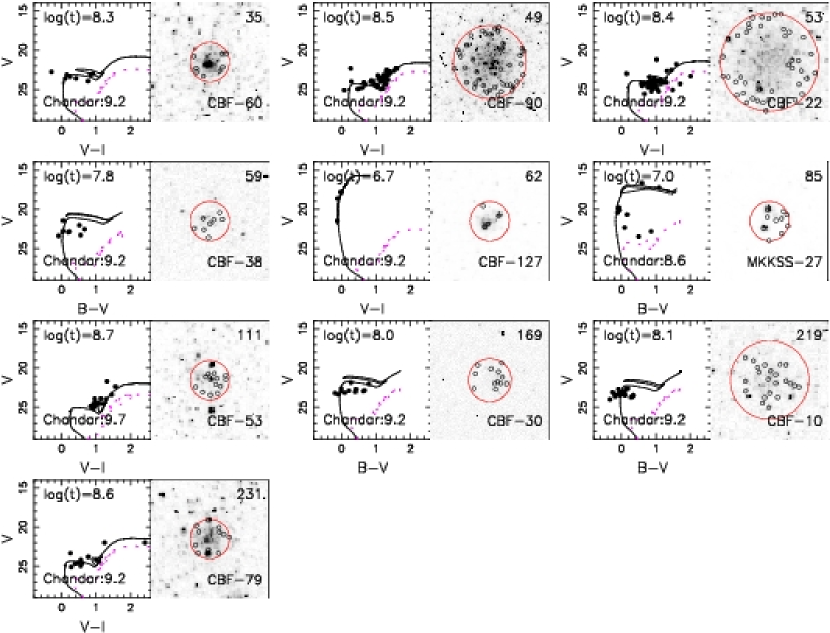
There is also considerable amount of age discrepancies for some older star clusters: our age estimates are , while Chandar et al. (2002) estimated their ages to be much older. The CMDs and grayscale images of these star clusters are shown in Fig. 12. Clusters ID 49, 53, 111, and 231 (SM-45, SM-95, SM-110, and SM-409, respectively).turn out to have only red star sequences in their resolved star CMDs. It is difficult to derive reliable ages for these clusters just with RGB features.
But for other star clusters, we noted that there are some blue stars whose colors ( or ) are , with their magnitude errors smaller than 0.2. Most of these stars are located in the very central region of the star clusters. Therefore, we regard these as blue main sequence member stars. If they are indeed the member stars of the cluster, Chandar et al. (2002) might have overestimated the ages of these star clusters. Note that Chandar et al. (1999b) estimated from the integrated photometry the ages() of clusters ID 35, 59, 169 and 219 (SM-68, SM-146, SM-219, and SM-377, respectively) to be , , , and , respectively, which are very close to our estimates: , , , and .
We also compared our age estimates of the star clusters with the results obtained in a series of papers by Ma et al. (2001, 2002a, 2002b, 2002c, 2004a, 2004b), as shown in Fig. 10(c). There are 71 star clusters common between both studies. For star clusters older than , our age estimates are in general younger than their estimates except for a few star clusters. As for the star clusters of , it turned out that our age estimates are much older than their estimates, basically the same tendency as those with Chandar et al. (1999b, 2002) with larger differences. We note they obtained colors to be bluer than Chandar et al. (1999a) for the same clusters (Ma et al., 2001). It seems that large seeing condition () and large aperture () used in their photometry caused light contamination from neighboring blue disk stars in M33, thus leading to younger age estimation even compared with those of Chandar et al.. This can be seen in Fig. 10(d) where age estimates by Ma et al. and Chandar et al. are compared. Although many of age estimates are in good agreement between them over a wide age range, quite a number of star clusters show large differences, For almost all of such star clusters, Chandar et al.’s estimates are older than those by Ma et al..
Sarajedini & Mancone (2007) compiled the data in the eight previous catalogs of M33 star cluster and built a new catalog of 451 star cluster candidates in M33, of which 255 are star clusters confirmed with HST images. Since their age estimation is based on the results by Ma et al., we do not show the result here but refer to Fig. 10(c) for the age comparison between ours and theirs.
These comparisons indicate that the estimated ages for some star clusters in this study have uncertainties due to the possible inclusion of non-member M33 field stars. This is true to both integrated photometry or PSF photometry of resolved stars. However, the effect of non member star selection can be reduced in resolved star photometry since the contribution of individual stars can be evaluated. For example, CMD of stars near star cluster center, and those of control field are compared to minimize the field star contamination. Although PSF photometry could not detect some bright stars in the cluster region, we argue that our age estimations for star clusters based on the isochrone fitting are more accurate than other age estimations based on the integrated light of the star clusters.
The resultant age distribution shows that there is only one star cluster which is younger than , as shown in Fig. 6(a). It might be that there are indeed few young star clusters in M33. However, M33 is a late spiral galaxy, in which signatures for active star formation are clearly seen in a number of giant HII regions such as NGC 604 or NGC 595 on its disk. Far infrared observation indicates M33 is more actively forming stars (with star formation rate /year) than either our Galaxy or M31 (Hippelein et al., 2003). Therefore it is unlikely that M33 lacks very young star clusters. In fact, the presence of very young clusters that are 3–5 Myrs old was reported in NGC 604 (Hunter et al., 1996). Such young clusters normally are embedded in nebulous environments, which makes it difficult to be detected with visual investigation.
4.2 Formation of old star clusters
The interaction between galaxies is known to often trigger the formation of stars and star clusters. For example, a large population of young bright star clusters in the interacting galaxy pair of NGC 4038/4039 (Antennae galaxies) are believed to be involved with the interaction of their host galaxies (Whitmore et al., 1999) . Lee & Lee (2005) suggested that the intermediate-color clusters in the interacting galaxy NGC 1487 were probably formed during the merging process. Lee et al. (2005) found out that the age distribution of the star clusters in NGC 5194 shows a broad peak that is consistent with the crossing times of the companion galaxy NGC 5195 through NGC 5194 disk. These results indicate that the age distribution is consistent with the scenario that the interaction between two galaxies directly caused an increase in cluster formation rate.
In the case of M33, the spatial distribution of halo stars shows no sign of disturbance (Ferguson et al., 2006). However, HI surveys around M33 revealed an HI bridge between M31 and M33 (Braun & Thilker, 2004), and the outer HI gas disk of M33 is found to be skewed towards the M31 direction (Corbelli & Schneider, 1997). From the model simulation, Bekki (2008) suggested the tidal interaction between M31 and M33 about 4-8 Gyrs ago can explain the HI bridge and the observed HI warp in M33. There are ten old star clusters with lower age limits of in our sample. While we cannot estimate their exact ages with out data, previous studies on some of these clusters suggested that they are several Gyrs younger than Galactic globular clusters (see Sarajedini et al. (2000); Chandar et al. (2006); Zloczewski & Kaluzny (2009)). If the peak for the age distribution of these old star clusters are found to be similar to the epoch of the interaction, it might be possible that the galaxy interaction with M31 had triggered the formation of old star clusters in M33. We note that Huxor et al. (2009) suggested the possibility that the tidal interaction between M31 and M33 have affected the spatial distribution of M33 globular clusters at large galactocentric distances.
However, the small number of old star cluster samples prevents any definite conclusion on the picture of their formation. Further studies with more sample with good age estimation are needed to investigate in detail the formation of M33 star cluster system.
5 Summary and Conclusion
We present photometry of the resolved stars in star clusters on the HST/WFPC2 images of 79 fields in M33. Most star clusters in M33 are resolved into individual stars on the HST/WFPC2 images. We estimate the ages of 100 star clusters matching the CMDs of resolved stars with Padova theoretical isochrones.
The age estimates for the star clusters in this study show a broad distribution from to with a peak at . There are also a small number old star clusters with lower age limits of . It is found out that there are few clusters younger than in this study.
Previous estimates (Chandar et al., 1999b, 2002; Ma et al., 2001, 2002a, 2002b, 2002c, 2004a, 2004b) for some young star clusters show a difference from our estimates. Close inspection of the CMDs and images of each star cluster reveals that previous estimations with integrated light underestimated the ages for about 80% of young star clusters that have significant differences among the age estimations.
Age distribution along the galactocentric distance reveals that there is a hint that blue young star clusters show a stronger concentration toward the M33 center than older star clusters. The interaction between M31 and M33 might affect the formation and spatial distribution of old star clusters in M33.
References
- Bedin et al. (2005) Bedin, L. R., Piotto, G., Baume, G., Momany, Y., Carraro, G., Anderson, J., Messineo, M., & Ortolani, S. 2005, A&A, 444, 831
- Bekki (2008) Bekki, K. 2008, MNRAS, 390, L24
- Braun & Thilker (2004) Braun, R., & Thilker, D. A. 2004, A&A, 417, 421
- Bruzual & Charlot (2003) Bruzual, G., & Charlot, S. 2003, MNRAS, 344, 1000
- Chandar et al. (1999a) Chandar, R., Bianchi, L., & Ford, H. C. 1999a, ApJS, 122, 431
- Chandar et al. (1999b) Chandar, R., Bianchi, L., & Ford, H. C. 1999b, ApJ, 517, 668
- Chandar et al. (2001) Chandar, R., Bianchi, L., & Ford, H. C. 2001, A&A, 366, 498
- Chandar et al. (2002) Chandar, R., Bianchi, L., Ford, H. C. & Sarajedini, A. 2002, ApJ, 564, 712
- Chandar et al. (2006) Chandar, R., Puzia, T. H., Sarajedini, A., & Goudfrooij, P. 2006, ApJ, 646, L107
- Christian & Schommer (1982) Christian, C. A., & Schommer, R. A. 1982, ApJS, 49, 405
- Corbelli & Schneider (1997) Corbelli, E., & Schneider, S. E. 1997, ApJ, 479, 244
- Dolphin (2000a) Dolphin, A. E. 2000a, PASP, 112, 1383
- Dolphin (2000b) Dolphin, A. E. 2000b, PASP, 112, 1397
- Ferguson et al. (2006) Ferguson, A. M. N., Chapman, S., Ibata, R., Irwin, M., Lewis, G., & McConnachie, A. 2006, in Planetary nebulae beyond the Milky Way, ed. L. Stanghellini, J. R. Walsh, & N.G. Douglas (Berlin:Springer), 286
- Galleti et al. (2004) Galleti, S., Bellazzini, M., & Ferraro, F. R. 2004, A&A, 423, 925
- Girardi et al. (2002) Girardi, L., Bertelli, G., Bressan, A., Chiosi, C., Groenewegen, M. A. T., Marigo, P., Salasnich, B., & Weiss, A. 2002, A&A, 391, 195
- Glatt et al. (2008) Glatt, K., et al. 2008, AJ, 135, 1106
- Hippelein et al. (2003) Hippelein, H., Haas, M., Tuffs, R. J., Lemke, D., Stickel, M., Klaas, U., Völk, H. J. 2003, A&A, 407, 137
- Holtzman et al. (1995) Holtzman, J. A., Burrows, C. J., Casertano, S., Hester, J. J., Trauger, J. T., Watson, A. M., & Worthey, G. 1995, PASP, 107, 1065
- Hunter et al. (1996) Hunter, D. A., Baum, W. A., O’Neil, E. J., Jr., & Lynds, R. 1996, ApJ, 456, 174
- Huxor et al. (2009) Huxor, A., Ferguson, A. M. N., Barker, M. K., Tanvir, N. R., Irwin, M. J., Chapman, S. C., Ibata, R., & Lewis, G. 2009, arXiv:0904.1494
- Kim et al. (2002) Kim, M., Kim, E., Lee, M. G., Sarajedini, A., & Geisler, D. 2002, AJ, 123, 244
- Lee et al. (1993) Lee, M. G., Freedman, W. L., & Madore, B. F. 1993, ApJ, 417, 553
- Lee & Lee (2005) Lee, H. J., & Lee, M. G. 2005, JKAS, 38, 345
- Lee et al. (2005) Lee, M. G., Chandar, R., & Whitmore, B. C. 2005, AJ, 130, 2128
- Ma et al. (2001) Ma, J., Zhou, X., Kong, X., Wu, H., Chen, J., Jiang, Z., Zhu, J., & Xue, S. 2001, AJ, 122, 1796
- Ma et al. (2002a) Ma, J., Zhou, X., Chen, J., Wu, H., Jiang, Z., Xue, S., & Zhu, J. 2002a, A&A, 385, 404
- Ma et al. (2002b) Ma, J., Zhou, X., Chen, J., Wu, H., Jiang, Z., Xue, S., & Zhu, J. 2002b, AJ, 123, 3141
- Ma et al. (2002c) Ma, J., Zhou, X., Chen, J., Wu, H., Kong, X., Jiang, Z., Zhu, J., & Xue, S. 2002c, Acta Astron., 52, 453
- Ma et al. (2002d) Ma, J., Zhou, X., Chen, J., Wu, H., Jiang, Z., Xue, S., & Zue, J. 2002d, Chinese J. Astron. Astrophys., 2, 197
- Ma et al. (2004a) Ma, J., Zhou, X., & Chen, J. 2004a, Chinese J. Astron. Astrophys., 4, 125
- Ma et al. (2004b) Ma, J., Zhou, X., & Chen, J. 2004b, A&A, 413, 563
- Mackey et al. (2006) Mackey, A. D., Payne, M. J., & Gilmore, G. F. 2006, MNRAS, 369, 921
- Melnick & D’Odorico (1978) Melnick, J., & D’Odorico, S. 1978, A&AS, 34, 249
- Mochejska et al. (1998) Mochejska, B. J., Kaluzny, J., Krockenberger, M., Sasselov, D. D., & Stanek, K. Z. 1998, Acta Astron., 48, 455
- Park & Lee (2007) Park, W. -K., & Lee, M. G. 2007, AJ, 134, 2168
- Rich et al. (2005) Rich, R. M., Corsi, C. E., Cacciari, C., Federici, L., Fusi Pecci, F., Djorgovski, S. G., & Freedman, W. L. 2005, AJ, 129, 2670
- Sarajedini et al. (2000) Sarajedini, A., Geisler, D., Schommer, R., & Harding, P. 2000, AJ, 120, 2437
- Sarajedini et al. (2007) Sarajedini, A., Barker, M. K., Geisler, D., Harding, P., & Schommer, R. 2007, AJ, 133, 290
- Sarajedini & Mancone (2007) Sarajedini, A., & Mancone, C. L. 2007, AJ, 134, 447
- Schlegel et al. (1998) Schlegel, D. J., Finkbeiner, D. P., & Davis, M. 1998, ApJ, 500, 525
- Sharina et al. (2006) Sharina, M. E., Afanasiev, V. L., & Puzia, T. H. 2006, MNRAS, 372, 1259
- Skrutskie et al. (2006) Skrutskie, M. F., et al. 2006, AJ, 131, 1163
- Stonkute et al. (2008) Stonkute, R., et al. 2008, AJ, 135, 1482
- Whitmore et al. (1999) Whitmore, B. C., Zhang, Q., Leitherer, C., Fall, S. M., Schweizer, F., Miller, B. W. 1999, AJ, 118, 1551
- Zloczewski et al. (2008) Zloczewski, K., Kaluzny, J., & Hartman, J. 2008, Acta Astron., 58, 23
- Zloczewski & Kaluzny (2009) Zloczewski, K., & Kaluzny, J. 2009, Acta Astron., 59, 47

| IDaaTaken from Park & Lee (2007) | Z | aaTaken from Park & Lee (2007) | r(arcsec) | Cross identificationbbB identifications are from Bedin et al. (2005); CBF identifications from Chandar et al. (1999a, 2001); CS identification from Christian & Schommer (1982); MKKSS identifications from Mochejska et al. (1998); MD identifications are from Melnick & D’Odorico (1978); SBGHS identifications from Sarajedini et al. (2007); and SM identifications from Sarajedini & Mancone (2007) | |
|---|---|---|---|---|---|
| 101 | 0.004 | CS-U70, SM-342 | |||
| 102 | 0.004 | CS-C33, MD-36, MKKSS-45, SM-351 | |||
| 104 | 0.004 | CBF-154, CS-H19, SM-355 | |||
| 108 | 0.004 | CBF-40, SM-35 | |||
| 109 | 0.004 | CBF-86, CS-U140, SM-40 | |||
| 111 | 0.004 | CBF-53, SM-45 | |||
| 112 | 0.004 | CBF-88, SM-47 | |||
| 113 | 0.004 | CBF-54, CS-U137, MD-8, SM-49 | |||
| 118 | 0.004 | CBF-111, SM-100 | |||
| 119 | 0.004 | CBF-114, CS-C38, MD-11, SM-102 |
Note. — The complete version of this table is in the electronic edition of the Journal. The printed edition contains only a sample.