ESTIMATION FOR A PARTIAL-LINEAR
SINGLE-INDEX MODEL
Jane-Ling Wang1, Liugen Xue2, Lixing Zhu3, and Yun Sam Chong4
1University of California at Davis
2Beijing University of Technology, Beijing, China
3Hong Kong Baptist University, Hong Kong, China
4Wecker Associate
In this paper, we study the estimation for a partial-linear single-index model. A two-stage estimation procedure is proposed to estimate the link function for the single index and the parameters in the single index, as well as the parameters in the linear component of the model. Asymptotic normality is established for both parametric components. For the index, a constrained estimating equation leads to an asymptotically more efficient estimator than existing estimators in the sense that it is of a smaller limiting variance. The estimator of the nonparametric link function achieves optimal convergence rates; and the structural error variance is obtained. In addition, the results facilitate the construction of confidence regions and hypothesis testing for the unknown parameters. A simulation study is performed and an application to a real dataset is illustrated. The extension to multiple indices is briefly sketched.
1 Introduction
Partial linear models have attracted lots of attention due to their flexibility to combine traditional linear models with nonparametric regression models. See, e.g. Heckman (1986), Rice (1986), Chen (1988), Bhattacharya and Zhao (1997), Xia and Härdle (2006), and the recent comprehensive books by Härdle, Gao, and Liang (2000) and Ruppert, Wand and Carroll (2003) for additional references. However, the nonparametric components are subject to the curse of dimensionality and can only accommodate low dimensional covariates . To remedy this, a dimension reduction model which assumes that the influence of the covariate can be collapsed to a single index, , through a nonparametric link function is a viable option and termed the partial-linear single-index model. Specifically, it takes the form:
| (1.1) |
where are covariates of the response variable , is an unknown link function for the single index, and is the error term with and . For the sake of identifiability, it is often assumed that and the th component of is positive, where denotes the Euclidean metric.
This model is quite general, it includes the aforementioned partial-linear model when the dimension of is one and also the popular single-index model in the absence of the linear covariate . There is an extensive literature for the single-index model with three main approaches: projection pursuit regression (PPR) [Friedman and Stuetzle (1981), Hall (1989), Härdle, Hall and Ichimura (1993)]; the average derivative approach [Stoker (1986), Doksum and Samarov (1995), and Hristache, Juditsky and Spokoiny (2001)]; and sliced inverse regression (SIR) and related methods [Li (1991), Cook and Li (2002), Xia, Tong, Li and Zhu (2002), and Yin and Cook (2002)]. All these approaches rely on the assumption that the predictors in are continuous variables, while model (1.1) compensates for this by allowing discrete or other continuous variables to be linearly associated with the response variable. To our knowledge, Carroll, Fan, Gijbels and Wand (1997) were the first to explore model (1.1) and they actually considered a generalized version, where a known link function is employed in the regression function while model (1.1) assumes an identity link function. However, their approaches may become computationally unstable as observed by Yu and Ruppert (2002) and confirmed by our simulations in Section 3. The theory of Carroll, Fan, Gijbels and Wand (1997) also relies on the strong assumption that their estimator for is already -consistent. Yu and Ruppert (2002) alleviated both difficulties by employing a link function which falls in a finite-dimensional spline space, yielding essentially a flexible parametric model. Xia and Härdle (2006) used a method that is based on a local polynomial smoother and a modified version of least squares in Härdle, Hall and Ichimura (1993).
In this paper, we propose a new estimation procedure. Our approach requires no iteration and works well under the mild condition that a few indices based on suffice to explain . Namely,
| (1.2) |
where is an unknown function from to , is a matrix with orthonormal columns, has mean zero and is independent of . The dimension is often much smaller than the dimension of . Such an assumption is not stringent and common in most dimension reduction approaches in the literature. A theoretical justification is provided in Li, Wen and Zhu (2008). Model (1.2) implies that a few indices of suffice to summarize all the information carried in to predict , which is often the case in reality, such as for the Boston Housing data in section 4, where a single index was selected for model (1.2) and is a discrete variable. In this data, first analyzed in Harrison and Rubinfeld (1978), the response variable is the median value of houses in census tracts in the Boston area. The covariates include: average number of rooms, the proportion of houses built before 1940, eight variables describing the neighborhood, two variables describing the accessibility to highways and employment centers, and two variables describing air pollution. A key covariate of interest is a binary variable that specifies whether a house borders the river or not. Our analysis presented in Section 4 based on the dimension reduction assumptions of (1.1) and with equal to this binary variable in (1.2) demonstrates the advantages of our model assumption, only one index () was needed in model (1.2) for this data.
To avoid the computational complications that we experienced with the procedure in Carroll et al. (1997), who aim at estimating and simultaneously, we choose to estimate and sequentially. The idea is simple: can be estimated optimally through approaches developed for partial linear models once we have a estimate of and plug it in (1.1). However, and may be correlated, leading to difficulties in identifying . This is where model (1.2) comes in handy, as it allows us to remove the part of that is related to so that the residual in (1.2) is independent of . Again, we need to impose the identifiability condition that has norm one and a positive first component. The procedure is as follows: First estimate via any dimension reduction approach, such as SIR or PPR for , and the projective resampling method in Li, Wen and Zhu (2008) for . Once has been estimated we proceed to estimate via a -dimensional smoother and then obtain the residual for . Since , plugging this into (1.1) we get
where is an unknown function, but now and are independent of each other. It is thus possible to employ a least squares approach to estimate and the resulting estimate will be -consistent. We then employ a dimension reduction procedure to and to obtain an estimate for and . This concludes the first stage , where the resulting estimates for and are already consistent but will serve the role as initial estimates for the next stage, where we update all the estimates but use a more sophisticated approach. Specifically for we apply the profile method, also called partial regression in Speckman (1988), to estimate . Theoretical results in Section 2.2 indicate that the two-stage procedure is fully efficient, so there is no need for iteration. More importantly, to estimate the index , we use an estimating equation to obtain asymptotic normality, which takes the constraint into account. The estimator based on this new estimating equation performs better in several ways, summarized as follows.
-
1.
Our estimation procedure directly targets the model parameters , , , and and no iteration is needed.
-
2.
We obtain the asymptotic normality of the estimator of and the optimal convergence rate of the estimator of , as well as the asymptotic normality of the estimator of . The most attractive feature of this new method is that the estimator of has smaller limiting variance when compared to three existing approaches in : Härdle et al. (1993) when the model is reduced to the single-index model, Carroll et al.(1997) if their link function is the identity function, and Xia and Härdle (2006) when their model is homoscedastic. This is the first result providing such a small limiting variance in this area.
-
3.
We also provide the asymptotic normality of the estimator of . It allows us to consider the construction of confidence regions and hypothesis testing for and .
The rest of the paper is organized as follows. In Section 2, we elaborate on the new methodology and then present the asymptotic properties for the estimators. Section 3 reports the results of a simulation study and Section 4 an application to a real data example for illustration. Section 5 gives the proofs of the main theorems. Some lemmas and their proofs are relegated to the Appendix.
2 Methodology and Main Results
2.1 Estimating Procedures
The observations are , a sequence of independent and identically distributed (i.i.d.) samples from (1.1), i.e.
where are i.i.d. random errors with
and , are independent of ,
,
, and
. For simplicity of presentation, we initially
assume that can be recovered from a single-index of . That
is, in (1.2). The general case will be explored at
the end of this section in Remarks 2. Below we first outline the
steps for each stage and then elaborate on each of these steps.
Algorithm for Stage One:
-
1.
Apply a dimension reduction method for the regression of versus to find an estimator of ;
-
2.
Smooth the over to get an estimator of , then compute the residuals ;
-
3.
Perform a linear regression of versus ’s to find an initial estimator of ;
-
4.
Apply a dimension reduction method to the regression of versus to find an initial estimator of
-
5.
Smooth the versus the to obtain an estimator for and for its derivative .
Algorithm for Stage Two:
-
6.
Use the initial estimate from Step 4 to update the estimate of through a profile approach for the partial linear model by minimizing (2.5).
-
7.
Use the updated estimate of from Step 6 to form the new residual , then update the estimate of by solving the estimating equation (2.10).
-
8.
Use the updated estimates of and in Steps 6 and 7 to update the estimate of , following the procedure as described in Step 5.
This completes the algorithm and, as we show in Section 2.2, the resulting estimators are already theoretically efficient. However, the practical performance can be improved by iterating Steps 6 and 7 one or more times. Our experience, through simulation studies not reported in this paper, reveals limited benefits when iterating more than once.
Next, we elaborate on each of the steps in the above algorithms for the simple case of a single index (). For the dimension reduction method in Step 4, one can use any of several existing methods, such as SIR or one of its variants, PPR, or the minimum average variance estimator (MAVE) of Xia, Tong, Li and Zhu (2002). These methods are for univariate responses and hence can also be applied in Step 1 when . However, when , a different method is needed in Step 1 for the case of a multivariate response, and we recommend the dimension reduction method in Li, Wen and Zhu (2008). This and other results in the literature already demonstrate the -consistency of these dimension reduction methods.
For the smoothing involved in Step 5, one can choose any one-dimensional smoother. We employ the local polynomial smoother (Fan and Gijbels, 1996) to obtain estimators of the link function and its derivative , which will be used in the second stage of the estimation procedure. Specifically, for a kernel function on and a bandwidth sequence , define . For a fixed and , the local linear smoother aims at minimizing the weighted sum of squares
with respect to the parameters , . Let and denote the bandwidths for estimating and , respectively. A simple calculation shows that the local linear smoother with these specifications can be represented as
| (2.1) |
and
| (2.2) |
where
| (2.3) |
| (2.4) |
and
The above estimators are for generic fixed values of and . To obtain the estimates needed in Step 5, one replaces them with the initial values obtained in Step 1 and obtained in Step 3, respectively. We will show in Theorem 2 that this results in standard convergence rates for the estimate of .
Likewise, a local linear smoother can be employed in Step 2 for estimating the unknown function in model (1.2). The resulting estimator is defined as
Several possibilities are available for the estimator of in Step 6, such as the profile approach (termed “partial regression” in Speckman, 1988) or the partial spline approach (Heckman, 1986). Here the the partial spline approach is not suitable for correlated and , so we adopt a profile approach and a local linear smoother. In short, this amounts to minimizing, over all , the sum of squared errors,
| (2.5) |
where is the estimator in (2.1) of , obtained by smoothing versus , and is an initial estimator of , which could be the initial estimator in Step 4 or the refined estimator from Step 7 when an iterated estimator for is desirable. Because this smoother is expressed as a function of , the estimate derived from (2.5) is a profile estimate. More details about the derivation and advantages of the profile approach can be found in Speckman (1988). Specifically, let be the current estimator, , , where
with and the respective estimators of and . The resulting partial regression estimator is thus
| (2.6) |
For the estimator of in Step 7, we propose a novel method that takes advantage of the constraint and hence is more efficient than existing approaches, including the PPR approach in Härdle et al (1993), the MAVE method in Xia et al. (2002), and the least squares approaches of Carroll et al (1997) and Xia and Härdle (2006) for the single-index partial linear model in (1.1). It is worth mentioning that Xia and Härdle (2006) allow possible heteroscadestic structure in (1.1), and least squares approaches have been standard dimension methods and lead to the same asymptotic variances for estimators of . For instance, in the homoscadestic case, the estimator in Xia and Härdle (2006) has an asymptotic variance that is identical to that of Härdle et al (1993). Our approach, based on an estimating equation under the constraint , is computationally stable and asymptotically more efficient, i.e., its asymptotic variance is smaller. The efficiency gain can be attributed to a re-parametrization, making use of the constraint by transferring restricted least squares to un-restricted least squares, which makes it possible to search for the solution of the estimating equation over a restricted region in the Euclidean space .
Without loss of generality, we may assume that the true parameter has a positive component (otherwise, consider ), say for and . For , let be a dimensional parameter vector after removing the th component in . Then we may write
| (2.7) |
The true parameter must satisfy the constraint , and is infinitely differentiable in a neighborhood of . This “remove-one-component” method for has also been applied in Yu and Ruppert (2002).
To obtain the estimator, consider a Jacobian matrix of with respect to ,
| (2.8) |
where is a dimensional unit vector with th component 1, and . To motivate the estimating equation, we start with the least squares criterion:
| (2.9) |
From (2.7) and (2.9) we find . Therefore, we may obtain an estimator of , say , by minimizing , and then obtain an estimator of , , via a transformation. This means that we transform a restricted least squares problem to an unrestricted least squares problem by solving the estimation equation:
| (2.10) |
We define the resulting estimator of as the final target estimator. Theorem 3 implies that our estimator for has a smaller limiting variance than the estimators in Xia and Härdle (2006) and Carroll et al. (1997).
With and , the final estimator of in Step 8 can be defined by
and the estimator of by Asymptotic results for the final parameter estimates of and are established in Theorem 1 and Theorem 2, and results for the link estimate of follow from Theorem 4.
Remark 1
We consider a homoscedastic model of (1.1) with in model (1.2). While the estimation procedure can be extended easily to heteroscedastic errors, an additional dimension reduction assumption on the variance function of of , given , is needed to avoid the curse of high dimensional smoother needed in Step 2 to estimate . This assumption requires that this variance function is also a function of a few indices based on . Moreover, the extension of asymptotic theory is not straightforward. For instance, the asymptotic efficiency of the estimator is technically challenging in the heteroscedastic case and its study is beyond the scope of this paper.
Remark 2
So far, we have assumed that . This assumption can be extended without difficulty to the general case where might be greater than 1. In this case, a multivariate smoother will be employed for estimating . The asymptotic results for the parameter estimates of and remain unchanged, except that the rate of convergence for the link estimate of changes with the dimension of .
Remark 3
Other dimension reduction approaches, such as MAVE (Xia et al., 2002) and other variants of SIR, such as SIR2 (Li, 1991) and SAVE (Cook and Wiseberg, 1991), could be employed in Steps 1 and 4 for the case of in (1.2), especially when SIR fails for the case of symmetric design of . While MAVE is perhaps the most efficient method of all, the benefits over SIR are limited, as all estimates are updated in Stage 2, and it is in this step where the major efficiency gains occur. In addition, MAVE is computationally more intensive than SIR and encounters difficulties in estimating , unless the covariate is one-dimensional and the dimension of is also small. In fact, the -consistency may not hold when in (1.2) as shown in Xia, Tong, Li and Zhu (2002).
Also, SIR2/SAVE was shown in Li and Zhu (2007) to be not -consistent, unless a bias correction is performed. In contrast, either SIR or pHd (Li, 1992) can be employed to identify the directions when and , and both lead to -consistency.
Remark 4
When the dimension of is greater than 1, a multivariate extension of SIR (Li et al., 2003) can be employed conceptually in Step 1 of the algorithm. However, the number of observations per slice may become sparse, so we recommend an alternative multivariate approach as in Li, Wen and Zhu (2008) or Zhu, Zhu, Ferré and Wang (2008) in Step 1.
Remark 5
The single-index assumption in (1.1) can be easily extended to multiple indices through SIR or its variants, but the estimation of the multivariate link function would encounter the curse of high dimensionality. Since no more than three indices will be needed in many applications, the approach in this paper can indeed be extended in practice to multiple indices.
2.2 Main results
In this section, the asymptotics for initial estimates of and in Stage 1 are taken for granted as they follow from existing results, so we do not formally list the needed assumptions for this to hold but have provided sources after Theorem 1 below. However, the asymptotics for the initial estimate of and each of the parametric and nonaprametric estimates in Stage 2 are fully developed in Section 2.2 with detailed assumptions listed for each estimator.
In order to study the asymptotic behavior of the estimators, we list the following conditions:
C1. (i) The distribution of has a compact support set . (ii) The density function of is positive and satisfies a Lipschitz condition of order 1 for in a neighborhood of . Further, has a positive and bounded density function on , where .
C2. (i) The functions and have two bounded and continuous derivatives, where is the th component of , ; (ii) satisfies a Lipschitz condition of order 1, where is the th component of , and , .
C3. (i) The kernel is a bounded, continuous and symmetric probability density function, satisfying
(ii) satisfies a Lipschitz condition on .
C4. (i) ; (ii) , , .
C5. (i) , ; (ii) , , .
C6. (i) is a positive definite matrix; (ii) is a positive definite matrix, where is defined by (2.8).
Remark 6
The Lipschitz condition and the two derivatives in C1 and C2 are standard smoothness conditions. C3 is the usual assumption for second-order kernels. C1 is used to bound the density function of away from zero. This ensures that the denominators of and are, with high probability, bounded away from 0 for , and near . C4 is a necessary condition for the asymptotic normality of an estimator. In C5(i), the range of for the estimators and is fairly large and contains the rate of “optimal” bandwidths. However, when analyzing the asymptotic properties of the estimator of , we have to estimate the derivative of . As is well known, the convergence rate of the estimator of is slower than that of the estimator of if the same bandwidth is used. This leads to a slower convergence rate for than , unless we use a kernel of order 3 or undersmoothing to deal with the bias of the estimator. This motivates the introduction of another bandwidth in C5(ii) to control the variability of the estimator of , and condition C5(ii) for bandwidths and . Chiou and Müller (1998) also consider the use of two bandwidths to construct the estimator of in a relevant model. C6 ensures that the limiting variances for the estimators and exist.
The following theorems state the asymptotic behavior of the estimators proposed in Section 2.1. We first establish the asymptotic efficiency of .
Theorem 1
Suppose that conditions C1, C2(i), C3(i), C4(i), C5(i) and C6(i) hold. When and , we have
Remark 7
Carroll et al.(1997) give similar results with and (The case of a partially linear model). Theorem 1 generalizes their Theorems 2 and 3.
In Theorem 1, when we start with -consistent estimators for and , is consistent for with the same asymptotic efficiency as an estimator that we would have obtained had we known and , and thus the oracle property. Numerous examples of - consistent estimators already exist in the literature. For instance, Hall (1989) showed that one can obtain a -consistent estimator for using projection pursuit regression. Under the linearity condition that is slightly weaker than elliptical symmetry of , Li (1991), Hsing and Carroll (1992) and Zhu and Ng (1995) proved that SIR, proposed by Li (1991), leads to a -consistent estimator of and of , the latter when is not present in (1.1). Li and Zhu (2007) further show that, when including a bias-correction and under a condition almost equivalent to normality of , sliced average variance estimation (SAVE, Cook and Weisberg 1991) performs similarly. We expect the results for to hold when is dependent of , provided a good estimator of is available. Under very general regularity conditions and for , Xia, Tong, Li, and Zhu (2002) proposed the minimum average variance estimation (MAVE) and Xia (2006) a refined version of MAVE, and both methods can provide -consistent estimators for the single-index . However, there is no result in the literature regarding MAVE when the dimension of is larger than 1, and the -consistency needs further study when is larger than or equal to , even for univariate . Therefore, for general theory, SIR may be a good choice for the initial estimators of and .
Theorem 2
Suppose that conditions C1–C6 hold. If the th component of is positive, we have
where , and are defined in condition C6.
From Härdle et al (1993) and Carroll et al (1997), we can see that the estimator of has an asymptotic variance that corresponds to a generalized inverse where
Note that there may be infinitely many inverse matrices of , but there is a unique generalized inverse associated with the Jacobian . The following theorem shows that the variance-cavariance matrix in Theorem 2 is smaller than , the variance associated with , in the sense that is a non-negative definite matrix. We use the usual notation: for two non-negative matrices and , denotes that is a non-negative definite matrix.
Theorem 3
Under the conditions of Theorem 2, we have
i) there is a generalized inverse of that is of the form ;
ii)
Remark 8
Theorem 3 shows that our estimator of is asymptotically more efficient than those of Härdle et al.(1993) and of Carroll et al. (1997). In addition, Carroll et al.(1997) use an iterated procedure to estimate and , while our estimation procedure does not require iteration.
From Theorem 2, we obtain an asymptotic result regarding the angle between and , which can be used to study issues of sufficient dimension reduction (SDR). We refer to Cook (1998, 2007) for more details.
Corollary 1
Suppose that the conditions of Theorem 2 hold. Then
where is the cosine of the angle between and .
The next two theorems provide the convergence rate of the estimator of and the asymptotic normality of the estimator of .
Theorem 4
Suppose that the conditions of Theorem 1 hold. If . Then
where for a constant .
Theorem 5
Suppose that conditions C1–C6 hold and . Then
We are now in the position to construct confidence regions for . From Theorem 10.2d in Arnold (1981) we obtain the following result.
Theorem 6
Under the conditions of Theorem 5, we have
where is chi-square distributed with degrees of freedom. Let be the -quantile of for , an asymptotic confidence region of is
To construct confidence regions for , a plug-in estimator of the limiting variance of is needed. We respectively define the following estimators and of and by
and
where is the estimator of and is the estimator of . It is easy to prove that , and . Then for any matrix of full rank with , Theorems 2 and 5 imply that
We again use Theorem 10.2d in Arnold (1981) to obtain the following limiting distribution.
Theorem 7
Suppose that the conditions of Theorem 5 hold. Then
The asymptotic confidence region of is, letting be the -quantile of for ,
3 Simulation study
In this section, we examine the performance of the procedures in Section 2, for the estimation of both and . We report the accuracy of estimators using PPR and SIR as dimension-reduction methods. The sample size for the simulated data is and the number of simulated samples is for the parametric components. When SIR is applied, using 5 or 10 elements per slice generally yields good results. In other words, each slice contains 10 to 20 points. A quadratic model of the form
was used, where is a scalar, , is a 5-dimensional vector with independent uniform [0,1] components, and is a standard normal variable. The dependency between and was prescribed by defining as a binary variable with probability to be and otherwise. Two extreme cases of are reported in Table 1 and Table 2, one based n choosing the same value as with , and the other on , so that is orthogonal to . We also checked scenarios where and are neither orthogonal nor parallel to each other, and the results are in agreement with the two extreme cases reported here.
For the smoothing steps, we used a local linear smoother with a Gaussian kernel throughout. A product Gaussian kernel was used when bivariate smoothing was involved and equal bandwidths were selected for each kernel to save computing time. A pilot study revealed that the bandwidth chosen at the first stage to estimate the residual has little effect on the accuracy of the final estimates of , so we choose an initial bandwidth of to estimate in (1.2), as this value was frequently selected by generalized cross validation (GCV). The subsequent smoothing steps utilized the GCV method as proposed in Craven and Wahba (1979). For instance, when estimating and in the second stage, the GCV statistic is given by the formula
| (3.1) |
where is the estimator of with a bandwidth and is the smoothing matrix corresponding to a bandwidth of . The GCV bandwidth was selected to minimize (3.1). We use the optimal bandwidth, , for and . When calculating the estimator , we chose the bandwidths,
| (3.2) |
respectively, because this guarantees that the required bandwidth has the correct order of magnitude for optimal asymptotic performance [see Carroll al.(1997), Stute and Zhu (2005), and Zhu and Ng (2003)]. Note that choices (3.2) satisfy condition C5(ii). Relevant discussion on choosing two distinct bandwidths can be found in Chiou and Müller (1998).
In the simulation, PPR and SIR were used to obtain the initial estimators of and . The notation SIRc means that when we used SIR to estimate , the number of data points per slice is . The resulting estimates for and the one-step iterated estimates are summarized in Tables 1 and 2, where we report bias, standard deviation (SD), and mean square error (MSE). The case with known is also reported in the last row and serves as a gold standard. The right columns under “One-step iterated estimate” in Tables 1 and 2 represent the results obtained when iterating the algorithms in Section 2.1 one more time after obtaining the estimates in the left columns.
Tables 1 and 2 are about here
From Tables 1 and 2 we find that the three methods have small mean square errors with projection pursuit regression outperforming both SIR procedures. This is expected, as the simulated model structure satisfies the additive assumption of PPR and the estimates of the -directions were iteratively updated through estimates of the unknown link functions, and . In other non-additive situations, SIR might be more reliable than PPR. Iterated estimates improved the results for all cases and markedly so for the orthogonal case. Compared to the case when is known, PPR typically attains 80% or more of the efficiency after one iteration.
For the estimation of , we computed the angle (in radians) between and as a measure of accuracy. The mean, standard deviation (SD), and mean squared error (MSE) of the angle between and are reported in Table 3. Here, PPR leads to by far superior estimates compared to SIR.
Table 3 is about here
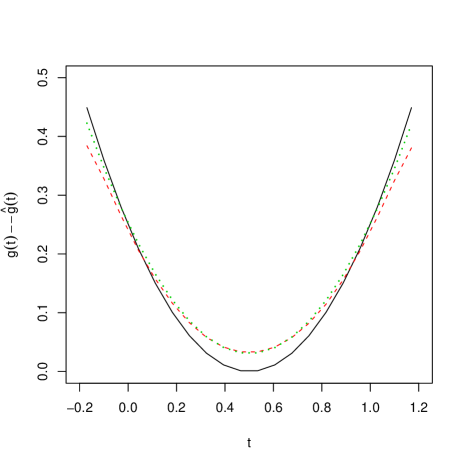
The performance of the nonparametric estimates for is demonstrated in Figure 1. Again, GCV was used for bandwidth choice and compared to the estimates based on the optimal fixed bandwidth. The true function and the mean of each estimated -function over the 2000 replicates are plotted. In general, GCV seems to work well for all parametric and nonparametric components. This is consistent with the results reported in Chen and Shiau (1994) for the analysis of partially linear models based on generalized cross validation (GCV). Theoretical properties of the current models in regard to GCV will be a topic for further investigation.
Figure 1 is about here
A final remark is that we tried to compare our procedure with that proposed in Carroll, et al. (1997), for the quadratic model used in the above simulations with and orthogonal. However, we were not able to obtain any results for the method in Carroll et al. (1997), as their procedure seems to be very sensitive to the choice of the initial estimates. We then used our estimates for and as the initial values for their procedure. Nevertheless, we were still unable to obtain any meaningful comparison results as out of the seven attempted trials their procedure crashed six times on the first simulation and once on the second simulation. Since is only a scalar, we postulate that their procedure has difficulties with high dimensional , which is here a five-dimensional vector.
4 Data Example
We analyze the Boston Housing data mentioned in Section 1. The goal is to determine the effect of the various variables on housing price, including a binary variable, which describes whether the census tract borders the Charles River. According to Harrison and Rubinfeld (1978), bordering the river should have a positive effect on the median housing price of the census tract. They used a linear model that included a log transformation for the response variable and three of the covariates, and power transformations for three other covariates. Their final model is
The coefficient is estimated to be 0.088, which is significant with a -value of less than for the hypothesis versus . The coefficient of determination attained by their analysis is , where is the squared correlation between the true dimension-reduction variable and the estimated dimension-reduction variable .
This data set was also analyzed by Chen and Li (1998), who used sliced inverse regression with all thirteen covariates. After examining the initial results, Chen and Li (1998) trimmed the data and then dropped some of the variables. We fit the data on the first SIR direction of the initial analysis reported in their article and obtained an of using GCV bandwidth . Note that the assumptions of sliced inverse regression are probably not met because some of the covariates are discrete. We thus proposed to use a partial-linear single-index model. Several choices of were attempted, but they did not yield better results, in terms of , than the one using only the Charles River variable as and the other covariates as . We thus focus on this model, where a log transformation was applied on .
To select the number of observations per slice in the dimension reduction step of SIR, we borrow our experience in the simulation presented in Section 3, where 5 or 10 observations per slice worked well for a total sample size of 100, leading to about 20 to 10 slices. Since the sample size for the housing data is much larger, we use SIR with 20 data points per slice and this leads to a total of 26 slices. As Chen and Li (1998) pointed out, SIR is not sensitive to the choice of slice number, and they tried slicing with 10 or 30 points per slice leading to 17 or 50 slices, and obtain very similar results. The GCV bandwidth for estimating and is 0.367, which is smaller than the bandwidth 0.43 chosen by the GCV method for the SIR approach of Chen and Li (1998). To estimate by (2.10), the bandwidths selected by (3.2) for and for is 0.367. The is 0.8047, which is essentially equal to that obtained by Harrison and Rubinfeld and higher than that using SIR on all thirteen variables. The value of the test statistic for versus is 3.389 when the degrees of freedom are calculated according to Hastie and Tibshirani, and 3.419 when degrees of freedom are used. Either way the result is significant with -value .
We also omitted the Charles River variable and used a dimension-reduction model on and . After obtaining an estimate for , we then estimate the relationship between and . GCV yields a bandwidth of 0.16, and we obtain . Even though the Charles River variable is significant, its inclusion leads to only a minor increase in .
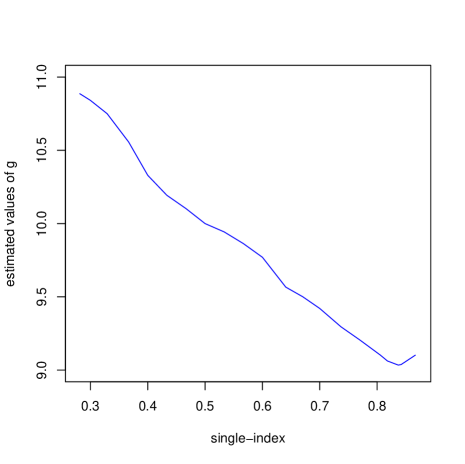
Figure 2 is about here
Figure 2 shows the estimated along with the data. On the -axis of the above graph, the estimated value is given, and on the -axis, the estimated value . Figure 2 shows a downward trend in the effective dimension reduction (EDR) variate obtained. The upward curvature of the function at high values of the EDR variate may or may not be a real effect.
The advantage of our procedure over the one used by Harrison and Rubinfeld is that Harrison and Rubinfeld have to make choices regarding transformations for every variable in the model. We only need to choose the bandwidth or bandwidths used for smoothing.
5 Proofs of Theorems
Since the proofs of the theorems are rather long, the proofs of Theorems 1–4 are presented in this section, and more details of the proofs are divided into Lemmas A.2–A.7 in the Appendix.
In this section and the Appendix, we use to represent any constant which may take different values for each appearance, and .
Proof of Theorem 1. Denote
From (2.6) we have
Lemma A.5 in the Appendix implies
| (5.1) |
Therefore, Lemma A.6 in the Appendix leads to
It remains to show that
| (5.2) |
Since
The central limit theorem implies . Similarly to the proof of (A.17), it is easy to obtain that . This together with (5.1) and Slutsky’s Theorem proves (5.2), and hence Theorem 1.
Proof of Theorem 2. The proof is divided into two steps: From (2.9), step (I) provides the existence of the least squares estimator of , and from (3.1), step (II) proves the asymptotic normality of .
(I) Proof of existence. We prove the following fact: Under conditions C1–C5 and with probability one there exists an estimator of minimizing expression (2.9) in , where for some constant such that .
In fact, let and . We have
The same arguments as in the proof of Theorem 1 can be used to obtain that and , where is a constant independent of . This implies . Thus, minimizing simultaneously with respect to is very much like separately minimizing with respect to . It follows from (2.7) that we only need to prove the existence of an estimator of in , where for some constant such that . Since , where is defined in (A.19) of Lemma A.7. For an arbitrary with the value of constant in to be determined, we have from Lemma A.7 below that
| (5.3) |
The following arguments are similar to those used by Weisberg and Welsh (1994), which in turn use (6.3.4) of Ortega and Rheinboldt (1973). We note that term (5.3) is dominated by the term because , whereas and . So, for any given , if is chosen large enough, then it will follows that on an event with probability . From the arbitrariness of , we can prove the existence of the least squares estimator of in as in the proof of Theorem 5.1 of Welsh (1989). The details are omitted.
(II) Proof of asymptotic normality. From step (I) we find that is a solution in to the equation . That is, . By Lemma A.7, we have
and hence
We now consider the estimator . A simple calculation yields
and hence
It follows from (2.7) and the above equation, that
That is, from the definition of of (2.8)
Thus, we have
Theorem 2 follows from this, Central Limit Theorem and Slutsky’s Theorem.
Proof of Theorem 3. Recalling the definition of , we can see that Define
We now prove that is a generalized inverse of . To this end, we need to prove that and . Note that
We now prove . First, by decomposition (see, e.g. Gentle 1998, Section 3.2.2, pages 95-97 for more details) for , we can find its orthogonal complement such that is an orthogonal matrix, and Thus, where with being a nonsigular matrix. Further, note that
To prove the result, we rewrite in another form. Define is a nonsingular matrix. Then
We now prove that that is of the above form. From the above and noting that and , we have
Thus, is one of the solutions of . To prove that the asymptotic variance-covariance matrix of our estimator is smaller than the corresponding matrix given in Härdle et al. (1993), we only need to show that is a positive semi-definite matrix, that is, . Recall that . Note that both and are positive definite matrices and obviously . Thus, , and then . From these two inequalities, it is easy to see that
The proof is now complete.
Proof of Corollary 1. Let denote the inner product of two vectors. Theorem 2 implies and
This completes the proof of Corollary 1.
Proof of Theorem 4. Denote , . Theorem 1 and Lemma A.4 in the Appendix yield
and hence Theorem 4 follows.
Proof of Theorem 5. Decomposing into several parts, we have
Note that and using (A.8) of Lemma A.4, we have
Since , we obtain . Similarly to the proof of (A.17) in the Appendix, we also have . This proves that . Therefore, we have
The proof can now be completed by employing the central limit theorem.
APPENDIX
The following Lemmas A.1–A.7 are needed to prove Theorems 1, 2, 4, 5. Lemma A.1 gives an important probability inequality and Lemmas A.2 and A.3 provide bounds for the moments of the relevant estimators. They are used to obtain the rates of convergence for the estimators of the nonparametric component, and are used in the proof of Lemmas A.4–A.7. Lemma A.4 presents the uniform rates of convergence in probability for the estimators , and . These results are very useful for the nonparametric estimations. The proof of Lemma A.5–A.7, as well as Theorem 3 and 4, rely on Lemma A.4. To simplify the proof of Theorem 1, we divide the main steps of the proofs into Lemmas A.5 and A.6. Lemma A.5 is used to obtain the limiting variance of the estimator , and Lemma A.6 together with Lemma A.5 shows that the rate of convergence of the nonlinear section of for is . Lemma A.7 provides the main step for the proof of Theorem 2.
Lemma A.1 Let be a sequence of random variables. Denote for , where be a sequence of random variables, and is a function on , where for a constant . Assume that satisfies
for some constants , , and . Let depend only on . If
for , then we have
where is a constant.
Proof. Let be an independent version of . Now generate independent sign random variables for which , and independent of . By symmetry, has the same distribution as . The symmetrization Lemma in Pollard (1984) implies
Let be the empirical measure that puts equal mass at each of the observations . Let be a class of functions indexed by and consisting of . Denote . Given , choose function , each in , such that
for each in . Let be the minimum for all sets that satisfies (A.5). Denote for the at which the minimum is achieved, we then have
Now we need to determine the order of . For each set satisfying (A.5), each has a pair such that . Then for all , we have from (A.1) that
Next, we want to bound the right-hand side of the above formula by . Thus for each , we need a pair within radius of . Therefore, the number needed to satisfy (A.5) is bounded by , i.e.
Now conditioning on , is bounded. Hoeffding’s inequality [(Hoeffding (1963)] yields
This together with (A.4), (A.6) and (A.7) proves (A.3).
Lemma A.2 Suppose that conditions C1, C2 and C3(i) hold. If for any and some constants , then, for , we have
and
where and is the th component of .
Proof. See Lemma 1 of Zhu and Xue (2006).
Lemma A.3 Under the assumptions of Lemma A.2, we have
and
Proof. See Lemma 2 of Zhu and Xue (2006).
Lemma A.4 Suppose that conditions C1–C4 and C5(i) hold. We then have
and
| (A.9 ) |
If in addition, C5(ii) also holds, then we have
where for a constant .
Proof. We only prove (A.8), the proofs for (A.9) and (A.10) are similar. Write , . We have
Let , , , . Using lemma A.1, we have to verify (A.1) and (A.2). A simple calculation yields (A.1), so we now verify (A.2). By lemmas A.2 and A.3, and noting that , we have
Given a , by Chevbychev’s inequality and (A.12), we have
Therefore, from C5(i), we can choose large enough so that the right hand side of (A.13) is less than or equal to . Hence, (A.2) is satisfied. We now can use (A.3) of Lemma A.1 to get (A.8). By Lemma A.3, we obtain
This implies that . Hence, from Lemma A.1 we have
The right-hand side of the above formula tends to zero when is large enough. Therefore, (A.8) follows.
Lemma A.5 Under the assumptions of Theorem 1, we have
where is defined in condition C6.
Proof. Noting that , the element of is
The element of is
By the law of large numbers, we have
where is the element of . Noting that
this together with (A.9) of Lemma A.4 proves that
Similarly, we can prove and . This together with (A.14) and (A.15) proves Lemma A.5.
Lemma A.6 Under the assumptions of Theorem 1, we have
Proof. The th component of is
For , from (A.8) and (A.9) of Lemma A.4 we have
Noting that , we obtain . It remains to prove that
as this together with (A.16) implies Lemma A.6. To prove (A.17) , we only need to show that
where for a constant . Toward this goal, we note that Lemma A.1 can be used when the variable is removed. Let
We now verify that (A.1) and (A.2) are satisfied. By the condition C3(ii) on the kernel function, we calculate that
where . Hence, (A.1) is satisfied.
We next verify that (A.2) is satisfied. Denote . From condition C4, Lemmas A.2 and A3, we have
Hence, we can obtain
when large enough. Therefore, (A.2) is satisfied. By (A.8) of Lemma A.4, we have
By using Lemma A.1, we obtain
by . This proves (A.18) and thus completes the proof of Lemma A.6.
Lemma A.7. Suppose that conditions C1–C6 are satisfied, then we have
where for a constant , is defined in condition C6,
| (A.19 ) |
and
Proof. Separating , we have
Noting that for all , we have
Since implies for all , similar to the proof of (A.17) we can show that
For , by a Taylor expansion of with a suitable mean and , we get
By (A.10) of Lemma A.4 and the law of large numbers, we obtain that
and
Therefore, we have
We now consider . Write . Let denote the th component of . First, from Lemma A.2 and A.3 we have
This implies
and by Lemma A.4 we obtain
Substituting (A.21)–(A.25) into (A.20), we prove Lemma A.7.
REFERENCES
-
Arnold, S. f. (1981). The Theory of Linear Models and Multivariate Analysis. John Wiley & Sons, New York.
-
Bhattacharya, P. K. and Zhao, P.-L. (1997). Semiparametric inference in a partial linear model. Ann. Statist. 25 244-262.
-
Carroll, R. J., Fan, J. Gijbels, I. and Wand, M. P. (1997). Generalized partially linear single-index models. J. Amer. Statist. Assoc. 92 477–489.
-
Chen, C.-H. and Li, K.-C.(1998). Can SIR be as popular as multiple linear regression. Statistics Sinica 8 289–316.
-
Chen, H. (1988). Convergence rates for parametric components in a partly linear model. Ann. Statist. 16 136–141.
-
Chen, H. and Shiau, J.-J. H. (1994). Data-driven efficient estimators for a Partially linear model. Ann. Statist. 22 211–237.
-
Chiou, J. M. and Müller, H. G. (1998). Quasi-likelihood regression with unknown link and variance functions. J. Amer. Statist. Assoc. 93 1376–1387.
-
Cook, R. D. (1998). Regression Graphics: Ideas for Studying Regressions Through Graphics. Wiley, New York.
-
Cook, R. D. (2007). Fisher Lecture: Dimension Reduction in Regression1, 2 R. Dennis Cook. Statist. Sci. 22 1-26.
-
Cook, R. D. and Li, B. (2002). Dimension reduction for the conditional mean in regression. Ann. Statist. 30 455–474.
-
Cook, R. D. and Wiseberg, S. (1991). Comment on “Sliced inverse regression for dimension reduction,” by K. C. Li. J. Amer. Statist. Assoc. 86 328–332.
-
Craven, P. and Wahba, G. (1979), Smoothing and noisy data with spline functions: estimating the correct degree of smoothing by the method of generalized cross-validation, Numer. Math. 31 377-403.
-
Doksum, K. and Samarov, A. (1995), Nonparametric estimation of global functionals and a measure of the explanatory power of covariates in regression. Ann. of Statist. 23 1443-1473.
-
Fan, J. and Gijbels, I. (1996). Local Polynomial Modeling and Its Applications. Chapman and Hall, London.
-
Friedman, J. H. and Stuetzle, W. (1981). Projection pursuit regression. J. Amer. Statist. Assoc. 76 817–823.
-
Gentle, J. E.(1998). Numerical Linear Algebra for Applications in Statistics. Berlin: Springer-Verlag.
-
Hall, P. (1989). On projection pursuit regression. Ann. Statist. 17 573–588.
-
Härdle, W., Hall, P. and Ichimura, H. (1993). Optimal smoothing in single-index models. Ann. Statist. 21 157–178.
-
Härdle, W., Gao, J. and Liang, H. (2000) Partially Linear Models. Springer, New York
-
Harrison, D. and Rubinfeld, D. (1978). Hedonic housing pries and the demand for clean air Environmental Economics and Management 5 81–102.
-
Heckman, N. (1986). Spline smoothing in a partly linear model. J. Royal Statist. Soci. Ser.A 48 244–248.
-
Hristache, M., Juditsky, A. and Spokoiny, V. (2001). Direct estimation of the index coefficient in a single-index model. Ann. Statist. 29 595–623.
-
Hsing, T. and Carroll, R. J. (1992). An asymptotic theory for sliced inverse regression. Ann. Statist. 20 1040–1061.
-
Li, B., Wen, S. Q. and Zhu L. X. (2008). On a projective resampling method for dimension reduction with multivariate responses. J. Amer. Statist. Assoc. 106 1177-1186.
-
Li, K. C. (1991). Sliced inverse regression for dimension reduction (with discussion). J. Amer. Statist. Assoc. 86 316–342.
-
Li, K. C. (1992). On principal Hessian directions for data visualization and dimension reduction: Another application of Stein’s lemma. J. Amer. Statist. Assoc. 87 1025–1039.
-
Li, K. C., Aragon, Y., Shedden, K., and Agnan, C. T. (2003). Dimension reduction for multivariate response data. J. Amer. Statist. Assoc. 98 99–109.
-
Li, Y. X. and Zhu, L. X. (2007). Asymptotics for sliced average variance estimation. Ann. Statist. 35 41–69.
-
Pollard, D. (1984). Convergence of Stochastic Processes. Springer-Verlag New York Inc., New York.
-
Rice, J. (1986), Convergence rates for partially splined models. Statist. Prob. Lett. 4 203-208.
-
Ruppert, D., Wand, M. P. and Carroll, R. J. (2003). Semiparametric Regression. New York: Cambridge University Press,
-
Speckman, P. (1988). Kernel smoothing in partial linear models. J. Roy. Statist. Soci. Ser.B 50 413–434.
-
Stoker, T. M. (1986). Consistent estimation of scaled coefficients. Econometrica 54 1461–1481.
-
Stute,W. and Zhu, L. X. (2005). Nonparametric checks for single-index models. Ann. Statist. 33 1048–1083.
-
Weisberg, S. and Welsh, A. H. (1994). Adapting for the Missing Linear Link. Ann. Statist. 22 1674–1700.
-
Welsh, A. H. (1989). On M-processes and M-estimation. Ann. Statist. 17 337–361. [Correction(1990) 18 1500.]
-
Xia, Y. and Härdle, W. (2006). Semi-parametric estimation of partially linear single-index models. J. Multi. Anal. 97 1162 - 1184
-
Xia, Y., Tong, H. Li, W. K. and Zhu L. X. (2002). An adaptive estimation of dimension reduction space. J. R. Statist. Soc. B 64 363–410.
-
Xia, Y. (2006). Asymptotic distributions for two estimators of the single-index model. Econometric Theory 22 1112–1137.
-
Yin, X. and Cool, R. D. (2002). Dimension reduction for the conditional -th moment in regression. J. R. Statist. Soc. B 64 159–175.
-
Yu, Y. and Ruppert, D. (2002). Penalized spline estimation for partially linear single-index models. J. Amer. Statist. Assoc. 97 1042–1054.
-
Zhu, L. X. and Ng, K. W. (1995). Asymptotics for Sliced Inverse Regression. Statistica Sinica 5 727-736.
-
Zhu, L. X. and Ng, K. W. (2003) Checking the adequacy of a partial linear model. Statist. Sinica 13 763-781.
-
Zhu L. X. and Xue L. G. (2006) Empirical likelihood confidence regions in a partially linear single-index model. J. Roy. Statist. Soc. ser. B, 68 549–570.
-
Zhu, L., Zhu, L. X., Ferrë L., and Wang, T. (2008). Sufficient Dimension Reduction Through Discretization-Expectation Estimation. Unpublished manuscript, Hong Kong Baptist University.
TABLE 1
Simulation results for with and parallel
|
||||||||||||||||||||||||||||||||||||||||||||
TABLE 2
Simulation results for with and orthogonal
|
||||||||||||||||||||||||||||||||||||||||||||
TABLE 3
Simulation results for the angles between and
|
|||||||||||||||||||||||||||||||||||||