The Edge of the M87 Halo and the Kinematics of the Diffuse Light in the Virgo Cluster Core111Based on data collected with VLT Kueyen at Cerro Paranal, Chile, operated by ESO during observing run 076.B-0086(A)
Abstract
Aims. To study the kinematics and dynamics of the extreme outer halo of M87, the central galaxy in the Virgo cluster, and its transition to the intracluster light (ICL).
Methods. We present high resolution FLAMES/VLT spectroscopy of intracluster planetary nebula (PN) candidates, targeting three new fields in the Virgo cluster core with surface brightness down to . Based on the projected phase space information (sky positions and line-of-sight velocities) we separate galaxy and cluster components in the confirmed PN sample. We then use the spherical Jeans equation and the total gravitational potential as traced by the X-ray emission to derive the orbital distribution in the outer stellar halo of M87. We determine the luminosity-specific PN number for the M87 halo and the ICL from the photometric PN catalogs and sampled luminosities, and discuss the origin of the ICL in Virgo based on its measured PN velocities.
Results. We confirm a further 12 PNs in Virgo, five of which are bound to the halo of M87, and the remainder are true intracluster planetary nebulas (ICPNs). The M87 PNs are confined to the extended stellar envelope of M87, within a projected radius of kpc, while the ICL PNs are scattered across the whole surveyed region between M87 and M86, supporting a truncation of M87’s luminous outer halo at a level. The line-of-sight velocity distribution of the M87 PNs at projected radii of 60 kpc and 144 kpc shows (i) no evidence for rotation of the halo along the photometric major axis, and (ii) that the velocity dispersion decreases in the outer halo, down to km s-1 at 144 kpc. The Jeans model for the M87 halo stars fits the observed line-of-sight velocity dispersion profile only if the stellar orbits are strongly radially anisotropic ( at kpc increasing to at the outer edge), and if additionally the stellar halo is truncated at kpc average elliptical radius. The -parameters for the M87 halo and the ICL are in the range of values observed for old ( Gyr) stellar populations.
Conclusions. Both the spatial segregation of the PNs at the systemic velocity of M87 and the dynamical model support that the stellar halo of M87 ends at kpc. We discuss several possible explanations for the origin of this truncation but are unable to discriminate between them: tidal truncation following an earlier encounter of M87 with another mass concentration in the Virgo core, possibly around M84, early AGN feedback effects, and adiabatic contraction due to the cluster dark matter collapsing onto M87. From the spatial and velocity distribution of the ICPNs we infer that M87 and M86 are falling towards each other and that we may be observing them just before the first close pass. The new PN data support the view that the core of the Virgo cluster is not yet virialized but is in an ongoing state of assembly, and that massive elliptical galaxies are important contributors to the ICL in the Virgo cluster.
Key Words.:
galaxies: clusters: individual (Virgo) — stellar dynamics — (ISM:) planetary nebulae: general — galaxies: halos — galaxies: elliptical and lenticular, cD — galaxies: formation1 Introduction
Over the past few years the diffuse intracluster light (ICL) has been the focus of many studies, both in nearby (Feldmeier et al., 2004; Mihos et al., 2005) and in intermediate redshift clusters (Zibetti et al., 2005; Krick & Bernstein, 2007). It has been found that the ICL is centrally concentrated and in many cases, including the diffuse outer halos of galaxies, comprises 10% of the total starlight in the cluster (Zibetti et al., 2005), and up to as much as (Gonzalez et al., 2007).
Theoretical studies of the diffuse cluster light through simulations predict that the ICL is unmixed and therefore should exhibit a fair amount of sub-structure (Napolitano et al., 2003; Murante et al., 2004; Rudick et al., 2006). An important contribution to the diffuse light in clusters may come from the extended halos of giant galaxies: numerical simulations predict the presence of such halos around isolated galaxies out to several hundred kpc, consisting of stars shed by merging sub-units (Abadi et al., 2006). When these galaxies enter the cluster core, their halos would be stripped first by the tidal fields and later by the tidal shocking in the interaction with the cluster’s central core and cD galaxy (Rudick et al., 2006; Murante et al., 2007).
Indeed the deep image of the Virgo cluster core by Mihos et al. (2005), reaching mag arcsec-2, shows a variety of features such as streamers, arcs and smaller features associated with individual galaxies. It also shows faint, very extended diffuse halos surrounding the large galaxies. In particular, around the giant elliptical galaxy M87, the Mihos et al. (2005) photometry reveals an extended stellar envelope at very low surface brightness levels, mag arcsec-2, with flattened isophotes (noted previously by Arp & Bertola, 1971; Weil et al., 1997), and out to ( kpc) along the semi-major axis.
The Virgo cluster has long been known to be dynamically unmixed, with complex sub-structures. This was first realized from the spatial and velocity distribution of Virgo galaxies (e.g. Binggeli et al., 1987, 1993). In particular Binggeli et al. (1993) found tentative evidence from the asymmetry in the velocity distribution of dwarf spheroidal galaxies that even the core of Virgo is not virialised, and suggested that the cluster is dynamically young, with two sub-clumps M87 and M86 falling in towards each other in the centre.
From photometry in clusters (Gonzalez et al., 2005; Krick & Bernstein, 2007) and from kinematic studies of the ICL in nearby clusters (Arnaboldi et al., 2004; Gerhard et al., 2005, 2007) we have learned that the genuine ICL component, defined as the light radiated by stars floating freely in the cluster potential, and the extended halos of bright (elliptical) galaxies often overlap spatially, and cannot easily be distinguished from broad-band photometry alone. Kinematic information can complement the photometry. For surface brightness mag/arcsec2, integrated light spectroscopy can be used to measure the mean velocity and velocity dispersion in the outer halos of the brightest cluster galaxies (Sembach & Tonry, 1996; Kelson et al., 2002); however, reaching the faint surface brightness level of the true ICL component with this technique is very difficult. Since planetary nebulae (PNs) follow light (e.g. Coccato et al., 2009), the spectroscopic study of these tracers, both in the extended halos and the ICL, offers a way to identify and measure the kinematics of these diffuse stellar components down to very faint surface brightness ( in Virgo), but it is currently limited to clusters with distances Mpc (Gerhard et al., 2005).
For the Virgo cluster, there has been considerable success with a two-step approach of identifying PN candidates with narrow-band imaging followed by multi-object spectroscopy. Arnaboldi et al. (1996) observed the outer regions of the giant elliptical M86, measuring velocities for 19 objects. Three of these turned out to be true ICPNs, with velocities similar to that of the mean velocity of the Virgo cluster. Subsequently, 23 PNs were detected in a spectroscopic survey with 2dF on the 4m Anglo-Australian Telescope (Freeman et al. 2000; Arnaboldi et al. 2002). These results were all based on single line identifications, although the second oxygen line was seen with the right ratio in the composite spectrum of 23 PNs observed by Freeman et al. (2000). The first confirmation based on detecting the [OIII] doublet in a single PN spectrum was made in Arnaboldi et al. (2003). Expanding on this early work, we began a campaign to systematically survey PN candidates in the Virgo cluster using multi-object spectroscopy with the FLAMES/GIRAFFE spectrograph on the VLT (Arnaboldi et al., 2004, hereafter A04). A04 presented the first measurements of the velocity distribution of PNs from three survey fields in the Virgo cluster core and concluded that in two of these fields the light is dominated by the extended halos of the nearby giant elliptical galaxies, while the ICL component dominates the diffuse light in only one field, where a ‘broad’ line-of-sight velocity distribution is measured, and all PNs are true ‘ICPNs’.
We here present PN velocity measurements from a further three pointings in the heart of the cluster core. We emphasize that these pointings are targeting faint surface brightness regions well outside of individual galaxies, in order to trace the ICPNs expected to be moving freely in the cluster potential, and thus to investigate the dynamical state of the ICL and of the core of the Virgo cluster. The photometric/geometric classification of PNs as ICPNs is in fact revised later in the paper according to the dynamical information obtained from the line-of-sight (LOS) velocities of the confirmed PNs.
In this paper we give a summary of our observations and data reduction in § 2 where we also discuss the sample completeness and show the final emission spectra. The distribution of measured line-of-sight velocities (LOSVD) and the projected phase-space diagram for these PNs are presented in § 3. From these data we distinguish between ICPNs and PNs bound to the halo of M87. In § 4 we discuss the rotation, velocity dispersion and physical extent of the stellar halo of M87, using the velocities of the PNs bound to M87 in the combined data sets of this paper and A04. We then construct a dynamical model based on the gravitational potential obtained from X-ray observations and the combined absorption-line and PN velocity dispersion data for the galaxy. Possible mechanisms for the truncation of M87’s stellar halo are discussed in § 4.5. In § 5 we compute the luminosity-specific PN number for both the M87 halo and the ICL in Virgo, and in § 6 we discuss the implications of the ICPN LOSVD for our understanding of the dynamical status of the cluster core and the origin of the ICL in Virgo. Summary and conclusions of the paper are given in § 7.
In what follows, we adopt a distance of Mpc for M87, equivalent to a distance modulus of 30.88; therefore pc.
2 Observations
The observations were taken in service mode (22 hrs, 076.B-0086 PI: M. Arnaboldi) over the nights 25-28th March 2006 using the FLAMES spectrograph on UT2/VLT in MEDUSA mode which allows spectra to be taken through up to 132 fibers simultaneously222See http://www.eso.org/sci/facilities/paranal/instruments/flames/ overview.html.. The data were taken in clear conditions with seeing . We used the high resolution grism HR504.8 centred at 504.8nm and with wavelength coverage 250Å and spectral resolution 20,000. With this setup, the instrumental broadening of the arc lines is FWHM = 0.29 Å or 17 kms-1, and the error on the wavelength measurements is 0.0025 Å or 150 ms-1 (Royer et al., 2002).
Figure 1 shows the location of the selected fields targeted with FLAMES, including the three previous fields FCJ, CORE and SUB presented in A04, and the three new fields F4, F7_1, F7_2. The photometry used for the selection of PN candidates is from Feldmeier et al. (2003); his fields F4 and F7 contain the FLAMES fields F4 and (F7_1, F7_2), respectively.

2.1 Data reduction and sample completeness
The data were reduced using the GIRAFFE pipeline333The GIRAFFE
pipeline is available at
http://girbldrs.sourceforge.net.
including bias subtraction, determining fiber location on the CCD,
wavelength calibration, geometric distortion corrections and
extraction of the one-dimensional spectra. The co-addition was carried
out separately as a final step on the one-dimensional spectra as the
fibers are allocated in a slightly different order for MEDUSA plates 1
and 2 and the pipeline does not account for this.
| Field | F7_1 | F7_2 | F4 |
|---|---|---|---|
| (J2000.0) | 12 28 53.70 | 12 28 46.40 | 12 27 43.35 |
| (J2000.0) | +12 44 32.5 | +13 00 20.5 | +12 33 57.5 |
| N | 22 | 28 | 25 |
| N | 13 | 12 | 8 |
| N | 9 | 5 | 5 |
| N | 6 | 4e | 3 |
a Total number of targets with allocated fibers.
b Number of targets with allocated fibers and brighter
or equal to the completeness magnitude limit of the photometric
survey.
c Number of spectra with detected emission line.
d Number of spectra with both [O iii] Å detected.
e One of these is in common with F7_1, i.e., we have only 12
confirmed PNs in total, one of which was observed twice.
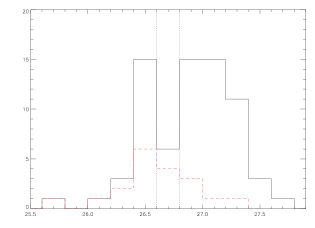
Table 1 shows the number of spectroscopically confirmed emission-line objects and planetary nebulas, with respect to the number of candidates targeted (), and the number of candidates targeted above the photometric completeness limit for each field ().
A histogram showing the number of candidates versus number of confirmed emission-line objects by magnitude is shown in Figure 2. The photometric completeness limits () in the two photometric fields F4 (=26.6) and F7 (=26.8) are shown as blue dotted lines. These photometric completeness magnitude limits are defined as to where the signal-to-noise over the entire photometric measurement is nine per pixel or greater, corresponding to a photometric error of approximately 0.12 magnitudes (Feldmeier et al., 2003). The confirmation rate for emission-line objects above the completeness limit is then 40-70% depending on the field. This is comparable with the results from A04 (30-80% varying by field), and is a reasonable recovery rate given the following effects.
Firstly, if the astrometry is not very precise or if some rotation error is introduced in positioning the plate, then part or all of the flux from some objects may miss the fibers. This is more serious for faint objects as they will then not be detected above the noise. Indeed, in Figure 3 the total flux in the [O iii]5007 Å line is not clearly correlated with the magnitude m5007 of the source, indicating that fiber positioning might be problematic. We measure the relative fluxes for the same [O iii]5007 Å detection in different frames and find that it can in fact vary by up to a factor of two.
The likelihood of having false candidates above the completeness limit is very low. Each candidate ICPN was hand-inspected, and the code that finds the objects has been extensively tested on closer galaxies. In some cases (e.g., M51, Durrell et al. (2003)), there has been close to 100% recovery, using the same techniques as used to select the candidate ICPNs here.
However, below the photometric completeness limit the uncertainties are clearly much higher. Although many of the fainter objects are still likely to be ICPNs and were hence targeted spectroscopically, the probability for ‘spillover’ (Aguerri et al. 2005) increases substantially. Due to the photometric errors in the [OIII] fluxes some objects will be measured with a brighter flux than their real flux. If in addition their broad-band fluxes fall below the limiting magnitude of the off-band image they will be selected as ICPNs when they are in fact very faint continuum stars, due to the fact that they will have erroneously large negative colours.
2.2 Spectra of PNs and background emission line galaxies
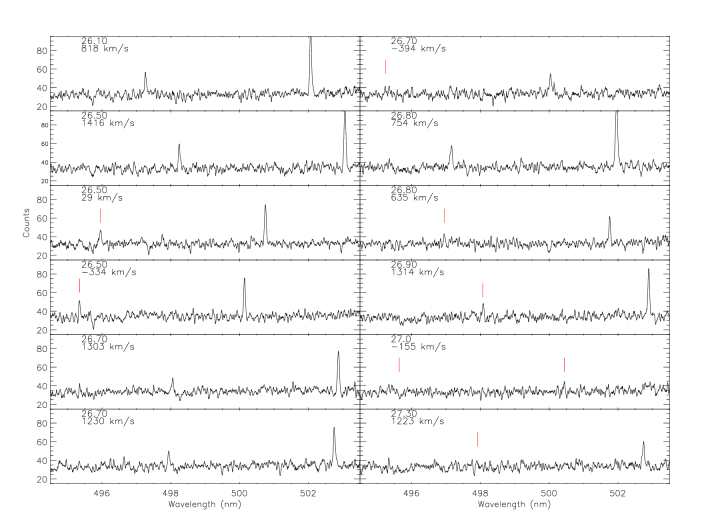
Figure 3 shows all of the spectra for the confirmed PNs, ranked by their photometric magnitude m5007. For most of the PNs brighter than m5007=27 we also detect the second line [O iii]4959. The expected location of [O iii]4959 is shown by a red dash, where not immediately obvious by eye. The target fields F7_1 and F7_2 overlap and have one source in common. The independently measured velocities for this source agree to within 3km s-1.


Our weakest believable detection has a total signal-to-noise ratio S/N=3. As an additional check we create the average combined spectrum for the 12 identified PNs (Figure 4) and measured the equivalent width ratio of the two [OIII] lines. The ratio is 3 as expected if all identifications are real.
In Figure 5, examples of the other emission-line objects present in the sample are shown: an [O ii] doublet, an asymmetric Ly line, and an unidentified broad emission line which might be an AGN (for example CIV1550 or CIII]1909). Alternatively, there is a possibility that the line is HeII at 1640Å in a LBG at higher redshift. Shapley et al. (2003) discuss that this is sometimes seen as nebular emission and also as much broader emission () possibly from stellar winds. The FWHM of the lines we see is about (observed frame). The contamination rate of these other emission-line objects is 7/19, or 37%.
The PN emission lines are all resolved, and thus we have been able to measure the expansion velocities of these PNs and to derive information on the masses of the progenitor stars. This work is presented in a companion paper (Arnaboldi et al., 2008). Here we concentrate on the kinematics, yielding information on the halo of M87 and the assembly history of the Virgo cluster.
3 LOSVD and projected phase-space
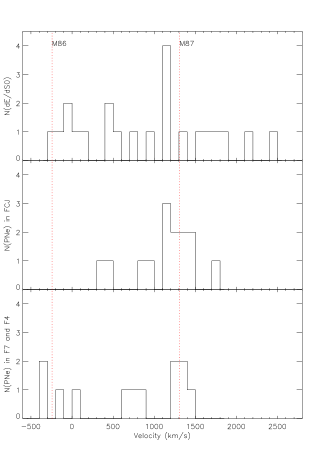
Figure 6 shows the distribution of velocities of the newly identified PNs in the Virgo cluster core. The velocities have not been adjusted for a heliocentric correction, as the observations were almost all taken close to the equinox and the correction is within only .
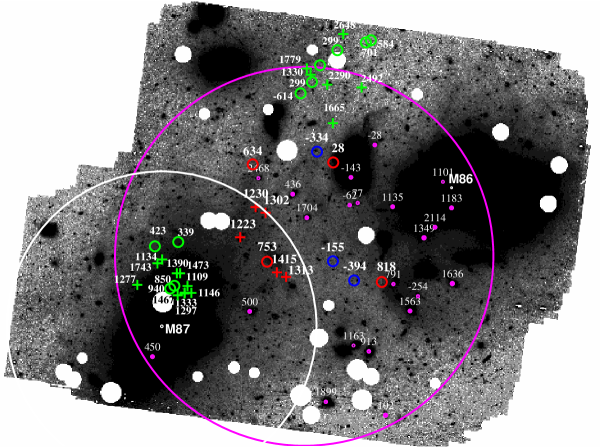
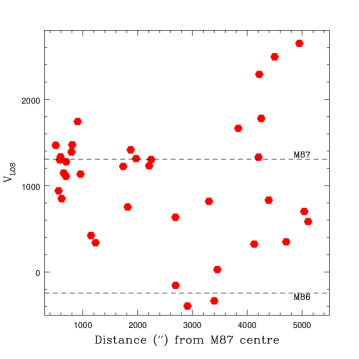
For the subsequent analysis, we combine these velocities with the A04 sample in the FCJ and Core fields. Figure 7 shows the location of these PNs on the deep image of the cluster core from Mihos et al. (2005), and Figure 8 shows their distribution in the projected phase-space plane defined by projected distance from M87 center and line-of-sight velocity.
In the phase-space diagram Figure 8, we can identify two regions with very different characteristics: For projected distances most of the PNs are strongly clustered around the systemic velocity of M87, km s-1. By contrast, for , the PN velocities spread widely over a velocity range more typical for the Virgo cluster. From the latter, intracluster region we see a string of low PN velocities (- km s-1), extending inwards to the upper FCJ field (see Fig. 7).
In the FCJ field at projected distance there are two of these intracluster outliers at km s-1. The remaining PNs are distributed symmetrically around and have mean velocity and velocity dispersion km s-1(A04); their velocity distribution is shown in the middle panel of Fig. 6.
In the combined new F7/F4 fields at we find five PNs tightly clustered around km s-1; these have mean velocity and an rms dispersion of . At comparable radii there are two additional PNs with velocities of 753 and 634 km s-1; compared to the previous five, these are and outliers. It is unlikely that one or two of these outliers are part of the same (very asymmetric) distribution as the five PNs clustered around . By contrast, they fit naturally into the stream leading from the FCJ outliers all the way into the ICL. We therefore identify as PNs bound to the M87 halo only those PNs which are clustered around the systemic velocity of M87. These are confined to radii .
The M87-bound PNs in the FCJ and combined F7/F4 fields are located at mean projected radii of 60 and 144 kpc, respectively. They correspond to the narrow peaks in the line-of-sight velocity distributions (LOSVD) in the lower and middle histograms in Fig. 6.
Outside in Fig. 8 we find PNs at larger relative velocities to M87, with an approximately uniform distribution in the range to km s-1. Those in the radial range (the F7/F4 field) are confined to negative velocities with respect to M87. These are probably encroaching stars from M86 and other Virgo components444They cannot be in the Local Group: the faintest PNs in the SMC have m5007=23 (Jacoby & De Marco, 2002) so are still much brighter than the brightest Virgo PNs at m5007=26.3.. By contrast, the PNs further than from M87 (in the Core field) show a broad distribution of velocities, more characteristic of the cluster as a whole (see A04).
In the middle and bottom panels of Fig. 6, the ICL PNs show up as approximately flat velocity distributions in their velocity range, besides the peak of velocities from PNs bound to M87. A flat distribution of velocities in addition to the peak near M87’s systemic velocity is also seen in the LOSVD of the dwarf spheroidal galaxies in the same region of the Virgo cluster core (Binggeli et al., 1993) which is shown in the top panel of Figure 6. However, for the dwarf galaxies the flat velocity distribution extends to significantly more redshifted velocities, indicating that the dwarfs and ICL PNs kinematics can only partially be related.
4 The M87 Halo
We have seen from the phase-space diagram in Fig. 8 that the PNs in the FCJ and F7/F4 fields divide into two components, one associated with the halo of M87, and the other with the unbound Virgo ICL. All PNs found around the M87 systemic velocity are within kpc projected radius from the galaxy’s center. In the following subsections we combine our velocity measurements with the kinematic data in the literature, and discuss the rotation, velocity dispersion profile, dynamics and truncation of the outer M87 halo. Finally we consider possible origins of the truncation.
4.1 Rotation of outer halo?
First we ask whether there is any evidence in our data for rotation in the outer halo of M87. For the globular cluster (GC) system of M87, Cohen & Ryzhov (1997) inferred a rotation of about 100 km s-1 for kpc, approximately about the minor axis of the galaxy intensity isophotes, using spectra of low resolution with errors for the GC velocities of order 100 km s-1. Cohen (2000) added new data for GCs in the halo at kpc with smaller errors (typically ), and inferred a rotation of 300km s-1. Côté et al. (2001) carried out an independent analysis using a new spectroscopic and photometric database (Hanes et al., 2001) partly based on that of Cohen & Ryzhov (1997) and Cohen (2000), and similarly find . Côté et al. (2001) found that the metal rich GCs rotate everywhere about the photometric minor axis of the galaxy, while the metal poor GCs have a more complex behaviour: they rotate about the photometric minor axis of the galaxy between kpc, and about the major axis at kpc.
If the PN population in the outer halo of M87 also rotated about the galaxy’s photometric minor axis, similarly to the M87 GC system at kpc, we should see a signature along the major axis of the galaxy, that is, the mean velocities of the PN LOSVD peaks associated with M87 in our two pointings FCJ (A04; this is F3 in Feldmeier et al., 2003) and F7/F4 (Figure 1) should be offset from the systemic velocity of the galaxy (1307 km s-1). From the extrapolated fit of Côté et al. (2001) to the GC radial velocities we would expect a negative constant offset of about km s-1at both field positions, i.e., a mean velocity of km s-1.
For the M87 sample of PNs identified in the phase-space diagram in Fig. 8, we find a mean velocity of in the new field (F7/F4) at mean projected radius kpc. In the previously studied field (FCJ; A04) the mean velocity is at mean kpc. Thus we see no evidence for rotation of the outer stellar halo around the galaxy’s minor axis in either the PN sample at kpc or at kpc. The rotation seen in the GCs may thus suggest that they do not trace the main stellar population of M87, or that they are contaminated with IC GCs with a LOSVD similar to the encroaching stars of M86 as seen in Fig. 8 (see also Fig. 1 of Côté et al., 2001). We have not surveyed fields along the minor axis, so we cannot check with PNs whether there is rotation about the major axis.
4.2 Velocity dispersion profile
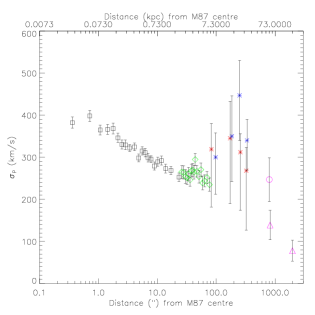
With the new data, we can also now plot the velocity dispersion profile of M87 all the way out to kpc from the centre of the galaxy. Figure 9 shows this as a function of projected radius from M87 centre. In the inner regions () we use the G-band absorption line measurements from the integrated stellar light of van der Marel (1994). In the region we use stellar velocity dispersions from Sembach & Tonry (1996). As these authors discuss, their data is systematically offset from most other datasets by , due to using a larger slitwidth. Romanowsky & Kochanek (2001) calculate that this amounts to an additional instrumental dispersion of 183km s-1 and so we adjust the velocity dispersion by this amount (subtracting in quadrature) to bring it in line with the van der Marel dataset. We take the average of the velocity dispersions at each positive and negative , assuming symmetry with respect to the galaxy’s center. We exclude the Sembach & Tonry data in radial bins beyond 80″ as there is a discrepancy between the velocity dispersions at the corresponding opposite positions in radius along the axis and furthermore the values in those bins have large error bars. This may be due to low S/N in the outer part of the galaxy where the surface brightness is low and/or real anisotropies in the velocity dispersions. Either way we judge it better to exclude these data points as they are less trustworthy.
We also show in Figure 9 the data of Côté et al. (2001) for the metal-rich GCs out to 380″. We exclude the outer bins (380″– 635″) where the error bars are close to 100% and therefore do not constrain the shape of the velocity dispersion profile in any way. The metal-poor GC system is more spatially extended than its metal-rich counterpart (see Figure 10 below and Côté et al., 2001) and may be composed of accreted and/or infalling remains of ‘failed’ or disrupted dwarfs: their velocity dispersion data are also shown in Figure 9, but do not trace the velocity dispersions of the M87 stars. We also note from Figure 1 of Côté et al. (2001) that the GC sample is likely to contain intracluster GCs just as our PN sample contains ICPNs, requiring a careful analysis of the GC LOSVDs.
Finally, the two outermost velocity dispersion points are from planetary nebulas presented in A04 and this paper. We note that when we bin the A04 data to be consistent with the binning of the velocity distribution in this work (100km s-1 bins) the peak around M87 is resolved into a somewhat narrower peak of 9 objects, with two lower velocity and one higher velocity outliers (Figure 9). The mean and rms velocity of this peak of km s-1 and km s-1from A04 then change to and respectively. It is possible that the larger value of obtained by A04 could be due to the inclusion of some ICPNs from the component with uniform LOSVD seen in Figure 6. We carried out tests555We carried out a test for the (FCJ;A04) sample and i) a broad Gaussian ( km s-1 and km s-1), ii) a uniform distribution plus a narrow Gaussian ( km s-1 and km s-1). Because of the limited statistics of the PN sample in this field, the results depend on the velocity range chosen for the test. In a km s-1 range, the two distributions fit the data equally well with probability, while the broad Gaussian is ruled out in a km s-1 range. but could not distinguish between both interpretations. The dynamical model discussed below favors the high value of at kpc.
In any case, the PN velocity measurements show that the halo of M87 becomes colder at larger radii: the velocity dispersion decreases to 78km s-1 at kpc.

4.3 Truncation of the M87 stellar halo
In the FCJ field, there are M87 halo PNs detected throughout, but in the F7/F4 fields, the PNs around the systemic velocity of M87 (=1307 km s-1) appear to be found only within a projected radius of kpc (see the spatial distribution of the spectroscopically confirmed PNs in Figure 7). At projected radii kpc from the center of M87, we find only the encroaching stars of M86 and other Virgo components. We now investigate whether this spatial and velocity segregation is significant and indicates that the M87 stellar halo is truncated.
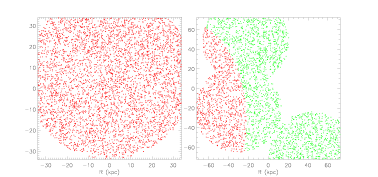
Kormendy et al. (2008) present a composite V-band surface-brightness profile for M87 out to 135 kpc along the semi-major-axis. This is shown with black circles in Figure 10, with the semi-major axis of each isophote replaced by the average ellipse radius, of the isophote. We will use the latter in the construction of the spherical Jeans models in § 4.4. Kormendy et al. (2008) fit a Sérsic profile to the semi-major axis profile excluding the central core and the last two data points (which may have a significant ICL contamination), and obtain the following best-fit parameters: , kpc, . We use this Sérsic fit to the surface brightness profile (see Fig. 10) to compute the luminosity of the M87 halo at radii outside the available photometry. We note that the description of M87 as a classical E0 or E1 galaxy is based on short exposure optical images, while in deep images its isophotes show marked eccentricity. For the extrapolation we assume an ellipticity and position angle (PA), based on the outer parts of the ellipticity and position angle profiles in Kormendy et al. (2008). We then evaluate the M87 halo luminosities in the regions of overlap between the photometric and spectroscopic fields, in which, respectively, the photometric identification and spectroscopic follow-up of the PNs was carried out. These are shown by the colored regions in Figures 11. For ellipticity , the PNs belonging to M87 appear to be found within an average ellipse radius kpc. We use the isophote corresponding to this radius to demarcate the region containing PNs belonging to M87 (in red in Fig. 11) from the region containing no PNs belonging to M87 (in green in Fig. 11). Table 2 gives the areas and the V-band luminosities of the various regions obtained. On the basis of the Sérsic fit, the ratio of the M87 luminosity in the F7-green and in the F7-red area is .
From the number of spectroscopically confirmed M87 PNs in the F7-red area (i.e., 5), and the ratio of the M87 halo luminosities from the Sérsic fit (i.e., 0.92), we can then predict the expected number of PNs at the M87 systemic velocity in the F7-green area, to be PNs. The observational result of zero M87 PNs detected in the F7-green area thus implies a truncation of the M87 stellar halo at kpc, at a level. This radius tells us the location of the outermost PN in terms of the average ellipse radii and we now refer to it as the truncation radius .
| Field | Nspectr | Area | L |
|---|---|---|---|
| kpc2 | LV,⊙ | ||
| FCJ red | 12 | 4157 | |
| F7 red | 5 | 4349 | |
| F7 green | 0 | 8909 |
This is a surprising result: the numerical simulations of Abadi et al. (2006) find that the luminous halos around isolated galaxies should extend to the virial radius, i.e., to several hundred kpc and well beyond their traditional luminous radius. It is therefore not obvious why there should be a truncation of the M87 stellar halo, see Section 4.5. One question is whether the truncation we see occurs only at the targeted within an opening angle , say, rather than at all azimuths, and whether when azimuthally averaged, the halo light distribution would extend to larger radii. This could be the case if we had reached the radii where the stellar halo of M87 has a significant amount of substructure, similar to the outer Milky Way halo (Bell et al., 2008). For example, we might explain the spatial segregation of the M87 halo PNs in terms of a cold stellar shell at our field position, followed by a steeper surface brightness profile at those whereas at other the profile would be shallower. This would also explain the small that we measure in our fields at kpc, as the stars populating shells are near to the apocenters of their elongated orbits.
To assess this we must reconsider the photometric structure of M87. Within a semi-major axis of kpc and , the surface brightness distribution around M87 is well approximated by an extended envelope with (Mihos et al., 2005; Kormendy et al., 2008). This ellipsoidal component includes the diffuse fan of stellar material, which extends along the projected southeast semi-major axis out to kpc (Arp & Bertola, 1971; Weil et al., 1997), but is otherwise fairly smooth. At larger radii and fainter surface brightnesses, the light distribution is a superposition of the outer halo of M87 and the ICL and is brightest in the range of towards M86 where our target fields are. At these radii it does show irregular features and some radial streamers, and our fields are large enough to include several of these. In fact, some of our outermost M87 PNs may be close to an arc-like feature in the Mihos et al. (2005) image beyond which little light is seen. However, both the earlier results of Weil et al. (1997) who reported the apparent lack of sharp-edged fine structures around M87, and our independent inspection of the Mihos et al. (2005) image near M87, provide no evidence for a large number of “shell-like” features at various azimuths and radii around M87. This is true both inside and outside our truncation isophote, and in particular around kpc, where the PN data already indicate a falling velocity dispersion profile (see Fig. 9).
Further investigation of the extended luminosity distribution around M87 would require quantitative photometry of the deep image of Mihos et al. (2005), and a large-area and wide-angle PN velocity survey to separate the outer halo of the galaxy from the ICL with better statistics.
In what follows, we follow an independent approach and test the hypothesis of a truncated stellar halo in M87 dynamically. We will verify whether we can make a dynamical model for M87 in which the stellar velocity dispersion reaches low values everywhere around M87, and the total gravitational potential is traced by the X-ray emission of the hot gas.
4.4 The mass distribution and anisotropy in the M87 outer halo
The smooth photometric and X-ray emission profiles indicate that the outer halo of M87 is in approximate dynamical equilibrium. With the extended velocity dispersion profile we are now able to create dynamical models of M87 to infer the orbital structure in the outermost halo. In a spherical system, the intrinsic velocity dispersions of a population of stars with density moving in a potential are related by the second-order Jeans equation
| (1) |
where the anisotropy parameter quantifies the orbital structure of the system. Its value spans a range between signifying purely tangential orbits and signifying purely radial orbits. These intrinsic quantities are now in terms of the three-dimensional radius, .
Therefore if we know the potential , density of stars and assume a radial dependence for the anisotropy, we can solve for the intrinsic radial () and tangential () velocity dispersion profiles. These can then be projected and compared with the observed projected velocity dispersion profile to fix the parameters of the assumed anisotropy profile. Under the spherical assumption, the radii of the observables will be the average ellipse radii introduced in § 4.3.
One method of deriving the potential of a galaxy is to use electron density and temperature profiles obtained from X-ray measurements of the thermal bremsstrahlung emission from the hot interstellar medium surrounding massive elliptical galaxies. If the gas is relatively undisturbed then we can assume that the gas is in hydrostatic equilibrium and thus derive the potential.
Nulsen & Böhringer (1995) use data and a maximum likelihood method to deduce the most likely mass profile in the Virgo cluster core, extending from the centre of M87 out to 300 kpc. They parametrize this profile with a model composed of two (approximate) isothermal mass distributions, one attributed to the mass of M87 with a mass per unit length kpc-1 and the other to the dark matter of the cluster with a mass per unit length kpc-1 and a core radius kpc. This parametrization is given as
| (2) |
This mass profile is related to the potential through , where is the circular velocity at . It is more easily calculated than the potential but also independent of distance. The circular velocity profile is shown in Figure 12 and increases from a minimum circular velocity of 393 kms-1 to eventually a maximum velocity of 830 kms-1. For comparison the same profile is shown with adjusted so that the maximum velocity reached is 700 kms-1, the value suggested by the extrapolation of newer observations taken with XMM-Newton (Matsushita et al., 2002).

The density of the stars was obtained through the deprojection of the surface-brightness profile of M87. To obtain the intrinsic luminosity density, we adopt the Kormendy et al. (2008) profile (also missing the last two data points), and using their Sérsic fit, extrapolate to very large radii, see § 4.3; then we employ the standard deprojection formula. In Figure 10, the Sérsic extrapolation is shown by the red circles and the reprojection of the intrinsic luminosity density is shown by the solid black line which follows the circles very well.
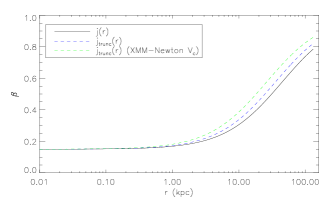
Finally, the radial dependence we adopt for the anisotropy profile is given by
| (3) |
where , is the maximum anisotropy reached at large , is the minimum anisotropy and represents the scale of the transition from the minimum anisotropy to the maximum anisotropy. This solves the Jeans equation (1) as a first-order differential equation with the integrating factor
| (4) |
where so that
| (5) |
Then the projected velocity dispersion, , is obtained by projecting the intrinsic velocity dispersions along the line of sight. These integrals were determined numerically.
To obtain a dynamical model for the Sérsic light distribution in the potential implied by Fig. 12, we fixed the minimum and maximum anisotropy using constant anisotropy models and then employed a minimization approach to deduce the best-fit for the solution in eq. 5. This minimization takes into account the long-slit data, the point at 60 kpc from A04, and the new point at 144 kpc, but not the globular cluster data. The best-fit model is shown by the solid black line in Figure 13. It fits the data very well within 6 kpc but it is unable to reproduce the low PN velocity dispersions in the outer parts, at kpc and kpc, where it would predict LOSVDs with dispersions of 350-400 km s-1.
On the basis of the results in § 4.3, we assume now that the galaxy’s intrinsic luminosity density is truncated at kpc (i.e., in a spherical system the intrinsic truncation radius is the same as the projected truncation radius). The reprojection of this truncated intrinsic luminosity density is also shown in Figure 10 by the blue dashed line. We construct a Jeans model for the truncated luminosity distribution in the same way as above. Finally, to check the influence of the assumed potential on the results, we have evaluated one further model, also assuming a truncation in the luminosity density but using the circular velocity that was adjusted to the analysis of XMM-Newton observations in Matsushita et al. (2002). The corresponding Jeans models are shown in Figure 13 with the blue and green dashed lines respectively, with the second model dipping slightly lower in the outer parts, reflecting the lower potential in this region.
Both truncated models behave as the untruncated Sérsic model in the center, but fall much more steeply at radii kpc, thus being able to reproduce the outermost data points at and kpc (corresponding to projected radii and kpc). At kpc, the truncated models predict a velocity dispersion which favours the higher value of , i.e., 247 km s-1. Figure 14 shows that the best-fit models imply a mildy radially anisotropic orbital distribution () in the centre that becomes highly radially anisotropic in the outer halo ().
We conclude that, under the assumption of spherical symmetry, the Jeans models can only reproduce the low PN velocity dispersion measurements in the outer halo of M87 at kpc only with a truncation of the intrinsic luminous density.
In principle, this dynamical argument could be circumvented if at the position of our outer fields the stellar halo of M87 was strongly flattened along the line-of-sight. In this case could be low at these radii independent of a truncation. However, at kpc radius such a flattening is likely to be local and would have arisen from the geometry of accretion, rather than signifying an angular momentum supported global structure collapsed from even times further out. Thus the well-mixed, three-dimensional stellar halo of M87 would then have ended at even smaller radii. Also note that in this case we could still not explain the lack of PNs at the M87 systemic velocities for radii greater than (see Fig. 8 and the discussion in § 4.3.)

4.5 On the possible origin of a truncated stellar halo in M87
Summarizing the last two sections, there are two independent and mutually consistent pieces of evidence that the stellar halo of M87 ends at kpc: the lack of PNs around the systemic velocity of M87 beyond this radius, and the very low velocity dispersion in the outer halo.
In well-mixed, dense galaxy clusters it is expected that galaxies are tidally truncated by the cluster’s tidal field (Merritt, 1984; Ghigna et al., 1998). The tidal effects are strongest near the cluster core radius and the approximation for the tidal radius is found to work well. Here is the pericenter of the galaxy’s orbit in the cluster, and and are the velocity dispersions of the galaxy halo and the cluster, respectively. The tidal truncation of the dark matter halos of galaxies has been detected with combined strong and weak lensing observations in several dense clusters (Natarajan et al., 1998, 2002; Limousin et al., 2007; Halkola et al., 2007). Tidal radii of between and kpc have been found, in agreement with predictions.
The case of M87 is not so simple though. M87 is at the center of at least a subcluster potential well, traced by the X-ray emission and the dark matter mass profile derived from it (Nulsen & Böhringer, 1995; Schindler et al., 1999, see Fig. 12). A galaxy at the center of its cluster experiences a symmetric gravitational field from the cluster dark matter, and is consequently not gravitationally truncated (Merritt, 1984). On the other hand, M87 has a relative motion of km/s with respect to the galaxies in the cluster core (Binggeli et al., 1993), and the galaxy distribution in the core is complicated and not centered on M87, containing a strong concentration around M84/M86 (Binggeli et al., 1987). It is possible that the M84/M86 concentration including the associated dark matter exerts a significant tidal field on M87. There is no obvious feature in the density of the X-ray emitting gas at kpc around M87, but because the total mass within the truncation radius appears to be already dominated by cluster dark matter, a tidal truncation of the M87 mass distribution may be difficult to see in X-ray observations. However, if M87 was currently tidally truncated by a tidal field with assumed mass center towards M84/M86, we would expect to see some of the tidally dissolved stars as PNe in our outer F7 fields at slightly redshifted velocities with respect to the systemic velocity. Within the limited statistics, we do not see any PNs with such velocities outside a projected radius of 161 kpc, see § 4.3. This suggests that if there has been a tidal truncation, it would have occurred some time ago during the interaction with another mass concentration. The most likely candidate in the Virgo core may be that around M84; at a relative velocity with respect to M87 of about 300 km s-1, M84 could have travelled their current projected separation in Gyr.
On the other hand, due to the dynamical youth of the Virgo cluster, it is also possible that M87 has not been tidally affected yet, and is more similar to an isolated massive elliptical galaxy. As already mentioned in § 4.3, the luminous halos around isolated galaxies are expected from numerical simulations (Abadi et al., 2006) to extend to the virial radius, i.e., to several hundred kpc, and well beyond their traditional luminous radius. Hence we now consider the possible origins of the truncation of the M87 stellar halo in the context of isolated galaxies.
One possible explanation might lie in the fact that M87 is an old galaxy with a massive nuclear black hole, which points to much stronger AGN activity in the past than is apparent now. The feedback from its AGN through the surrounding hot gas might at some redshift have stopped the star formation in nearby satellite galaxies through, e.g., ram pressure stripping. When these satellites later accreted onto the galaxy, they would have predominantly added dark matter to the outer halo, so that the virial radius of M87 kept growing, but the luminous radius stalled at . On this assumption, we can estimate from the redshift dependence of the virial radius.
The X-ray observations show that the hot gas extends out to 300 kpc (Nulsen & Böhringer, 1995; Matsushita et al., 2002). The derived integrated mass profile of the total gravitating matter shows a change in slope at about 30 kpc (Matsushita et al., 2002), and then increases linearly at large radii (see Fig. 12 above). The mass distribution inferred from the X-ray measurements thus provides evidence for two components: a galaxy dark matter component and a cluster dark matter component. From the modeling of Nulsen & Böhringer (1995) and the rotation curve in Fig. 12 we can estimate the maximum circular velocity generated by the M87 galaxy halo now to be . Using the results of Bullock et al. (2001), this corresponds to a present-day virial mass and virial radius kpc, several times larger than the truncation radius inferred from both the PN number counts and the outer halo dynamics, kpc. For the same , the virial radius of M87 would have been kpc at redshift , arguing that feedback would need to have been effective quite early-on to explain the observed truncation radius.
A second possible explanation would assume that the accretion of dark matter and satellites onto M87 ceased with the collapse of the Virgo cluster core. In the new potential after the collapse, the satellites would both have been deflected from their nearly radial orbits with respect to M87, and have significantly larger impact velocities than previously, making accretion and merging with M87 suddenly less likely. The total mass of M87 would thus not increase any further, stalling at the virial mass at that redshift. Moreover, the rotation curve in Fig. 12 shows that with the on-going collapse of the Virgo cluster a substantial cluster dark matter cusp has since built up within the halo of M87. The likely effect of this is an adiabatic contraction of the galaxy’s luminous and dark halo.
The two-component mass model of Nulsen & Böhringer (1995) (see equation 2) for the present-day mass distribution predicts within kpc, a galaxy mass of and a cluster dark matter mass of , assuming a flat rotation curve for the galactic contribution to the mass. The luminous mass of M87, (4-5) (Cappellari et al., 2006), is consistent with the estimated total galaxy mass. As an example, consider truncation of the accretion onto M87 by the collapse of the Virgo core at redshift . Using a lower for the M87 halo before adiabatic contraction and again the results of Bullock et al. (2001), the virial mass and radius at that redshift become and virial radius kpc. An (over)estimate of the adiabatic contraction can be obtained from angular momentum conservation at the outer radius, i.e., , giving . This suggests that the observed truncation radius could well be the relic of the virial radius from the time when the cluster core collapsed.
It is clear that more data are needed to pursue this question further. In particular, a larger number of PNs all around M87 would be very useful to set stronger constraints on the tidal hypothesis.
5 The luminosity-specific PN number for the M87 halo and the ICL in Virgo
The physical quantity which ties a PN population to the luminosity of its parent stars, is the luminosity-specific PN number , where is the number of all PNs in the population666This is given by the integral over the whole eight magnitude range of the Planetary Nebula Luminosity Function (PNLF). and is the bolometric luminosity of the parent stellar population. Observations show that this quantity varies with the color of the stellar continuum light (Hui et al., 1993), and simple stellar population models predict that it is a function of the age and metallicity of the parent stellar population (Buzzoni et al., 2006). Furthermore, within the framework of single stellar populations models, the parameter quantifies the average PN lifetime (Villaver et al., 2002; Ciardullo et al., 2005) via the relation , where is the ‘specific evolutionary flux’ and is nearly constant (see Buzzoni et al., 2006, for a detailed discussion). The PN samples in elliptical galaxies and the ICL are all confined to the brightest 1 to 2.5 magnitudes of the PNLF. Therefore we use the parameter, defined in terms of , the number of PNs down to 2.5 magnitudes below the PNLF cut-off: equals about one tenth of according to the double exponential formula of Ciardullo et al. (1989) for the PNLF.
We can use the number of photometrically detected PNs in the FCJ, F7/F4 fields, and the luminosities of both the M87 halo and the ICL populations sampled in the surveyed areas, to compute the values for these two components. Since the M87 halo and the ICL coexist at the two field positions, we determine the fraction of the PNs in the photometric sample bound to the M87 halo or in the ICL according to the fraction of spectroscopically confirmed PNs associated with each component in the LOSVD, i.e., with the narrow M87 peak or the nearly uniform velocity distribution for the ICL.
Luminosity of the ICL - We estimate the luminosities of the ICL stellar population in our fields from the deep photometry of Mihos et al. (2005). Such surface brightness measurements for the diffuse light generally contain the cumulative contributions from extended galaxy halos, the true ICL, and from excess unresolved background galaxies above that adopted from the sky subtraction. Depending on the method of sky subtraction, the homogeneous part of the last component may be included in the sky measurement. The photometry of Mihos et al. (2005) shows a ‘plateau’ of the surface brightness at a value of half way between M87 and M86, where the F7/F4 fields are situated. As we have seen in Sections 4.3, 4.4, there is no contribution from the halo of M87 to the plateau. Williams et al. (2007) estimate the surface brightness of background galaxies from their deep imaging survey with the Hubble Space Telescope’s Advanced Camera for Surveys (ACS), in a small (intracluster) field within our field F4. These galaxies, which are resolved in the ACS data, would contribute a diffuse surface brightness of in ground-based data. The sky subtraction procedure adopted by Mihos et al. (2005) would have already subtracted this component if its surface brightness is similar in the edges of the mosaic where the sky was measured. In the following, we therefore use for the ICL surface brightness in this region, with a possible uncertainty of a few tenths of a magnitude due to a possible inhomogeneity of the background sources.
The values and their implications - In what follows we make the assumption that the ICL surface brightness is constant in the FCJ, F7/F4 fields at this value of mag arcsec-2. In Table 3 we give the corresponding ICL luminosities and the number of spectroscopically confirmed PNs from the ICL in these fields, . In Table 4 we give the number of PNs in the complete photometric samples in the overlap area covered by the spectroscopic follow-up, , and the fraction of PNs in the M87 halo and the ICL according to their measured LOSVDs. Because of the small number statistics, we compute for the M87 halo in FCJ, and for the ICL in F7, where their respective contributions are largest.
| Field | Nspectr | Area | L |
|---|---|---|---|
| kpc2 | LV,⊙ | ||
| FCJ red | 2 | 4157 | |
| F7 red + green | 7 | 13258 |
| Field | Nphot | Nphot | Nphot |
|---|---|---|---|
| M87 | ICL | ||
| FCJ | 16a | 14 | 2 |
| F7 | 24b | 10 | 14 |
a Number of PNs above the photometric completeness limit from Aguerri et al. (2005). b Number of PNs above the photometric completeness from Table 1 in F7_1 and F7_2.
The of each field is scaled by a factor
| (6) |
where PNLF(m) is the analytic expression for the PNLF (Ciardullo et al., 1989), and denote the absolute and apparent magnitude of its bright cutoff, respectively, and is the photometric limiting magnitude in each field. This scaling ensures that we account for all PNs within 2.5 mag of .
The V-band luminosities in each field are converted to bolometric luminosities according to
| (7) |
According to Buzzoni et al. (2006), a value of mag can be taken as a representative correction for all galaxy types within 10% uncertainty.
Finally, we obtain the bolometric luminosity-specific PN number : For the M87 halo light at the FCJ position it is PN L, and for the ICL at the F7 position it is PN L. The values of for different stellar populations are well documented (Ciardullo et al., 2005; Buzzoni et al., 2006; Coccato et al., 2009): in the range PN L are observed for bright ellipticals and S0s. Both the values obtained for the ICL and for the M87 halo stars are consistent with those of old ( Gyr) stellar populations.
Uncertainties in the values - The luminosity of the M87 halo is computed using Monte Carlo integration of the Sérsic fit to the surface brightness from Kormendy et al. (2008) in the FCJ field, and the errors here are of the order of few percent.
The luminosity of the ICL is computed using from Mihos et al. (2005). We independently estimated the ICL surface brightness by comparing the reprojected surface brightness profile of the M87 halo with the Sérsic fit of Kormendy et al. (2008) in the F7 field. This results in an azimuthally averaged ICL . While fainter than the measurement of Mihos et al. (2005), the two values may be quite consistent when taking into account that the ICL is observed mostly on the side of M87 towards M86/M84.
Considering the uncertainties in the surface brightness for the M87 halo and ICL, and the statistical errors in the number of detected PNs, the values for M87 and ICL differ at the level. We speculate that is a factor 2 larger than because of different metallicity distributions in the ICL and the M87 halo, with a larger fraction of metal-poor stars in the intracluster component, as shown by Williams et al. (2007).
6 ICL and the dynamics of the Virgo cluster core
6.1 ICPNs and dwarf spheroidals
The LOSVDs in Figure 6 show the dynamical components in the Virgo cluster core: the halo of M87, and the ICL component traced by a broad PN velocity distribution. This component covers the velocity range from 1300 km s-1 down to the systemic velocity of M86 at -244 km s-1. Overlaying the spatial coordinates of the PNs on the deep image of the Virgo cluster core (Figure 7; Mihos et al. (2005)) we can easily see the association of the PN components identified in the velocity - position space, with the morphological components of the surface brightness distribution in the Virgo core. The M87 PNs are confined to still relatively bright regions covered by the M87 halo, while the ICL PNs are scattered across the whole region.
For comparison, we examine the phase space distribution of dwarf elliptical galaxies in a region covering our target fields for the PNs spectra, i.e., in a 1.5 degree diameter circle centred on the midpoint of M87 and M86 (Figure 7). The aim is to search for possible associations between our ICPNs and the positions and velocities of the dwarf galaxies. The top panel of Figure 6 shows a histogram of the LOS velocities for all dwarfs in the region marked in Figure 7. The velocities form a flat, uniform distribution extending to larger positive velocities than the ICPNs. We ask whether any of the PNs could be physically associated with the dwarf galaxies. There are only two potential associations: one is between a PN with velocity 818km s-1 and a close-by dE at 791km s-1. This dE has total blue apparent magnitude 15.4, i.e., MB=-15.48 (using the assumed distance) or =. According to Ciardullo et al. (2005), galaxies fainter than M and bluer than produce about one [O iii]-bright PN in every . It is therefore unlikely that the dwarf galaxy in question produced the PN detected here (as the expected number is 0.35) although it cannot be ruled out completely. On the other hand, the second association may well be genuine: this is of a PN with velocity +28km s-1 and a close-by Sb spiral galaxy to its west, which has velocity 30km s-1 and =10.91 (and therefore is capable of producing between 85 and 2000 PNs depending on its age, see Buzzoni et al. 2006).
Although the majority of the ICPNs do not appear to be physically associated with the dwarf galaxies (i.e., the PNs are unlikely to originate in the dwarfs), their distribution in velocity space is at least partially similar, indicating that they follow similar dynamics.
6.2 Dynamical status of the Virgo core
The velocity distribution of dwarf spheroidals (dE+dS0) in a radius circular region centred on M87 is very flat and broad, with the peak of the distribution at 1300 km s-1 and a long tail of negative velocities (Binggeli et al., 1993). The LOSVD of the ICPNs now confirms that this asymmetry is also present in the very center of the Virgo core, in a region of diameter. Fig. 8 shows that velocities near the systemic velocity of M86 are seen to about half-way from M86 to M87.
The asymmetry and skewness of the LOSVD may arise from the merging of subclusters along the LOS as described by Schindler & Böhringer (1993). In their simulations of two merging clusters of unequal mass, the LOSVD is found to be highly asymmetric with a long tail on one side and a cut-off on the other side, shortly ( yrs) before the subclusters merge.
The observed LOSVDs of the PNs, GCs (Côté et al., 2001), and (dE+dS0) in the Virgo core may therefore be interpreted as additional evidence that the two massive subclusters in the Virgo core associated with the giant ellipticals M87 and M86 are currently falling towards each other - more or less along the LOS, with M87 falling backwards from the front and M86 forwards from the back - and will eventually merge, i.e. the entire core of the Virgo cluster must then be out of virial equilibrium and dynamically evolving.
The distribution of the brightest galaxies in Virgo also favors a recent and on-going assembly: West & Blakeslee (2000) found that Virgo’s brightest elliptical galaxies tend to be aligned along the principal axis of the cluster (which is inclined by only about 10-15 degrees to the line of sight) and which on larger scales connects Virgo to the rich cluster Abell 1367. This work suggests that the formation of the cluster is driven by infall along this filament.
Do the halos of M87 and M86 already touch each other, or are they just before their close pass? PNLF distances (Jacoby et al., 1990) and ground-based surface brightness fluctuation distances (Tonry et al., 2001) indicate that M86 is behind M87 by just under 0.15 magnitudes. The globular cluster LF turnover also suggests that M86 is likely 0.1 to 0.2 magnitudes more distant than the main body of Virgo (Kundu & Whitmore, 2001). However, the most recent surface brightness fluctuation measurements by Mei et al. (2007) find that M87 and M86 are only at very slightly different distances. Within the errors, the distance moduli (M87: , M86: ) are consistent with being either at the same distance or separated by 1-2 Mpc. Unfortunately the evidence from the relative distances of M87/M86 is not conclusive at this stage.
6.3 Implications for the formation of the ICL
The observational facts concerning the ICL in the Virgo cluster core are:
-
1.
The LOSVD of the ICPNs is not symetrically distributed around the systemic velocity of M87. Those between M87 and M86 are mostly at ‘bluer’ velocities, i.e., km s-1. “Red” velocities are only seen in the field north of the line connecting M87 with M86; see Fig. 7.
-
2.
While the dwarf spheroidals’ (dE+dS0) LOSVD in the region marked in Figure 7 extend into ‘red’ velocities, up to 2500 km s-1, ICPNs with velocities greater than 1800 km s-1are seen only at its northern perimeter, while those in the region between M87 and M86 are confined to km s-1(see Figs. 6, 7, 8). This is not a consequence of the filter used in the photometric selection of these objects, which still has a transmission of 50% to [OIII]5007 at 2275km s-1 (Feldmeier et al., 2003). 777There may be a different, small selection effect due to the finite limiting magnitude of the photometric PN survey, as the ICPN that we detect are slightly biased towards objects on the near side of the cluster core.
-
3.
The morphology of the ICL between M87 and M86 is ‘diffuse’; it is mostly not in tidal tails or streams (Mihos et al., 2005).
-
4.
The measured parameter for the ICL is in the observed range for old stellar populations.
- 5.
Point 1) indicates that the ICL did not have the time to phase mix yet, supporting the idea that much of this diffuse component is falling towards M87 together with the M86 group. Points 2) and 3) argue against the origin of this ICL from current harrassment of dwarf irregulars by the cluster potential (Moore et al., 1996), firstly because none of the ICPNs between M87 and M86 are found at velocities redder than 800 km s-1, while we see nearby dwarf galaxies in the km s-1 range, and secondly because the diffuse morphology of the ICL suggests that it has not recently been dissolved from the dwarfs, but had time to phase mix at earlier times in the sub-component of the Virgo cluster which is now falling towards M87. Points 4) and 5) indicate that the parent stellar population of the ICPNs is an old population, and point 5) makes dwarf spheroidals unlikely progenitors (recall that the dSph analyzed by Durrell et al. (2007) had a narrow metallicity distribution at [Fe/H]). Dwarf elliptical galaxies have a wider metallicity distribution, and they could be disrupted during passages through the high-density regions around M87. Some of the observed ICPNs could trace stars on a stream from such a disruption event (particularly, those at km s-1), but those at low velocities in Fig. 8 are falling in with M86, so have not crossed the dense regions yet. Point 3) then implies that these must have been part of the diffuse halo of the M86 group.
We conclude that we have found observational evidence in the Virgo core for the mechanism described by Rudick et al. (2006): we observe the diffuse component ‘pre-processed’ in the M86 sub-group, which is or has been gravitationally unbound from M86 as this substructure is being accreted by M87. The idea that the diffuse light is being stripped from the M86 sub-group is consistent with the observed highly skewed LOSVD and with the predictions from the simulations of Schindler & Böhringer (1993). Note that the light in the M86 subgroup is tidally stripped by the more massive M87 component, while these two sub-structures merge along the LOS; we do not see a diffuse ICL with a broad velocity component redwards of the systemic velocity of M87, because it has not yet been formed.
This scenario is also consistent with the simulations of Murante et al. (2007). Their statistical analysis of the diffuse star particles in a hydrodynamical cosmological simulation indicates that most of the ICL is associated with the merging tree of the brightest cluster galaxy, and about 80% of the ICL is liberated shortly before, during and shortly after major mergers of massive galaxies. The results from Murante et al. (2007) imply that the main contribution to the ICL comes from merging in earlier sub-units whose merger remnants later merge with the final cD galaxy. Similarly, Rudick et al. (2006) predict that violent merging events quickly add ICL, and without or between these events, the ICL fraction rises only slowly. Once the M86 subgroup has finally merged with M87, this will have created the most massive galaxy in the then Virgo cluster, and the ICL in the future Virgo core will indeed have originated mainly from the progenitors associated with its merging tree.
7 Summary and Conclusions
Using high resolution multi-object spectroscopy with FLAMES/MEDUSA on the VLT we confirm a further 12 PNs in the Virgo cluster, located between and kpc from the center of M87, and obtain their radial velocities. For most of these objects we also detect the second line [O iii] 4959Å. These PNs trace the kinematics of diffuse light in Virgo, at typical surface brightness of .
The phase-space distribution for the new sample of PN velocities combined with earlier measurements at and kpc from M87 illustrates the hierarchical nature of structure formation. One group of PNs has an unrelaxed distribution of velocities with a range characteristic for the still assembling Virgo cluster core, while the second group has a narrow velocity distribution which traces the bound, cold outer halo of M87. We summarize our results for these two groups in turn.
7.1 Dynamical status of the Virgo cluster and origin of the ICL
Seven of the newly confirmed PNs are genuine intracluster PNs in the Virgo core, not bound to M87. Their spatial and velocity distribution indicates that we are witnessing the gravitational stripping of the diffuse light component around the M86 group, as this sub-structure is being accreted by the more massive M87. We do not see a diffuse ICL with a broad velocity distribution including red-shifted velocities around M87, because it presumably has not been formed yet.
On the basis of the LOSVDs of ICPNs and galaxies in the Virgo core, we surmise that M87 and M86 are falling towards each other nearly along the line of sight, and that we may be observing them in the phase just before the first close pass. We thus conclude that the heart of the Virgo cluster is still far from equilibrium.
Finally, the values determined for the ICL indicate an old stellar population. This is consistent with the analysis by Williams et al. (2007) of the colour-magnitude diagram (CMD) for ICL red giant stars, which showed an old stellar population ( Gyr) with a large spread of metallicities. Differently, the CMD for a nearby dwarf spheroidal galaxy indicates a similarly old, but metal-poor stellar population (Durrell et al., 2007). Together with the observed distribution of the ICPNs, these results suggest that at least some of the ICL in Virgo originates from stars unbound from the brightest and most massive galaxies.
7.2 The M87 halo
The other five of the newly confirmed PNs are associated with the bound halo of M87, at a mean projected radius kpc from the centre of the galaxy. These PNs have velocities close to the systemic velocity of M87, with a small dispersion, and are furthermore segregated spatially from the rest of the (intracluster) PNs, as shown in Figs. 7 and 8.
The LOSVDs of the M87 PNs both in the new fields and in the FCJ field of A04 are consistent with no rotation of the outer halo around the photometric minor axis, outside kpc. We cannot test whether the halo is rotating around the major axis. The rms velocity dispersion for the 5 M87 PNs at 144 kpc is km s-1, much smaller than the central velocity dispersion. Together with the results of A04, this indicates that the M87 halo becomes ‘dynamically’ cold beyond 50 kpc radius.
The PNs around the systemic velocity of M87 are confined to radii kpc. The absence of M87 PNs at larger radii with respect to the extrapolated Sérsic fit to the surface brightness profile from Kormendy et al. (2008), despite being based on small numbers, is significant at the level. This suggests that the edge of M87 has been detected, and it occurs at quite a large average ellipse radius - kpc.
We have tested the hypothesis of a truncated stellar halo dynamically, using the observed stellar kinematics of the M87 halo. Combining all the velocity dispersion data available in the literature with our new M87 data, we have solved the spherical Jeans equation assuming a total gravitational potential as traced by the X-ray emission. Within this framework, the Jeans model is able to reproduce the ‘cold’ PN velocity dispersion in the outer halo of M87 only if (i) the orbital structure in the outer halo becomes highly radially anisotropic, with at kpc, and (ii) the intrinsic luminous density is truncated. This dynamical argument can be circumvented only if the stellar distribution were strongly flattened along the line-of-sight in the surveyed fields. At these radii this flattening would be local and imply that the spheroidal stellar halo would end at even smaller radii.
The evidence for the truncation of the luminous halo of M87 thus comes from both the spatial distribution of the PNs with velocities near the systemic velocity of M87 (Fig. 8), and from the small velocity dispersions in both the A04 field and in the new fields near the outer edge.
The reason for the truncation is not obvious; we discuss possible mechanisms in Section 4.5. Differently from some dense clusters where lensing analysis indicates that galaxies outside the cluster center are tidally truncated by the dark matter cusp of the cluster, M87 in Virgo is located at the center of the deepest potential well traced by the X-ray isophotes. We also do not see unbound PNs with velocities near 1300 km/s further out from M87. This suggests that if there has been a tidal truncation, it would have occurred some time ago during the interaction with another mass concentration, such as around the other massive galaxy in the Virgo core, M84. Alternatively, due to the dynamical youth of the Virgo cluster, it is also possible that M87 has not been tidally disturbed yet, and is more similar to an isolated massive elliptical galaxy and should thus still be accreting matter (Abadi et al., 2006). In this case possible explanations for the truncation could be early AGN feedback effects that indirectly truncate star formation in accreting satellites, or adiabatic contraction of the M87 halo due to cluster dark matter collapsing onto the galaxy.
The existing data cannot discriminate between these scenarios. The next step in this project is therefore to obtain a sample of at least a few hundred measured PN velocities covering the whole M87 halo. This is required to verify that the velocity dispersion decreases everywhere around the galaxy, and to obtain statistically better constraints on phase-space structures in the surrounding ICL, including possible stars tidally dissolved from M87. With a homogenous imaging and spectroscopic PN survey covering the whole halo of M87 out to 40 arcmin we will be able to accurately measure the rotation, radial anisotropy of the orbits, and truncation of the outer halo of M87.
Acknowledgements.
We wish to thank Nando Patat for carrying out the observations in service mode, and Marina Rejkuba and Sandro Villanova for advice in using the GIRAFFE pipeline. We thank Ken Sembach for providing his velocity dispersion data in digital format, John Kormendy for giving us the surface brightness profile data for M87 and the parameters of the best Sérsic fit before publication, and Ralf Bender, James Binney and Karl Gebhardt for useful discussions. PD was supported by the DFG Cluster of Excellence.References
- Abadi et al. (2006) Abadi, M. G., Navarro, J. F., & Steinmetz, M. 2006, MNRAS, 365, 747
- Aguerri et al. (2005) Aguerri, J. A. L., Gerhard, O. E., Arnaboldi, M., et al. 2005, AJ, 129, 2585
- Arnaboldi et al. (2002) Arnaboldi, M., Aguerri, J. A. L., Napolitano, N. R., et al. 2002, AJ, 123, 760
- Arnaboldi et al. (2008) Arnaboldi, M., Doherty, M., Gerhard, O., et al. 2008, ApJ, 674, L17
- Arnaboldi et al. (1996) Arnaboldi, M., Freeman, K. C., Mendez, R. H., et al. 1996, ApJ, 472, 145
- Arnaboldi et al. (2003) Arnaboldi, M., Freeman, K. C., Okamura, S., et al. 2003, AJ, 125, 514
- Arnaboldi et al. (2004) Arnaboldi, M., Gerhard, O., Aguerri, J. A. L., et al. 2004, ApJ, 614, L33
- Arp & Bertola (1971) Arp, H. & Bertola, F. 1971, ApJ, 163, 195
- Bell et al. (2008) Bell, E., Zucker, D. B., Belokurov, V., Sharma, S., & et al. 2008, ApJ, 680, 295
- Binggeli et al. (1993) Binggeli, B., Popescu, C. C., & Tammann, G. A. 1993, A&AS, 98, 275
- Binggeli et al. (1987) Binggeli, B., Tammann, G. A., & Sandage, A. 1987, AJ, 94, 251
- Bullock et al. (2001) Bullock, J. S., Kolatt, T. S., Sigad, Y., et al. 2001, MNRAS, 321, 559
- Buzzoni et al. (2006) Buzzoni, A., Arnaboldi, M., & Corradi, R. L. M. 2006, MNRAS, 368, 877
- Cappellari et al. (2006) Cappellari, M., Bacon, R., Bureau, M., et al. 2006, MNRAS, 366, 1126
- Ciardullo et al. (1989) Ciardullo, R., Jacoby, G. H., Ford, H. C., & Neill, J. D. 1989, ApJ, 339, 53
- Ciardullo et al. (2005) Ciardullo, R., Sigurdsson, S., Feldmeier, J. J., & Jacoby, G. H. 2005, ApJ, 629, 499
- Coccato et al. (2009) Coccato, L., Gerhard, O., Arnaboldi, M., et al. 2009, MNRAS, 217
- Cohen (2000) Cohen, J. G. 2000, AJ, 119, 162
- Cohen & Ryzhov (1997) Cohen, J. G. & Ryzhov, A. 1997, ApJ, 486, 230
- Côté et al. (2001) Côté, P., McLaughlin, D. E., Hanes, D. A., et al. 2001, ApJ, 559, 828
- Durrell et al. (2003) Durrell, P. R., Mihos, J. C., Feldmeier, J. J., Jacoby, G. H., & Ciardullo, R. 2003, ApJ, 582, 170
- Durrell et al. (2007) Durrell, P. R., Williams, B. F., Ciardullo, R., et al. 2007, ApJ, 656, 746
- Feldmeier et al. (2003) Feldmeier, J. J., Ciardullo, R., Jacoby, G. H., & Durrell, P. R. 2003, ApJS, 145, 65
- Feldmeier et al. (2004) Feldmeier, J. J., Mihos, J. C., Morrison, H. L., et al. 2004, ApJ, 609, 617
- Freeman et al. (2000) Freeman, K. C., Arnaboldi, M., Capaccioli, M., et al. 2000, in Astronomical Society of the Pacific Conference Series, Vol. 197, Dynamics of Galaxies: from the Early Universe to the Present, ed. F. Combes, G. A. Mamon, & V. Charmandaris, 389
- Gerhard et al. (2005) Gerhard, O., Arnaboldi, M., Freeman, K. C., et al. 2005, ApJ, 621, L93
- Gerhard et al. (2007) Gerhard, O., Arnaboldi, M., Freeman, K. C., et al. 2007, A&A, 468, 815
- Ghigna et al. (1998) Ghigna, S., Moore, B., Governato, F., et al. 1998, MNRAS, 300, 146
- Gonzalez et al. (2005) Gonzalez, A. H., Zabludoff, A. I., & Zaritsky, D. 2005, ApJ, 618, 195
- Gonzalez et al. (2007) Gonzalez, A. H., Zaritsky, D., & Zabludoff, A. I. 2007, ApJ, 666, 147
- Halkola et al. (2007) Halkola, A., Seitz, S., & Pannella, M. 2007, ApJ, 656, 739
- Hanes et al. (2001) Hanes, D. A., Côté, P., Bridges, T. J., et al. 2001, ApJ, 559, 812
- Hui et al. (1993) Hui, X., Ford, H. C., Ciardullo, R., & Jacoby, G. H. 1993, ApJ, 414, 463
- Jacoby et al. (1990) Jacoby, G. H., Ciardullo, R., & Ford, H. C. 1990, ApJ, 356, 332
- Jacoby & De Marco (2002) Jacoby, G. H. & De Marco, O. 2002, AJ, 123, 269
- Kelson et al. (2002) Kelson, D. D., Zabludoff, A. I., Williams, K. A., et al. 2002, ApJ, 576, 720
- Kormendy et al. (2008) Kormendy, J., Fisher, D. B., Cornell, M. E., & Bender, R. 2008, ArXiv e-prints
- Krick & Bernstein (2007) Krick, J. E. & Bernstein, R. A. 2007, AJ, 134, 466
- Kundu & Whitmore (2001) Kundu, A. & Whitmore, B. C. 2001, AJ, 121, 2950
- Limousin et al. (2007) Limousin, M., Kneib, J. P., Bardeau, S., et al. 2007, A&A, 461, 881
- Matsushita et al. (2002) Matsushita, K., Belsole, E., Finoguenov, A., & Böhringer, H. 2002, A&A, 386, 77
- Mei et al. (2007) Mei, S., Blakeslee, J. P., Côté, P., et al. 2007, ApJ, 655, 144
- Merritt (1984) Merritt, D. 1984, ApJ, 276, 26
- Mihos et al. (2005) Mihos, J. C., Harding, P., Feldmeier, J., & Morrison, H. 2005, ApJ, 631, L41
- Moore et al. (1996) Moore, B., Katz, N., Lake, G., Dressler, A., & Oemler, A. 1996, Nature, 379, 613
- Murante et al. (2004) Murante, G., Arnaboldi, M., Gerhard, O., et al. 2004, ApJ, 607, L83
- Murante et al. (2007) Murante, G., Giovalli, M., Gerhard, O., et al. 2007, MNRAS, 377, 2
- Napolitano et al. (2003) Napolitano, N. R., Pannella, M., Arnaboldi, M., et al. 2003, ApJ, 594, 172
- Natarajan et al. (2002) Natarajan, P., Kneib, J.-P., & Smail, I. 2002, ApJ, 580, L11
- Natarajan et al. (1998) Natarajan, P., Kneib, J.-P., Smail, I., & Ellis, R. S. 1998, ApJ, 499, 600
- Nulsen & Böhringer (1995) Nulsen, P. E. J. & Böhringer, H. 1995, MNRAS, 274, 1093
- Romanowsky & Kochanek (2001) Romanowsky, A. J. & Kochanek, C. S. 2001, ApJ, 553, 722
- Royer et al. (2002) Royer, F., Blecha, A., North, P., et al. 2002, in Presented at the Society of Photo-Optical Instrumentation Engineers (SPIE) Conference, Vol. 4847, Astronomical Data Analysis II. Edited by Starck, Jean-Luc; Murtagh, Fionn D. Proceedings of the SPIE, Volume 4847, pp. 184-194 (2002)., ed. J.-L. Starck & F. D. Murtagh, 184–194
- Rudick et al. (2006) Rudick, C. S., Mihos, J. C., & McBride, C. 2006, ApJ, 648, 936
- Schindler et al. (1999) Schindler, S., Binggeli, B., & Böhringer, H. 1999, A&A, 343, 420
- Schindler & Böhringer (1993) Schindler, S. & Böhringer, H. 1993, A&A, 269, 83
- Sembach & Tonry (1996) Sembach, K. R. & Tonry, J. L. 1996, AJ, 112, 797
- Shapley et al. (2003) Shapley, A. E., Steidel, C. C., Pettini, M., & Adelberger, K. L. 2003, ApJ, 588, 65
- Tonry et al. (2001) Tonry, J. L., Dressler, A., Blakeslee, J. P., et al. 2001, ApJ, 546, 681
- van der Marel (1994) van der Marel, R. P. 1994, MNRAS, 270, 271
- Villaver et al. (2002) Villaver, E., Manchado, A., & García-Segura, G. 2002, ApJ, 581, 1204
- Weil et al. (1997) Weil, M. L., Bland-Hawthorn, J., & Malin, D. F. 1997, ApJ, 490, 664
- West & Blakeslee (2000) West, M. J. & Blakeslee, J. P. 2000, ApJ, 543, L27
- Williams et al. (2007) Williams, B. F., Ciardullo, R., Durrell, P. R., et al. 2007, ApJ, 656, 756
- Zibetti et al. (2005) Zibetti, S., White, S. D. M., Schneider, D. P., & Brinkmann, J. 2005, MNRAS, 358, 949