Similar in vivo killing efficacy of polyoma virus-specific CD8 T cells during acute and chronic phases of the infection
Abstract
Viral infections can be broadly divided into infections that are cleared from the host (acute) and those that persist (chronic). Why some viruses establish chronic infections while other do not is poorly understood. One possibility is that the host’s immune response is impaired during chronic infections and is unable to clear the virus from the host. In this report we use a recently proposed framework to estimate the per capita killing efficacy of CD8+ T cells, specific for the MT389 epitope of polyoma virus (PyV), which establishes a chronic infection in mice. Surprisingly, the estimated per cell killing efficacy of MT389-specific effector CD8+ T cells during the acute phase of the infection was very similar to the previously estimated efficacy of effector CD8+ T cells specific to lymphocytic choriomeningitis virus (LCMV-Armstrong), which is cleared from the host. We also find that during the chronic phase of the infection the killing efficacy of PyV-specific CD8+ T cells was only half of that of cells in the acute phase. This decrease in the killing efficacy is again surprisingly similar to the change in the killing efficacy of LCMV-specific CD8+ T cells from the peak of the response to the memory phase. Interestingly, we also find that PyV-specific CD8+ T cells in the chronic phase of the infection require lower doses of antigen to kill a target cell. In summary, we find little support for the hypothesis that persistence of infections is caused by inability of the host to mount an efficient immune response, and that even in the presence of an efficient CD8+ T cell response, some viruses can still establish a persistent infection.
Abbreviations: PyV, polyoma virus, LCMV, lymphocytic choriomeningitis virus, CIs, Confidence intervals, LTR, likelihood ratio test
1 Introduction
CD8+ T cells play an important role in controlling growth of viral infections both in mice and in humans by multiple mechanisms including killing of virus-infected cells and producing anti-viral cytokines (1, 2). Following acute viral infections, CD8 T cells follow a defined program of expansion, differentiation and contraction that results in the clearance of the virus within 1 to 2 weeks of the infection (3, 4, 5). During the expansion phase, CD8+ T cells differentiate into effectors that possess multiple functions and are very efficient killers in vivo (6, 7, 8). Although during a chronic viral infection such LCMV clone 13 infection of mice CD8+ T cells follow a similar program of expansion and contraction (9), control of the virus is limited (2). Persistent viral load progressively leads to exhaustion of antigen-specific CD8+ T cells which over time lose various effector functions such as production of IL-2 and TNF- (2). A similar progressive disfunction of antigen-specific CD8+ T cells has been observed during HIV infection (10).
Why some infections are cleared while others persist is unknown and likely to be different for different infections. One hypothesis is that viruses that persist may elicit T cell responses of inadequate quality that are unable to control viral growth during acute phase of the infection. Indeed, infection of mice with LCMV clone 13 (that persists) elicits CD8+ T cell response of a lower magnitude than during LCMV-Armstrong infection (that is cleared) and this could be a part of the reason why LCMV clone 13 persists in mice (9). Another potential reason could be a low effector to target ratio induced during the infection with the rapidly replicating LCMV clone 13 (11). Finally, a lower efficiency of virus-specific CD8+ T cells induced during a chronic viral infection as compared to T cells during acute infections may be responsible for viral persistence. There have been no studies that attempted to discriminate between different mechanisms for viral persistence and to the best of our knowledge there have been no studies that have measured the in vivo killing efficacy of CD8+ T cells during chronic viral infections.
Using a recently developed method of in vivo cytotoxicity (12, 13, 14, 15, 16), we investigate whether infection of mice with polyoma virus (PyV) that causes a persistent infection elicits a CD8+ T cell response of a low killing efficacy and whether this killing efficacy changes from the acute to chronic phase of the infection. Unexpectedly, we found that the in vivo killing efficacy of PyV-specific CD8+ T cells at the peak of the immune response is very similar to that of LCMV-Armstrong-specific CD8+ T cells obtained in our previous study (8). This argues that inability of CD8+ T cell response to clear PyV infection in the acute phase is not due to a low killing efficacy of antigen-specific T cells. Furthermore, during the chronic phase of the infection, PyV-specific CD8+ T cells did not lose their ability to kill even months after the primary infection, being only 2 fold less efficient killers than effectors present at the peak of the immune response. Thus, even in the presence of an efficient CD8+ T cell response, PyV is able to establish a persistent infection in mice, and it is likely that other viral and/or host factors play in important role in this process.
2 Material and Methods
2.1 Data
The method of measuring cytotoxicity of CD8+ T cells in vivo has been described in detail elsewhere (e.g., (17, 7)). In this report, we reanalyze recently published data on killing of peptide-pulsed splenocytes by polyoma virus (PyV) specific CD8+ T cells during acute and chronic phases of the PyV infection of C3H/HeN mice (16). The reader is referred to the original publication for more detail. In short, target splenocytes were pulsed with the MT389 peptide of PyV or were left unpulsed. The peptide MT389 was chosen because it elicits the dominant CD8+ T cell response in H-2k (C3H) mice (18). Cells were transferred into syngeneic mice either infected with PyV 7 days before (“acute” phase), or into mice controlling PyV infection (days 35-175 post infection, “chronic” phase). At day 7 after the infection, the CD8+ T cell response to PyV reaches its peak, and by 30 to 40 days after the infection, the CD8+ T cell response largely contracts (19). At different times after the transfer of target cells (15 min, 30 min, 1 hour, 2 hours, and 4 hours), spleens were harvested, and the number of pulsed and unpulsed targets, splenocytes, and peptide-specific CD8+ T cells was measured. To investigate how the killing efficacy of MT389-specific CD8+ T cells may be affected by the peptide concentration, in a series of experiments target splenocytes were pulsed with 5 different concentrations of the MT389 peptide (10, 1, 0.1, 0.01, and 0.001 M) and killing of peptide-pulsed targets was measured as described above.
To estimate the per capita killing efficacy of MT389-specific CD8+ T cells we used the average frequency of these cells in spleens of PyV-infected mice. Our previous analyses suggested that the frequency of LCMV-specific CD8+ T cells in an individual mouse bears little information on the number of target cells killed in the same mouse (Ganusov at al. in preparation). The use of cell frequencies, rather than cell numbers, is also supported by our previous work (8) and follows from general physical principles because killing occurs in a solid organ such as spleen (6). In experiments of Byers et al. (16), using average frequencies of MT389-specific CD8+ T cells in mice in the acute or the chronic phase rather than values measured in individual mice also gave a better fit of the data (results not shown). As in our previous work (8), this is likely because measurements of CTL frequencies were noisy and poorly correlated with the number of targets killed (results not shown). Therefore, we used the average frequency of MT389-specific CD8+ T cells in the spleen for fitting the data. In the acute phase (with standard deviation 0.21%), and in the chronic phase was (with standard deviation 0.15%).
We have previously found that for LCMV-infected mice, the rate of recruitment of target cells into the spleen was correlated with the spleen size (7). For PyV-infected mice, a similar correlation was found although it was not statistically significant (results not shown). Therefore, to simplify the analysis here we assumed that recruitment of target cells into the spleen occurs at the same rate in all mice (see also below).
2.2 Mathematical model for the cytotoxicity in vivo assay
As we have previously described (7), changes in the number of unpulsed and peptide-pulsed targets in the mouse spleen are given by the following equations:
| (1) | |||||
| (2) |
where is the rate of removal of cells from the blood, and are the rates of recruitment of targets from the blood into the spleen or elsewhere, respectively, is the rate of preparation-induced cell death, , and is the initial number of targets adoptively transferred into mice. Dividing eqn. (2) by (1) we arrive at the experimentally measured ratio of peptide-pulsed to unpulsed targets,
| (3) |
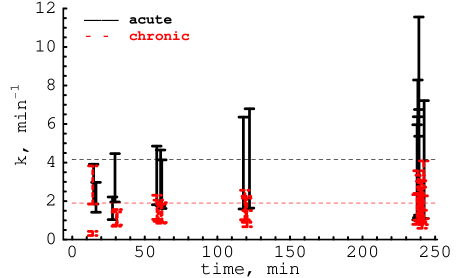
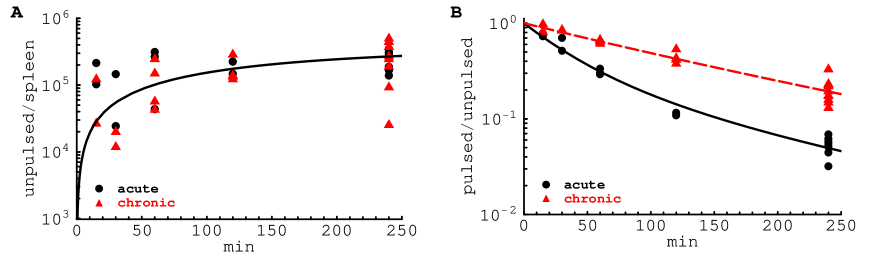
This equation can used to estimate the death rate of pulsed targets due to CD8+ T cell mediated killing from the changes in the ratio over time (7, see also Figure 1). To estimate the per capita killing efficacy of PyV-specific CD8+ T cells we let where is the per capita killing efficacy and is the frequency of MT389-specific CD8+ T cells in the mouse spleen. Using adoptive transfer of different numbers of LCMV-specific effectors or memory T cells we have recently shown that killing of peptide-pulsed targets is proportional to the frequency of effector CD8+ T cells in the spleen, but killing saturates at high frequencies of memory CD8+ T cells (8). For PyV, no similar adoptive transfers have been performed, and therefore we do not know if the death rate of targets saturates with the increasing frequency of PyV-specific effector and memory CD8+ T cells. This will be a subject of an additional study. For the following analysis we thus assume that death rate of peptide-pulsed targets in the spleen is proportional to the average frequency of epitope-specific CD8+ T cells in the acute or chronic phases of the infection.
In our analysis, we also estimate the maximal () and minimal () death rate of peptide-pulsed targets due to CD8+ T cell mediated killing from the in vivo cytotoxicity experiments (7). is estimated by solving the following transcendental equation
| (4) |
and is estimated from
| (5) |
where is the ratio of the frequency of peptide-pulsed to unpulsed targets in the spleen at time after target cell transfer. The per capita killing efficacy of CD8+ T cells is then calculated, assuming the mass-action killing term (see above) by dividing the death rate of peptide-pulsed targets by the frequency of peptide-specific CD8+ T cells in the mouse spleen .
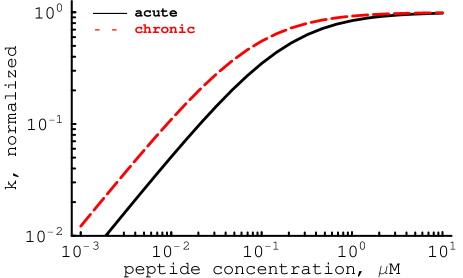
The dependence of the killing efficacy of CD8+ T cells on the peptide concentration used to pulse target cells was taken in the form of a Hill function
| (6) |
where is the maximal killing efficacy of MT389-specific CD8+ T cells, is the peptide concentration used to pulse target cells, is the peptide concentration at which killing is half-maximal, and is the power of the Hill function.
2.3 Statistics
In our previous study (7), we assumed that errors in measuring the number of unpulsed targets in the spleen and in the ratio of the frequency of peptide-pulsed to unpulsed targets peptide-pulsed targets were of a similar magnitude. In PyV-infected mice this was not the case, since there was a significantly larger error in estimating the number of targets recruited than the percent of targets killed (e.g., see Figure 1). Therefore, we used a general likelihood approach to fit the data on recruitment of targets to the spleen and killing of peptide-pulsed targets in the spleen (see Supplementary Information). Data on recruitment and on killing were log-transformed but were assumed to have different distribution of errors (with standard deviations and , respectively). In general this resulted in well-behaved and normally distributed residuals except of the data when targets were pulsed with a low peptide concentration. The latter fits resulted in a skewed distribution of the residuals (results not shown). Discrimination between different models was done using either the likelihood ratio test (LRT) or F-test for nested models (20, 21). Confidence intervals (CIs) were calculated by bootstrapping the data with 1000 simulations (22). Fittings were done in Mathematica 5.2 using the routine FindMinimum.
3 Results
3.1 Estimation of the killing efficacy of polyoma virus specific CD8+ T cells
We have previously developed a mathematical model to estimate the death rates of peptide-pulsed targets in vivo due to CD8+ T cell mediated killing and the per capita killing efficacy CD8+ T cells (7, 8). Here, we applied this model to estimate the per capita efficacy of the immunodominant polyoma virus (PyV)-specific CD8+ T cell response at killing target splenocytes, pulsed with MT389 peptide during the acute (day 7) or chronic (days 32-175) phases of the PyV infection of mice (19). The model described the data well (Figure 1) and estimated that half of peptide-pulsed targets are eliminated in 15 minutes in acutely infected mice and in 47 minutes during the chronic phase of the infection. Both rates are surprisingly similar to those obtained for targets expressing peptides from LCMV Armstrong (7). Even more surprising, the per capita killing efficacy of MT389-specific effectors () is very similar to the estimates obtained in our previous study for effector CD8+ T cells, specific to the NP396 () or GP276 () epitopes of LCMV (see Table 1 and (8)). Similarly as in the previous studies (23, Ganusov et al. in preparation), we find that the per capita killing efficacy of CD8+ T cells in the chronic phase of the infection was only twice as low as the T cell efficacy during the acute infection (Figure 1). Such a change of the killing efficacy from the peak of the CD8+ T cell response to the chronic phase was highly significant (LRT: , ).
We found that recruitment of target cells into the spleen occurred at similar rates in the acute and chronic phases of the PyV infection (Figure 1 and Table 1; , ). Approximately 5% of all unpulsed targets accumulated in the mouse spleen at 4 hours of the experiments that is consistent with previous estimates (24, 7). The half-life time of targets in the blood as determined by the rate of removal of targets from the blood, , was estimated at hours. This estimate is similar to an estimate obtained in our previous study (7). Interestingly, in this study we did not find any evidence for the preparation-induced death rate of targets (, , ) that is in contrast with our previous observation (7). Different methods of preparing single cell suspension in two laboratories and type of infection may have contributed to the observed difference in estimates of this parameter.
| parameter | acute | chronic |
|---|---|---|
| 3.96 (2.90–5.37) | ||
| 4.92 (2.95–7.04) | ||
| 4.16 (3.42–4.84) | 1.90 (1.65–2.18) | |
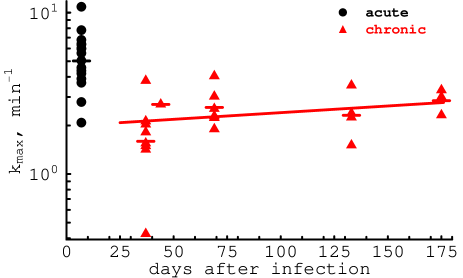
To further confirm our estimates of the killing efficacy of PyV-specific CD8+ T cells, we calculated the minimal and maximal estimates of the killing efficacy at different times after target cell transfer using a previously proposed protocol (7, see also Materials and Methods). The estimates of the killing efficacy are fairly consistent for all time points analyzed for the chronically infected mice but not for acutely infected mice (Figure S1 in Supplementary Information). The latter is most likely due to errors associated with estimating the small number of remaining targets at the end of the killing assay. Indeed, linear regression analysis suggests that the estimate of the killing efficacy is increasing with the time since cell transfer (results not shown). Importantly, there is a considerable overlap between estimates of the killing efficacy of T cells in the acute and chronic phases of the PyV infection. This confirms the analysis of the time series data that on average killing efficacy of the MT389-specific T cell response in acute phase of the infection is only two fold lower than that of PyV-specific T cells in the chronic phase (Figure 1 and Table 1). There was no significant change in the killing efficacy of MT389-specific CD8+ T cells during the chronic phases of the infection (Figure 2) suggesting that long-term exposure to a persistent infection need not result in the loss of in vivo effector functions. This result is consistent with the previous observation that in chronic PyV infection, CD8+ T cells are mainly maintained by the production of effector T cells from newly recruited naive PyV-specific T cells (19). Nevertheless, this contrasts with the data on chronic LCMV infection during which LCMV-specific CD8+ T cells lose their effector functions over time (25).
3.2 Killing efficacy at lower peptide concentrations
It has been known that the number of targets killed in the in vivo cytotoxicity assay depends strongly on the amount of peptide used to pulse target cells (e.g., (16)). However, it has not been investigated how this translates into the killing efficacy of CD8+ T cells and whether there is a difference in the killing efficacy of T cells over the course of a chronic infection at low peptide concentrations.
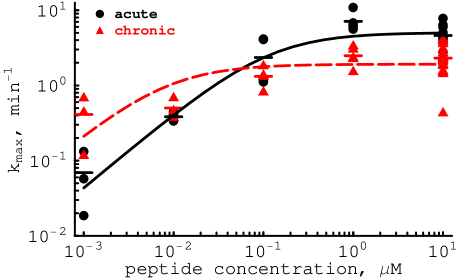
To investigate how the killing efficacy of CD8+ T cells depends on the concentration of the peptide used to pulse target cells, we use two approaches. We estimated the per capita killing efficacy of MT389-specific T cells for every mouse from single measurement of killing using eqn. (4) and (5) (see Materials and Methods). As expected, we found that the killing efficacy of CD8+ T cells was higher when targets were pulsed with a higher peptide concentration (Figure 3). Surprisingly, we find little difference in the killing efficacy of MT389-specific CD8+ T cells in the acute and chronic phases of the infection when the peptide concentration was low. In fact, at the lowest peptide concentration (M), MT389-specific CD8+ T cells in the chronic phase appeared to be more efficient at clearing peptide-pulsed targets than PyV-specific CD8+ T cells in the acute phase of the infection (Figure 3). In contrast, at high peptide concentrations, T cells in the acute phase were more efficient at killing targets than PyV-specific T cells in the chronic phase as expected from the above analysis (e.g., see Table 1).
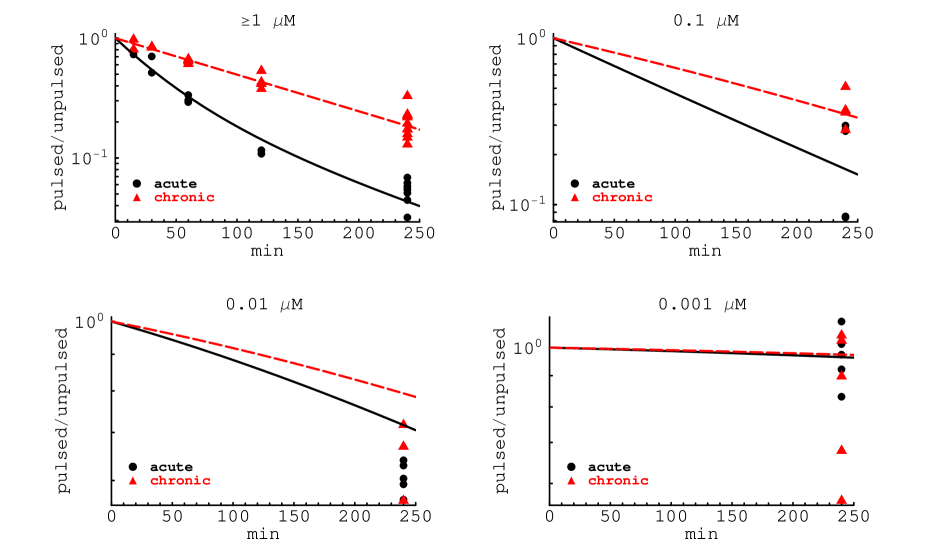
To verify these predictions we refitted the time series data on killing of targets pulsed with peptides at different concentrations assuming that the killing efficacy of CD8+ T cells depends on the amount of peptide that target cells present (see eqn. (6) in Materials and Methods). The model described the data reasonably well (Figure 4) with the exception of the data with peptide concentration M where the model underestimated the amount of killing (see also Figure 3). Interestingly, the model fits also predicted a lower half-saturation constant (i.e., a higher affinity to the antigen) of MT389-specific CD8+ T cells in the chronic phase of the infection than that of cells in the acute phase (Table 2 and Figure S2 in Supplementary Information). The fits also confirmed a higher killing efficacy of CD8+ T cells in the acute phase at high concentrations of the MT389 peptide (Table 2).
| parameter | acute | chronic |
|---|---|---|
| 5.83 (3.61–8.78) | ||
| 3.50 (2.93–4.04) | 1.89 (1.58–2.16) | |
| 0.19 (0.10–0.37) | 0.08 (0.04–0.14) | |
4 Discussion
There is a limited understanding of why CD8+ T cell responses in some cases can control and clear viral infections while in other cases they fail to do so. It was recently shown that the initial effector to target ratio during acute phase of LCMV infection may determine whether the infection is cleared (high E/T ratio) or persists (low E/T ratio, (11)). Our results demonstrate that in the case of PyV infection of mice, the failure to clear the infection is not due to a reduced killing efficacy of PyV-specific CD8+ T cells. Instead we found that killing efficacy of PyV-specific effectors is very similar to that of LCMV-specific CD8+ T cells that clear the infection from mice within 7 days (26). Other mechanisms such as an ability to persist in a silent form by expressing proteins at a low level, may have allowed PyV to escape the eradication from infected mice. It will be interesting to investigate if infection of mice with other strains of LCMV, some of which induce high levels of IL-10 (27, 28, 29), establish persistence by reducing the killing efficacy of LCMV-specific CD8+ T cells and not necessarily due to a low ratio of effectors to targets (11).
We found that PyV-specific CD8+ T cells during the chronic phase of the infection have a lower half-saturation constant than T cells present at the peak of the immune response (Table 2 and Figure S2 in Supplementary Information). A lower half-saturation constant suggests that these CD8+ T cells are more sensitive to lower quantities of the antigen than effectors. The effect of downregulation of T cell receptors on T cells, thereby reducing TCR avidity to the antigen, (“tuning of activation threshold”) has been proposed to occur in some situations, for example, during maturation of T cells in the thymus (30, 31), and has been documented to occur during acute infections (32, 33). Our results indicate that CD8+ T cells may also regulate their avidity for the antigen when antigen load is low. In the acute phase, when antigen is abundant, CD8+ T cells with lower avidity are selected. In the chronic phase, when antigen is limited, to efficiently control virus replication CD8+ T cells with higher avidity may become dominant. Such a selection could occur via at least two mechanisms. First, higher avidity T cells may be selected during the chronic phase of the infection from the existing pool of effector T cells. Alternatively, PyV-specific naive CD8+ T cells that have recently emigrated from the thymus and have a high affinity for MT389 epitope of PyV could be preferentially activated by the low amount of antigen present during the infection (19). Given the inability of PyV-specific CD8+ T cells to self-renew during the chronic phase of the infection, the latter mechanism seems more likely. One potential way of regulating avidity for the antigen is the amount of T-cell receptors present on the cell surface. A testable prediction of this model result would be a higher number of T-cell receptors on PyV-specific CD8+ T cells during the chronic phase of the infection as compared to effectors at the peak of the immune response.
In contrast to the substantial body of work characterizing memory CD8 T cell exhaustion in high-load chronic viral infections, we know surprisingly little about maintenance of memory CD8+ T cells to viruses that establish low-level persistent infection. Persistent viremia (i.e., high-load persistent infection) is associated with a number of infections of global import, including HIV, HCV, and HBV. In mice, infection by high replicating strains of LCMV (e.g., clone 13 or DOCILE) has been the principal animal model for high-load persistent infection. In this setting, LCMV-specific CD8+ T cells progressively accumulate defects in effector function and replication potential and are then deleted, a phenomenon called “exhaustion” (34, 2, 35). The high antigenic burden and duration associated, for example, with HIV infection also drive virus-specific CD8+ T cells to exhaustion, which is generally considered to be a prelude to viral persistence (10, 36). T cell exhaustion, however, is at odds to situations involving low-load persistent viral infections (e.g., HV-68, and PyV in mice) where the majority of CD8+ T cell functions as measured in ex vivo assays are not compromised and stable numbers of virus-specific T cells are maintained (37, 38, 39, 40). Here we further demonstrate that the in vivo killing efficacy of PyV-specific CD8+ T cells in the chronic phase of the infection is only two-fold lower than that of cells in the acute phase arguing that CD8+ T cells can maintain their in vivo effector functions long since the primary phase of a persistent infection (Figure 2).
In our previous study by adoptively transferring different numbers of LCMV-specific effector and memory CD8+ T cells, we found that per cell killing efficacy of memory cells decreased with the number of transferred cells. We conjectured that this effect could arise due to competition between LCMV-specific memory CD8+ T cells in the white pulp of the spleen for the access to targets (8). For PyV infection, we do not know if the two fold reduced killing efficacy of CD8+ T cells in the chronic phase of the infection is also due to localization of these cells in the white pulp of the spleen.
We have found that killing efficacy of PyV-specific CD8+ T cells depended strongly on the peptide concentration used to pulse targets. To kill a peptide-pulsed target, a CD8+ T cell has to accomplish two tasks: find the target and deliver the lethal hit. It is unclear which of these two processes is the limiting step in the killing of targets. Additional studies including those looking at the process of killing of targets by effector T cells in vivo (e.g., (41)) will be necessary to investigate this issue further.
Overall, our analysis suggests that PyV-specific CD8+ T cells are highly efficient in vivo killers of peptide-pulsed targets. However, it is unknown if these T cells are also good killers of cells naturally infected with PyV. Also, it is not known if the killing efficacy of PyV-specific T cells depends on the tissue in which killing is measured. Finally, by combining the measured dynamics of viral load in tissues, PyV-specific T cell response and killing efficacy of T cells, it will be important to investigate whether CD8+ T cells are mainly responsible for the decline on PyV load during acute phase of the infection. Addressing these issues will a subject of future research.
5 Acknowledgments
This work was supported by the Marie Curie Incoming International Fellowship (FP6, VVG), U.S. Department of Energy through the LANL/LDRD Program (VVG) and NIH (R01CA71971, AEL).
References
- Kaech et al. (2002) Kaech, S. M., E. J. Wherry, and R. Ahmed. 2002. Effector and memory T-cell differentiation: implications for vaccine development Nat Rev Immunol 2: 251–262.
- Wherry and Ahmed (2004) Wherry, E.J. and R. Ahmed. 2004. Memory CD8 T-cell differentiation during viral infection. J Virol 78: 5535–45.
- Kaech and Ahmed (2001) Kaech, S. M. and R. Ahmed. 2001. Memory CD8+ T cell differentiation: initial antigen encounter triggers a developmental program in naive cells Nat Immunol 2: 415–22.
- Badovinac et al. (2002) Badovinac, V.P., B.B. Porter, and J.T. Harty. 2002. Programmed contraction of CD8(+) T cells after infection. Nat Immunol 3: 619–626.
- De Boer et al. (2003) De Boer, R.J., D. Homann, and A.S. Perelson. 2003. Different dynamics of CD4(+) and CD8(+) T cell responses during and after acute lymphocytic choriomeningitis virus infection. J Immunol 171: 3928–3935.
- Regoes et al. (2007) Regoes, R.R., D.L. Barber, R. Ahmed, and R. Antia. 2007. Estimation of the rate of killing by cytotoxic T lymphocytes in vivo. Proc Natl Acad Sci U S A 104: 1599–603.
- Ganusov and De Boer (2008) Ganusov, V. V. and R. J. De Boer. 2008. Estimating in vivo death rates of targets due to CD8 T-cell-mediated killing. J Virol 82: 11749–57.
- Ganusov et al. (2009) Ganusov, V. V., D. L. Barber, and R. J. De Boer. 2009. Killing of targets by effector CD8 T cells in the mouse spleen follows the law of mass-action. In preparation.
- Althaus et al. (2007) Althaus, C.L., V.V. Ganusov, and R.J. De Boer. 2007. Dynamics of CD8+ T cell responses during acute and chronic lymphocytic choriomeningitis virus infection. J Immunol 179: 2944–51.
- Streeck et al. (2008) Streeck, H., Z. L. Brumme, M. Anastario, K. W. Cohen, J. S. Jolin, A. Meier, C. J. Brumme, E. S. Rosenberg, G. Alter, T. M. Allen, B. D. Walker, and M. Altfeld. 2008. Antigen load and viral sequence diversification determine the functional profile of HIV-1-specific CD8+ T cells. PLoS Med 5: e100.
- Li et al. (2009) Li, Q., P. J. Skinner, S. J. Ha, L. Duan, T. L. Mattila, A. Hage, C. White, D. L. Barber, L. O’Mara, P. J. Southern, C. S. Reilly, J. V. Carlis, C. J. Miller, R. Ahmed, and A. T. Haase. 2009. Visualizing antigen-specific and infected cells in situ predicts outcomes in early viral infection. Science 323: 1726–9.
- Aichele et al. (1997) Aichele, P., K. Brduscha-Riem, S. Oehen, B. Odermatt, R.M. Zinkernagel, H. Hengartner, and H. Pircher. 1997. Peptide antigen treatment of naive and virus-immune mice: antigen-specific tolerance versus immunopathology. Immunity 6: 519–29.
- Oehen and Brduscha-Riem (1998) Oehen, S. and K. Brduscha-Riem. 1998. Differentiation of naive CTL to effector and memory CTL: correlation of effector function with phenotype and cell division J Immunol 161: 5338–46.
- Barchet et al. (2000) Barchet, W., S. Oehen, P. Klenerman, D. Wodarz, G. Bocharov, A. L. Lloyd, M. A. Nowak, H. Hengartner, R. M. Zinkernagel, and S. Ehl. 2000. Direct quantitation of rapid elimination of viral antigen-positive lymphocytes by antiviral CD8(+) T cells in vivo Eur J Immunol 30: 1356–63.
- Barber et al. (2003) Barber, D.L., E.J. Wherry, and R. Ahmed. 2003. Cutting edge: rapid in vivo killing by memory CD8 T cells. J Immunol 171: 27–31.
- Byers et al. (2003) Byers, A.M., C.C. Kemball, J.M. Moser, and A.E. Lukacher. 2003. Cutting edge: rapid in vivo CTL activity by polyoma virus-specific effector and memory CD8+ T cells. J Immunol 171: 17–21.
- Ingulli (2007) Ingulli, E. 2007. Tracing Tolerance and Immunity In Vivo by CFSE-Labeling of Administered Cells. Methods Mol Biol 380: 365–76.
- Lukacher et al. (1999) Lukacher, A.E., J.M. Moser, A. Hadley, and J.D. Altman. 1999. Visualization of polyoma virus-specific CD8+ T cells in vivo during infection and tumor rejection. J Immunol 163: 3369–78.
- Vezys et al. (2006) Vezys, V., D. Masopust, C.C. Kemball, D.L. Barber, L.A. O’Mara, C.P. Larsen, T.C. Pearson, R. Ahmed, and A.E. Lukacher. 2006. Continuous recruitment of naive T cells contributes to heterogeneity of antiviral CD8 T cells during persistent infection. J Exp Med 203: 2263–9.
- Burnham and Anderson (2002) Burnham, K. P. and D. R. Anderson. 2002. Model selection and multimodel inference: a practical information-theoretic approach. Springer-Verlag, New York 340 .
- Bates and Watts (1988) Bates, D. M. and D. G. Watts. 1988. Nonlinear regression analysis and its applications. John Wiles & Sons, Inc. 365 .
- Efron and Tibshirani (1993) Efron, B. and R. Tibshirani. 1993. An introduction to the bootstrap Chapman & Hall, New York 436 .
- Yates et al. (2007) Yates, A., F. Graw, D. L. Barber, R. Ahmed, R. R. Regoes, and R. Antia. 2007. Revisiting Estimates of CTL Killing Rates In Vivo. PLoS ONE 2: e1301.
- Blattman et al. (2002) Blattman, J. N., R. Antia, D. J. Sourdive, X. Wang, S. M. Kaech, K. Murali-Krishna, J. D. Altman, and R. Ahmed. 2002. Estimating the precursor frequency of naive antigen-specific CD8 T cells J Exp Med 195: 657–6664.
- Wherry et al. (2003) Wherry, E.J., J.N. Blattman, K. Murali-Krishna, R. Van Der Most, and R. Ahmed. 2003. Viral persistence alters CD8 T-cell immunodominance and tissue distribution and results in distinct stages of functional impairment. J Virol 77: 4911–27.
- Lau et al. (1994) Lau, L.L., B.D. Jamieson, T. Somasundaram, and R. Ahmed. 1994. Cytotoxic T-cell memory without antigen Nature 369: 648–652.
- Ejrnaes et al. (2006) Ejrnaes, M., C.M. Filippi, M.M. Martinic, E.M. Ling, L.M. Togher, S. Crotty, and M.G. von Herrath. 2006. Resolution of a chronic viral infection after interleukin-10 receptor blockade. J Exp Med 203: 2461–72.
- Brooks et al. (2006) Brooks, D.G., M.J. Trifilo, K.H. Edelmann, L. Teyton, D.B. McGavern, and M.B. Oldstone. 2006. Interleukin-10 determines viral clearance or persistence in vivo. Nat Med 12: 1301–9.
- Maris et al. (2007) Maris, C.H., C.P. Chappell, and J. Jacob. 2007. Interleukin-10 plays an early role in generating virus-specific T cell anergy. BMC Immunol 8: 8.
- Grossman and Paul (1992) Grossman, Z. and W.E. Paul. 1992. Adaptive cellular interactions in the immune system: the tunable activation threshold and the significance of subthreshold responses. Proc Natl Acad Sci U S A 89: 10365–9.
- Grossman and Singer (1996) Grossman, Z. and A. Singer. 1996. Tuning of activation thresholds explains flexibility in the selection and development of T cells in the thymus. Proc Natl Acad Sci U S A 93: 14747–52.
- Slifka and Whitton (2001) Slifka, M. K. and J. L. Whitton. 2001. Functional avidity maturation of CD8(+) T cells without selection of higher affinity TCR. Nat Immunol 2: 711–7.
- Zehn et al. (2009) Zehn, D., S. Y. Lee, and M. J. Bevan. 2009. Complete but curtailed T-cell response to very low-affinity antigen. Nature 458: 211–4.
- Zajac et al. (1998) Zajac, A. J., J. N. Blattman, K. Murali-Krishna, D. J. Sourdive, M. Suresh, J. D. Altman, and R. Ahmed. 1998. Viral immune evasion due to persistence of activated T cells without effector function Journal of Experimental Medicine 188: 2205–13.
- Wherry et al. (2007) Wherry, E. J., S. J. Ha, S. M. Kaech, W. N. Haining, S. Sarkar, V. Kalia, S. Subramaniam, J. N. Blattman, D. L. Barber, and R. Ahmed. 2007. Molecular signature of CD8+ T cell exhaustion during chronic viral infection. Immunity 27: 670–84.
- Rowland-Jones and de Silva (2008) Rowland-Jones, S. and T. de Silva. 2008. Resisting immune exhaustion in HIV-1 infection. PLoS Med 5: e103.
- Kemball et al. (2005) Kemball, C. C., E. D. Lee, V. Vezys, T. C. Pearson, C. P. Larsen, and A. E. Lukacher. 2005. Late priming and variability of epitope-specific CD8+ T cell responses during a persistent virus infection. J Immunol 174: 7950–60.
- Obar et al. (2006) Obar, J. J., S. Fuse, E. K. Leung, S. C. Bellfy, and E. J. Usherwood. 2006. Gammaherpesvirus persistence alters key CD8 T-cell memory characteristics and enhances antiviral protection. J Virol 80: 8303–15.
- Cush et al. (2007) Cush, S. S., K. M. Anderson, D. H. Ravneberg, J. L. Weslow-Schmidt, and E. Flano. 2007. Memory generation and maintenance of CD8+ T cell function during viral persistence. J Immunol 179: 141–53.
- Cush and Flano (2009) Cush, S. S. and E. Flano. 2009. Protective antigen-independent CD8 T cell memory is maintained during {gamma}-herpesvirus persistence. J Immunol 182: 3995–4004.
- Mempel et al. (2006) Mempel, T.R., T. Junt, and U.H. von Andrian. 2006. Rulers over randomness: stroma cells guide lymphocyte migration in lymph nodes. Immunity 25: 867–9.
6 Supplementary Information
6.1 General likelihood approach for data fitting
When a given model is fitted to several datasets simultaneously, it is often assumed that the distribution of errors of the fit are similar for all datasets. This needs not be true in general. In those cases, when this is not expected to be a correct assumption, a general likelihood approach should be used. For our model and the data, the general likelihood of observing the data given the model prediction on the number of recruited targets and the ratio of peptide-pulsed to unpulsed targets is
| (A.1) |
where and are the measured and predicted number of unpulsed targets in the spleen at time after cell transfer, respectively, and and are the measured and predicted ratio of peptide-pulsed to unpulsed targets in the spleen at time after cell transfer, respectively, and are the standard deviation of the errors in the recruitment and killing data, respectively, is the number of measurements, and is the vector of model parameters to be estimated from the data. Note that in this example we have log-transformed the data and the model prediction for both datasets, and in general, one could use different transformations for data fitting.
It is convenient to rewrite eqn. (A.1) in terms of log-likelihood :
| (A.2) |
where we omitted the constant term . Parameters of the model are found by maximizing the log-likelihood in respect to model parameters and error variances and . In the case when , maximization of eqn. (A.2) will be identical to the commonly used method of least squares (20).