Hierarchical star formation in the Milky Way disk
Abstract
Hierarchical star formation leads to a progressive decrease in the clustering of star clusters both in terms of spatial scale and age. Consistently, the statistical analysis of positions and ages of clusters in the Milky Way disk strongly suggests that a correlation between the duration of star formation in a region and its size does exist. The average age difference between pairs of open clusters increases with their separation as the 0.16 power. In contrast and for the Large Magellanic Cloud, Efremov & Elmegreen (1998) found that the age difference scales with the 0.35 power of the region size. This discrepancy may be tentatively interpreted as an argument in support of intrinsically shorter (faster) star formation time-scales in smaller galaxies. However, if both the effects of cluster dissolution and incompleteness are taken into consideration, the average age difference between cluster pairs in the Galaxy increases with their separation as the 0.4 power. This result implies that the characteristic time-scale for coherent, clustered-mode star formation is nearly 1 Myr. Therefore, the overall consequence of ignoring the effect of cluster dissolution is to overestimate the star formation time-scale. On the other hand, in the Galactic disk and for young clusters separated by less than three times the characteristic cluster tidal radius (10 pc), the average age difference is 16 Myr, which suggests common origin. A close pair classification scheme is introduced and a list of 11 binary cluster candidates with physical separation less than 30 pc is compiled. Two of these pairs are likely primordial: ASCC 18/ASCC 21 and NGC 3293/NGC 3324. A triple cluster candidate in a highly hierarchical configuration is also identified: NGC 1981/NGC 1976/Collinder 70 in Orion. We find that binary cluster candidates seem to show a tendency to have components of different size; an evidence for dynamical interaction.
1 Introduction
Star clusters do not form in isolation but tend to be clustered themselves in complexes (Efremov 1978). Efremov & Elmegreen (1998) studied the positions and ages of Cepheid variables and star clusters in the Large Magellanic Cloud (LMC) and found that objects closer to each other had also a substantially higher probability of being almost coeval. This finding has been interpreted as evidence in favor of star formation proceeding faster in smaller regions than in larger ones. This idea was originally proposed by Elmegreen et al. (1996). In their work and using a sample of Magellanic spiral and irregular galaxies and blue compact dwarfs, they concluded that star complexes are systematically smaller (in absolute terms) in smaller galaxies. An orderly decrease in the star formation time-scale with galaxy size was found. From a theoretical perspective, this is to be expected as gravitational collapse is started when the local free-fall time becomes shorter than the sound-crossing time with the latter being directly proportional to the size of the region undergoing collapse. The star formation rate essentially equals the self-gravity rate and the timing for star formation is hierarchical, with a number of small active regions being born and dissolved in the time it takes the larger region surrounding them to finish (Elmegreen 2000). Star cluster complexes are the largest groups in the hierarchy of star formation. In quantitative terms, Efremov & Elmegreen (1998) concluded that the average age difference between pairs of star clusters in the LMC increased with their separation as the 0.35 power, following the law:
| (1) |
for clusters in the 0.01-1 deg separation range (8-780 pc at the assumed LMC distance, 45 kpc). The catalogue of LMC clusters used in their research was compiled by Bica et al. (1996). In summary, star formation in the LMC is hierarchical in space and time (Efremov & Elmegreen 1998). If the interpretation envisaged by Efremov & Elmegreen (1998) is correct, we would expect slower star formation and, therefore, a smaller value for the scaling power index in the Milky Way disk. In this research we attempt to confirm this expectation. As in Efremov & Elmegreen (1998), the results obtained here are only applicable to the so-called clustered mode of star formation.
This paper is organized as follows: in §2, we present the open cluster sample used in this research and study the cluster age difference versus separation. The closest pairs are presented in §3. In §4 we discuss our results and finally, in §5, we summarize our conclusions.
2 Open cluster age difference versus separation
In this paper, a sample of open clusters has been extracted from the Open Cluster Database 111http://www.univie.ac.at/webda/ (WEBDA, Mermilliod & Paunzen 2003). The latest update of WEBDA (April 2009, Paunzen & Mermilliod 2009) includes 1028 open clusters with both age and distance known (out of a total of 1756 objects). This is the sample used to study the hierarchical properties of star formation in the Milky Way disk. In principle, WEBDA does not contain stellar associations or embedded clusters. Following Efremov & Elmegreen (1998), we consider all cluster pairs from the sample under study (527,878) and obtain their physical separation (in the usual metric) in pc and age difference in Myr. Then and within certain age ranges, we calculate the average age difference among these clusters as a function of their physical separation for regular intervals of separation (50 pc). As for the age difference, the absolute value is computed. In Efremov & Elmegreen (1998) the intercluster separation is defined to be the de-projected distance between the two clusters, considering zero depth to the LMC and an inclination of 33∘. This is a major difference with respect to the definition used in our present work: here we use full spatial separations. Open clusters form in star complexes. Efremov (1978) gave the first quantitative definition of the term Star Complex, vast aggregates of stars with an average diameter of 600 pc and an age of tens of millions of years, encompassing stars that originated in the same gas-dust complex. Elmegreen (2009) has shown that the clump scale for giant cloud formation is 600 pc for local galaxies; at larger redshifts, however, the clump scale is larger, 1500 pc. This is why, in our analysis, we focus on the pair subsample with separations 600 pc (31641 pairs). As the probability of finding a cluster pair (of random ages) with separation 600 pc is 0.06, it may be argued that the 600 pc size-scale is arbitrary as most open clusters do not form within complexes. This concern can be, however, neglected. The characteristic time-scale for stars to become part of the field stellar populations is 10-20 Myr (e.g. Battinelli & Capuzzo-Dolcetta 1989, 1991; Lada & Lada 1991, 2003; Kroupa & Boily 2002; de la Fuente Marcos & de la Fuente Marcos 2004, 2008; Bastian et al. 2005; Fall et al. 2005). If we restrict our analysis to open clusters younger than 20 Myr (212 clusters), we observe that 67% of them have at least one neighbor in the same age group within 300 pc, 86% of them within 600 pc, and 93% within 1000 pc. Therefore, the present-day fraction of open clusters formed away from complexes in the Galactic disk appears to be rather negligible.
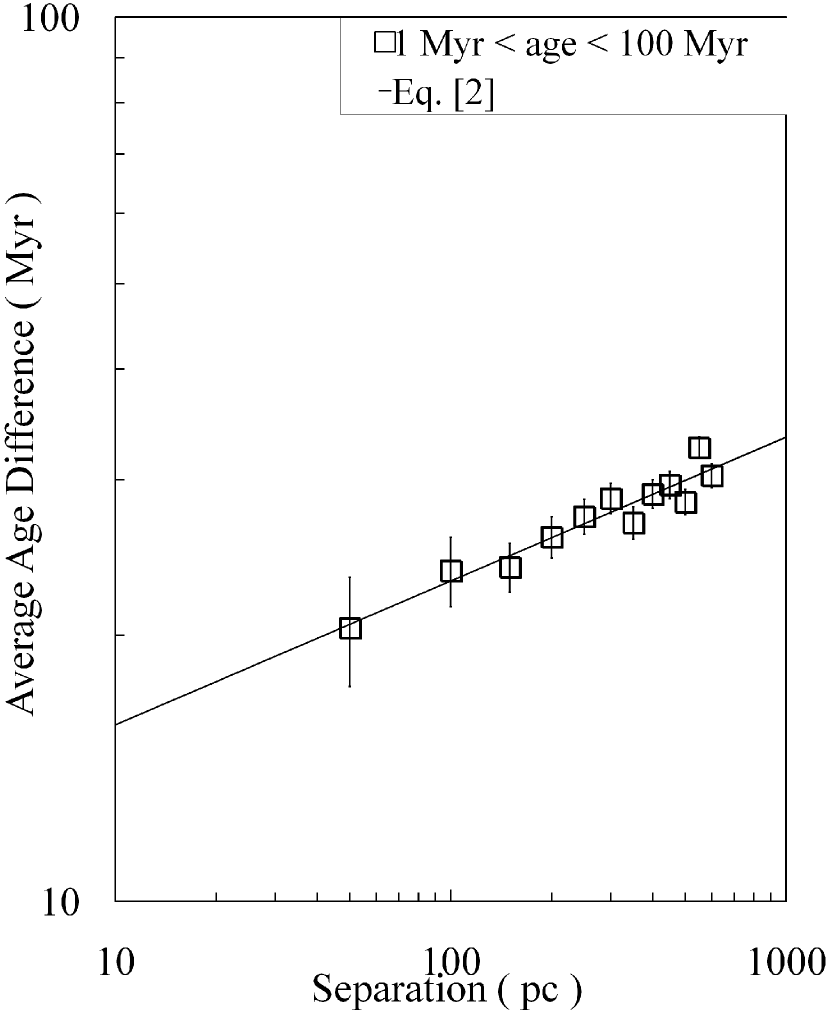
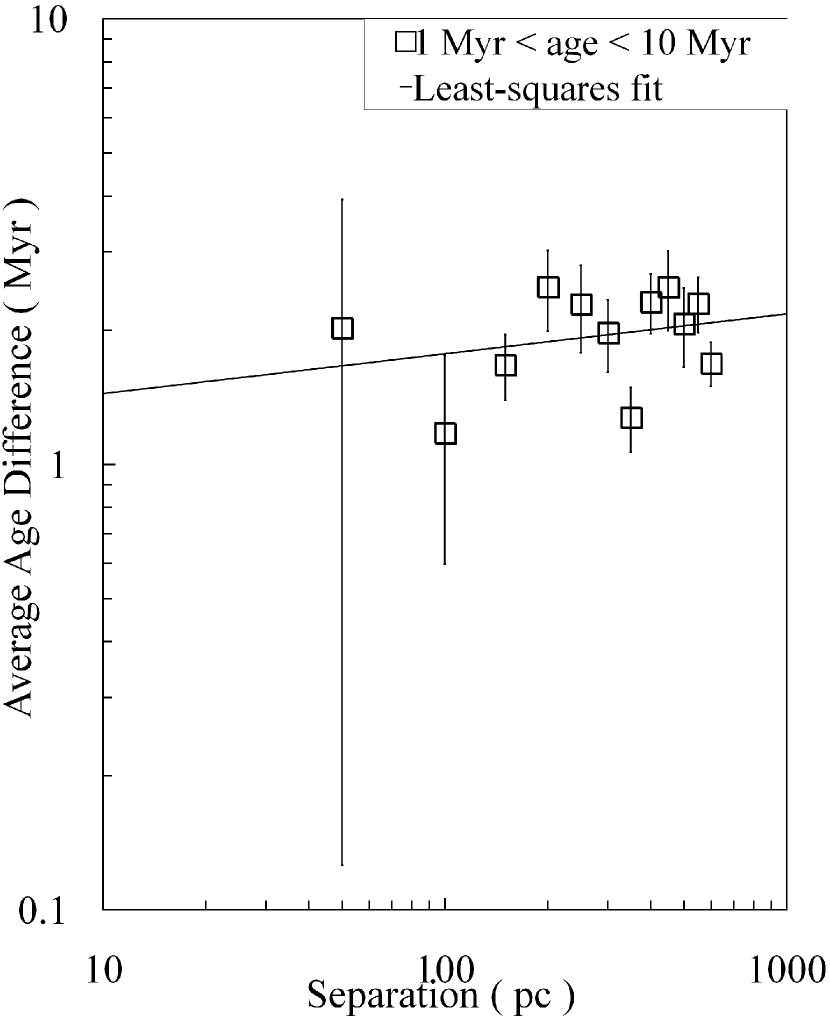
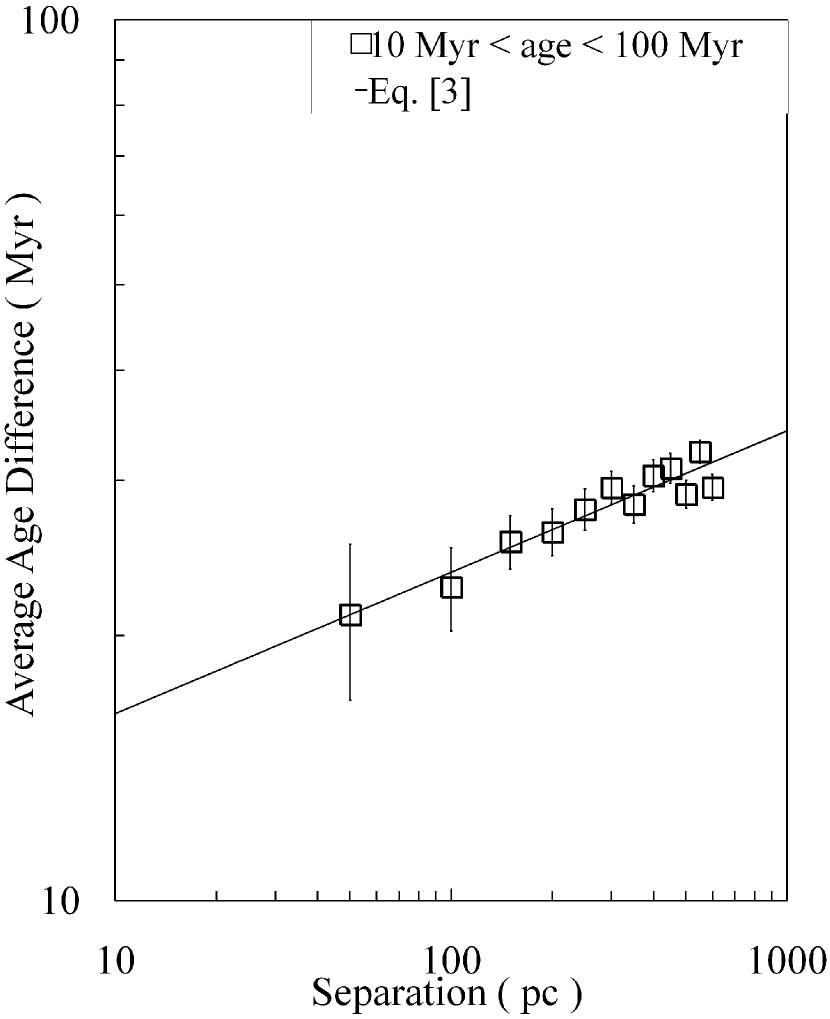
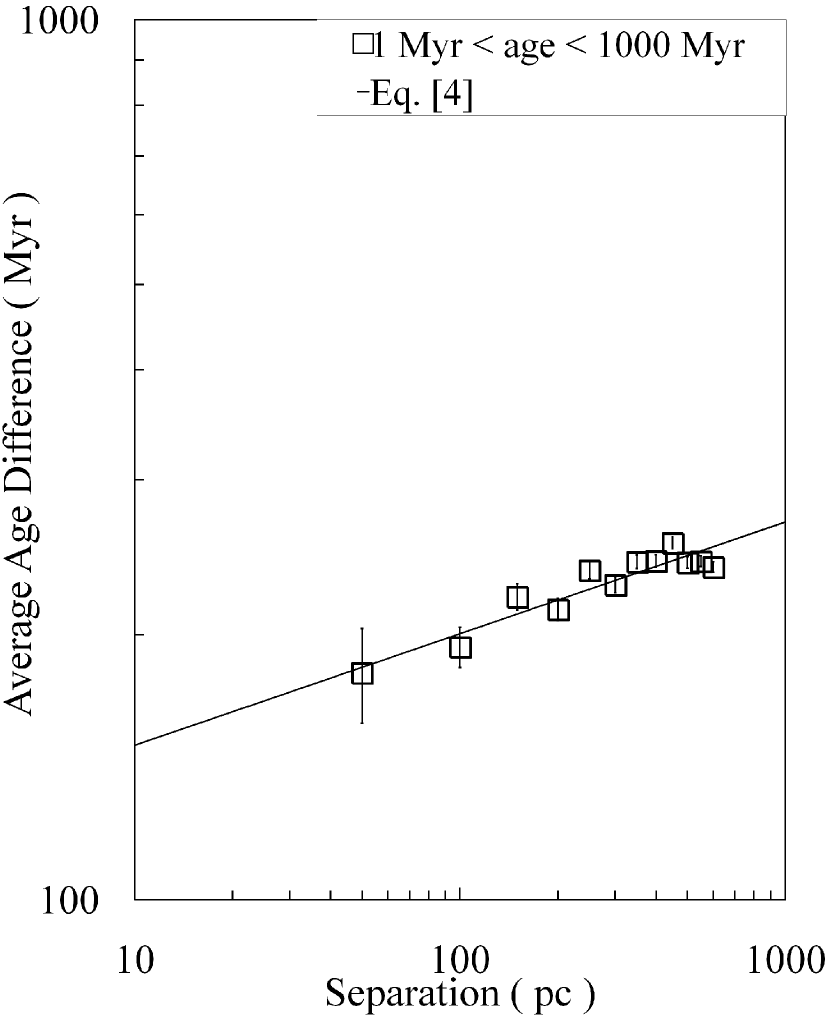
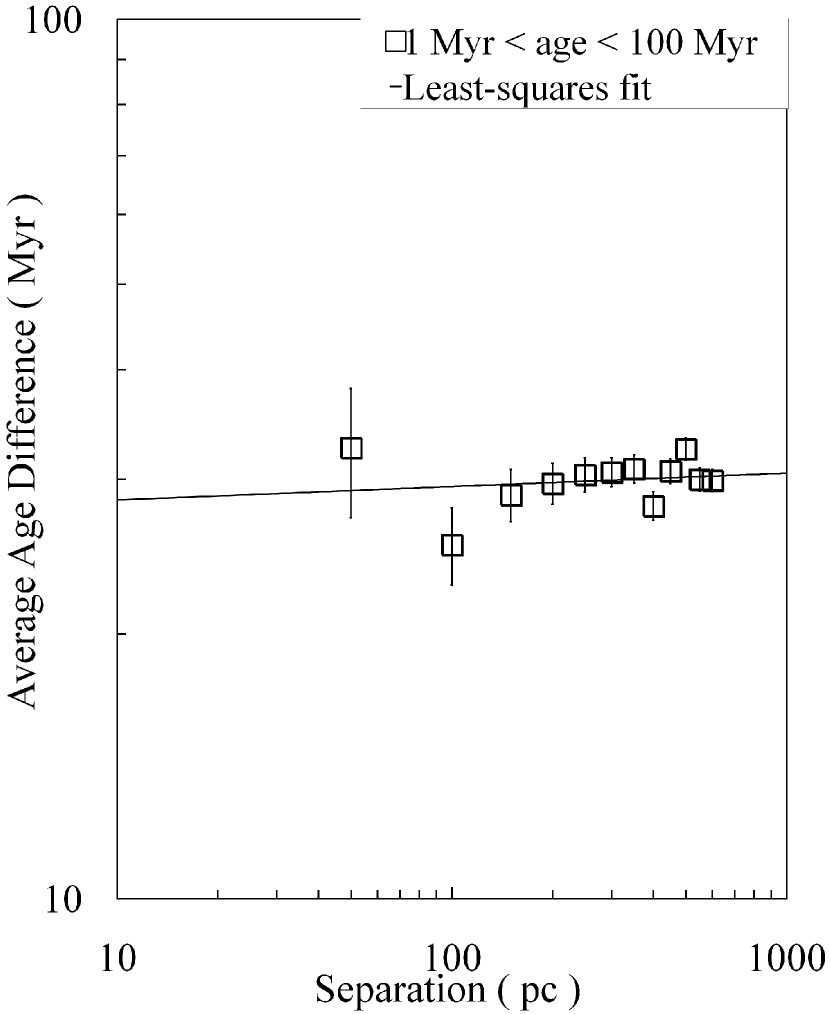
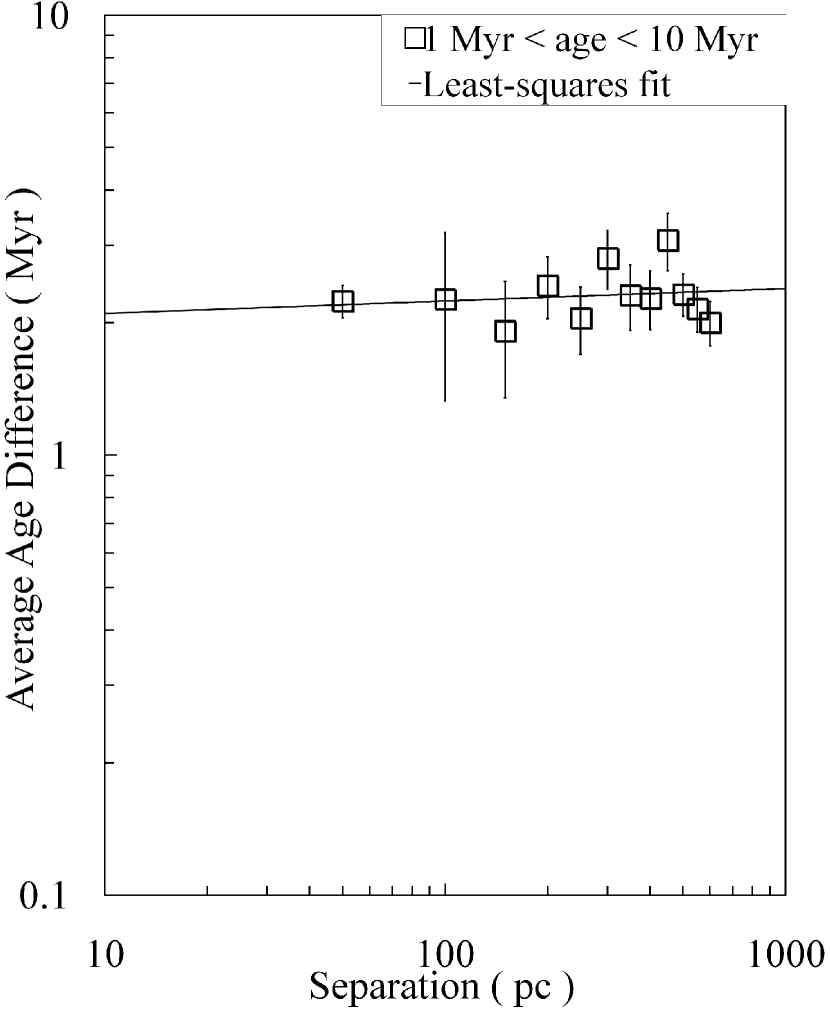
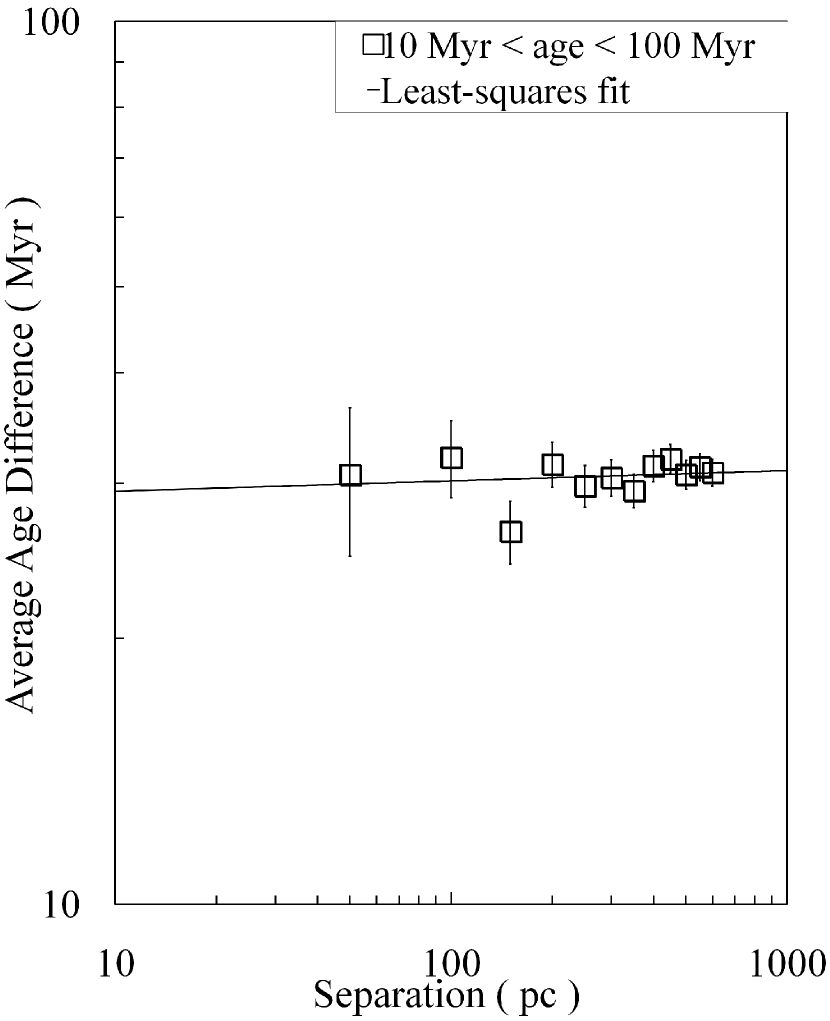
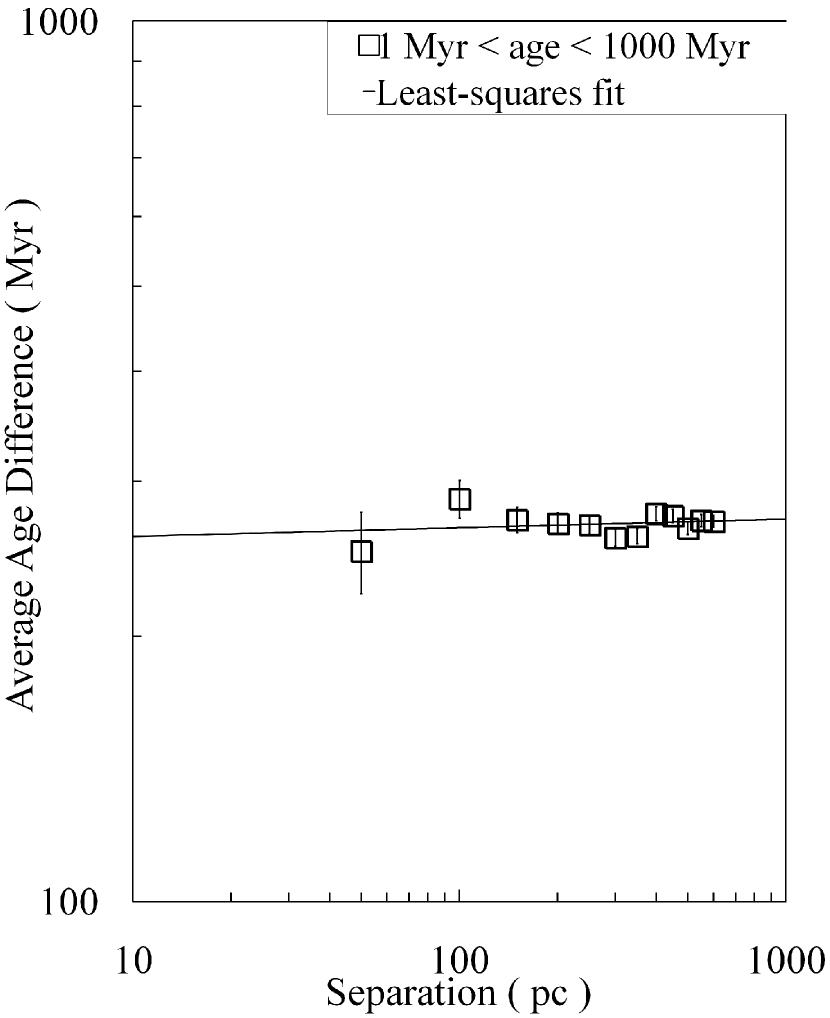
The results of the calculation described above are shown in Figure 1. Error bars display the standard error in the mean. As in Efremov & Elmegreen (1998) and in order to facilitate direct comparison, four age intervals are considered: 1 to 100 Myr, 1 to 10 Myr, 10 to 100 Myr, and 1 to 1000 Myr. The average age difference between pairs of open clusters increases systematically with their spatial separation. The number of clusters pairs within these age intervals is 5286, 241, 3637, and 27142, respectively. The least-squares fits in the = 0-600 pc separation range for the, statistically significant, relations shown in Figure 1 are:
| (2) |
| (3) |
| (4) |
The correlation coefficients for these three fits are 0.96, 0.96, and 0.94, respectively. The 1-10 Myr data interval results are not statistically significant (low number of open cluster pairs and correlation coefficient of 0.27). On the other hand, cluster ages 10 Myr are highly unreliable. The probable uncertainties of the parameters of the straight-line fit have been calculated as described in Press et al. (2002), page 664. The goodness of fit has been estimated using the Pearson product-moment correlation coefficient ( = 1 for perfect fit, e.g. Wall & Jenkins 2003). The determination coefficient () yields the proportion of the variance in the dependent variable that can be explained by the regression equation.
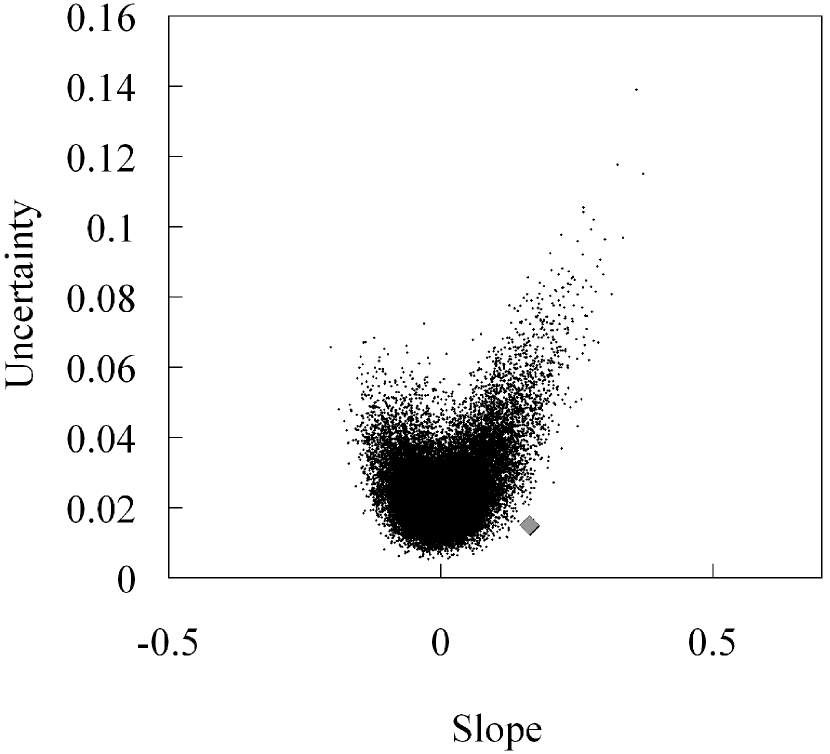
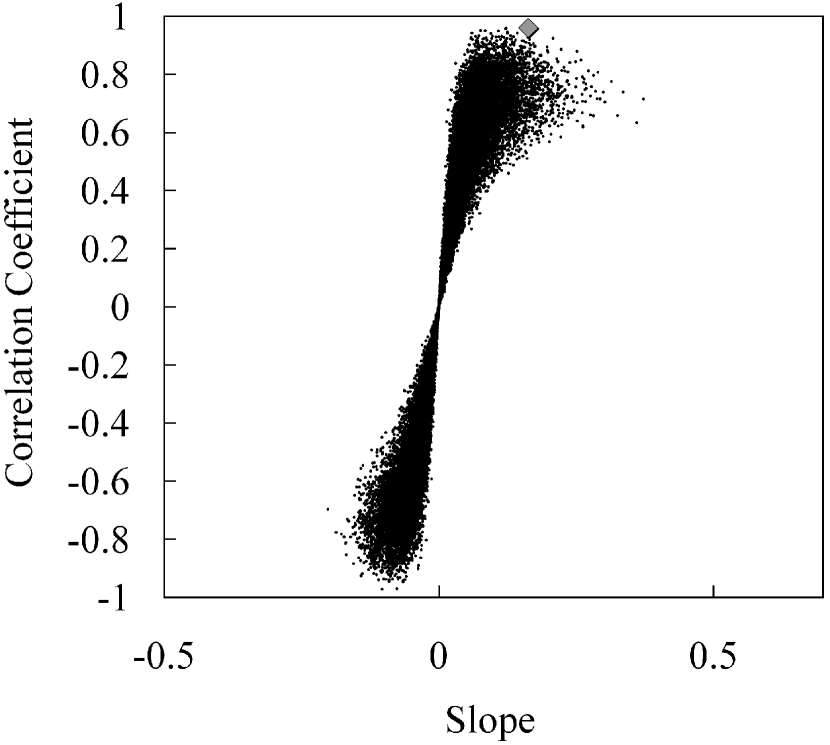
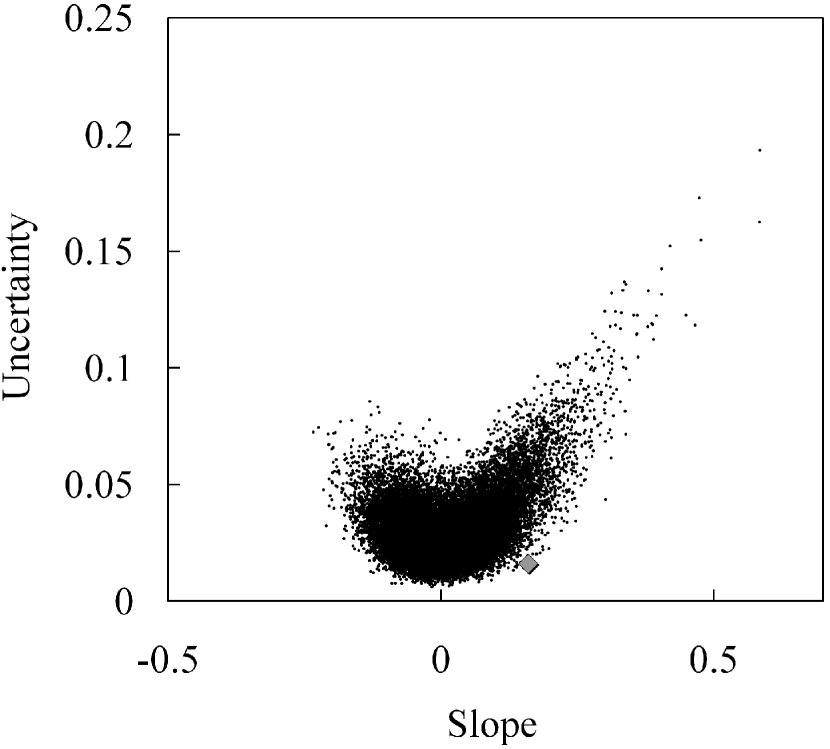
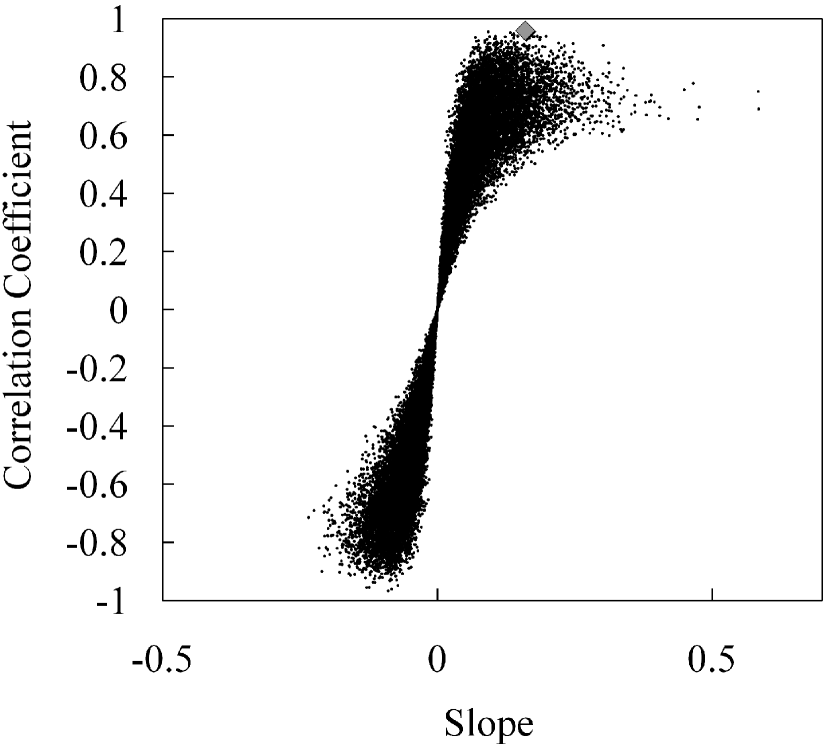
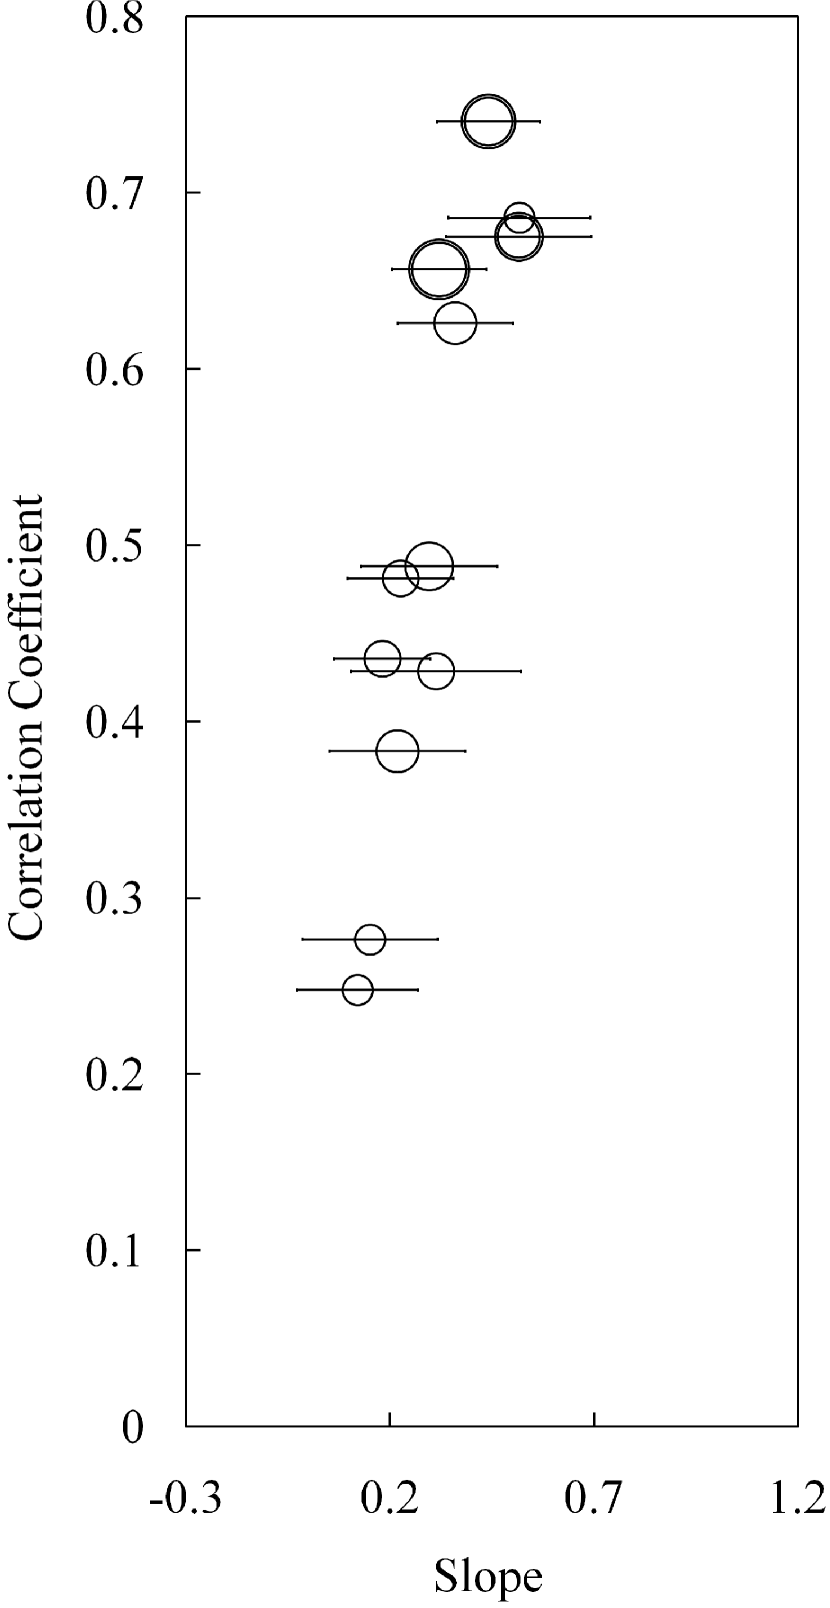
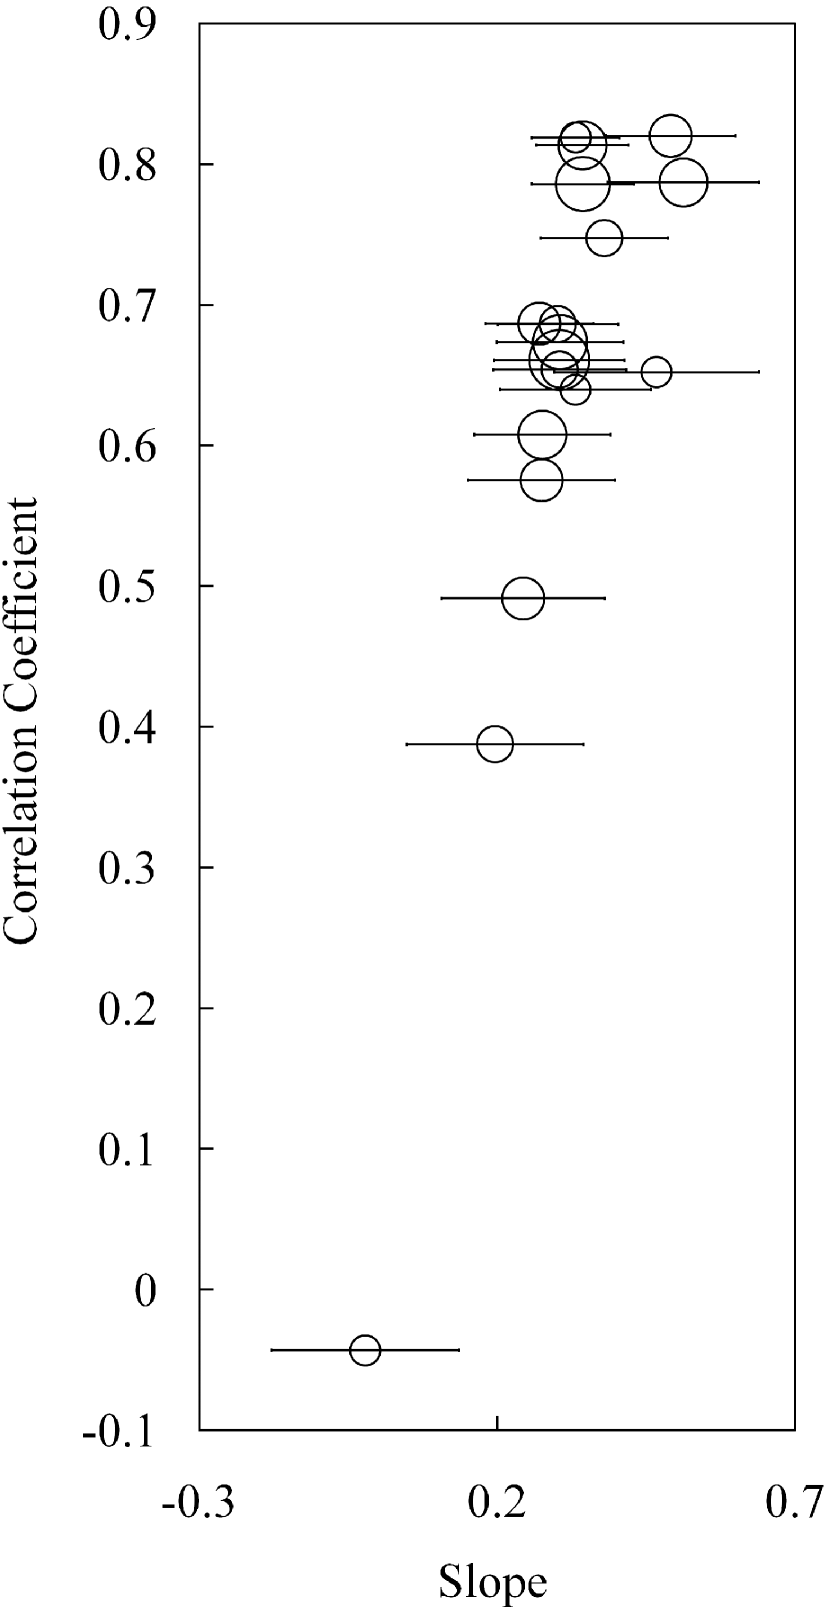
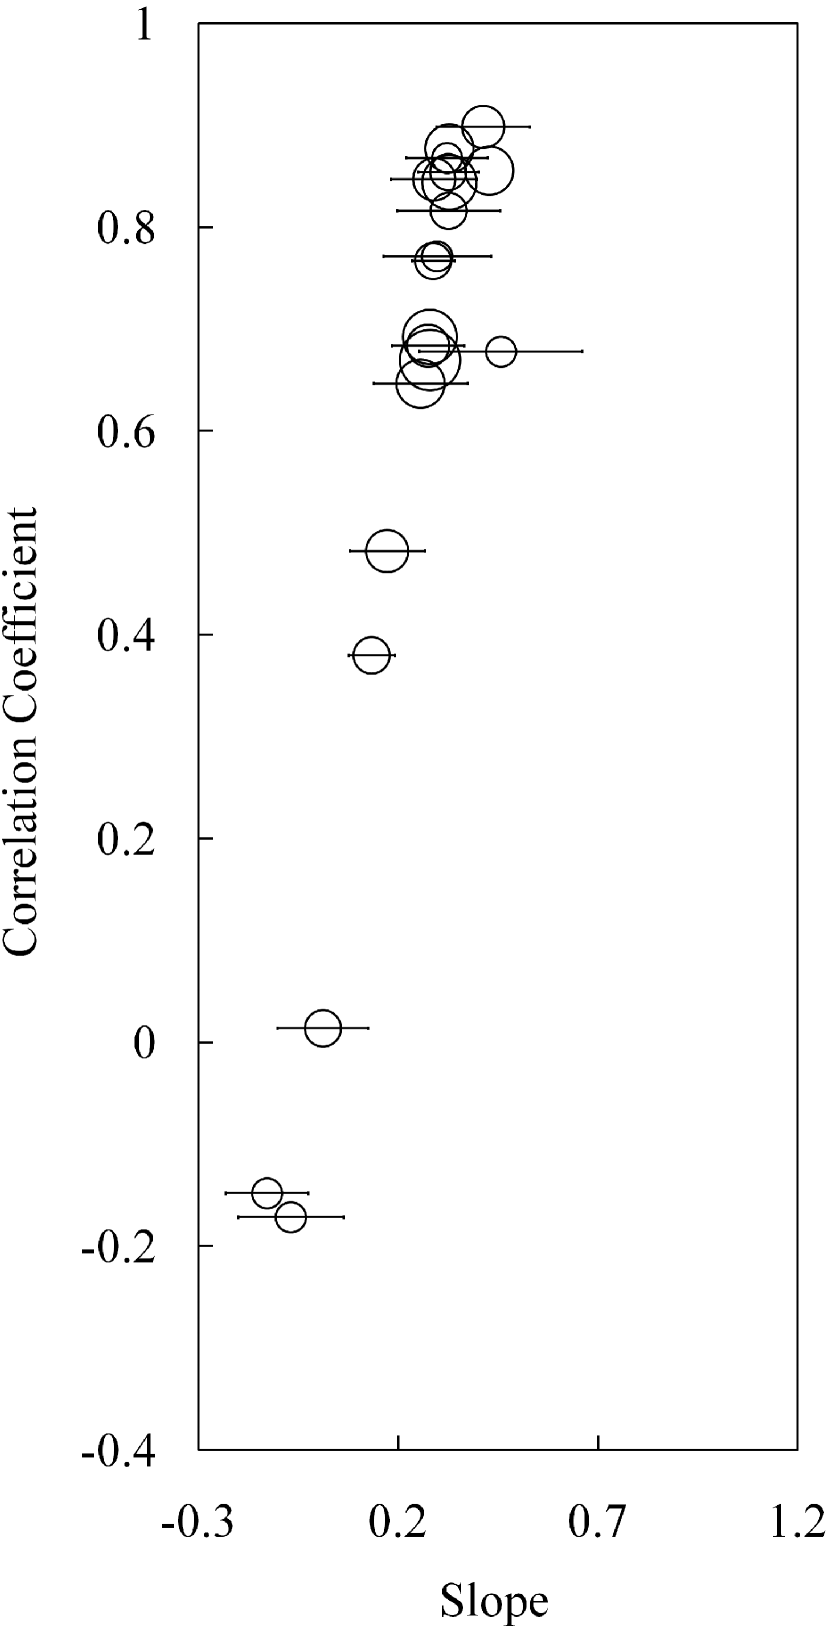
But, could the apparent correlation obtained from the above equations be a statistical artifact? What is the likelihood of getting by chance a joint combination of average age difference and cluster pair physical separation that would be correlated 0.96 or greater? A statistical test of randomly scrambled age data and real open cluster positions similar to the one used in Efremov & Elmegreen (1998) confirms that the correlation found above is statistically robust as it disappears for randomized data. We have completed 50,000 trials with randomly scrambled age data and real open cluster positions; the real cluster ages are reassigned randomly to different clusters. Figure 2 is analogous to Figure 1 and shows the results of one of these trials. The correlations disappear as the average age difference tends to be the same regardless of separation. Figure 3 provides the results of the entire set of 50,000 trials. Two plots are displayed: the uncertainty in the slope as a function of the slope itself (left) and the correlation coefficient as a function of the slope (right). The top panels correspond to the 1-100 Myr age range and the bottom panels show the same results for the 10-100 Myr age range. The original results are also displayed as black diamond symbols. For the 1-100 Myr age range, the probability of finding a random trial with slope within 1 of the value obtained for the real data is 0.010. If we also impose that the correlation coefficient is 0.8, that probability decreases to 0.0026. If the correlation coefficient has to be 0.9 we find 15 favorable cases. For 0.95 only 1 favorable case is found out of 50,000 trials. The probability of getting by chance such a correlation (ours was 0.96), or higher, is completely negligible. This result clearly indicates that the open cluster correlation is statistically robust.
On the other hand, the fact that Figure 3 exhibits a very noticeable asymmetry may hint of a data processing problem or data quality issue and argue against the validness of the analysis presented in the previous paragraph. Even with the randomized age trials, a positive slope is favored in the displayed age ranges. There is however an obvious reason for this asymmetry: for an open cluster sample in the range 1-100 Myr, the number of objects in the age range 1-20 Myr is nearly 50% of the sample size (see, e.g., Fig. 2 in de la Fuente Marcos & de la Fuente Marcos 2008). For a young cluster, the probability of getting a reassigned age that is relatively close to its actual age is rather high. The rapid decrease in cluster numbers for ages older than 20 Myr (infant mortality) is the result of catastrophic gas ejection (e.g. Boily & Kroupa 2003; Goodwin & Bastian 2006), a process that, although frequently ignored, was first proposed by Hills (1980). The asymmetry is greatly reduced if the age range 1-1000 Myr is considered. The observed asymmetry can be understood as the signature of early cluster disruption. The effect is also apparent in Efremov & Elmegreen (1998, Fig. 3) but no explanation is given there.
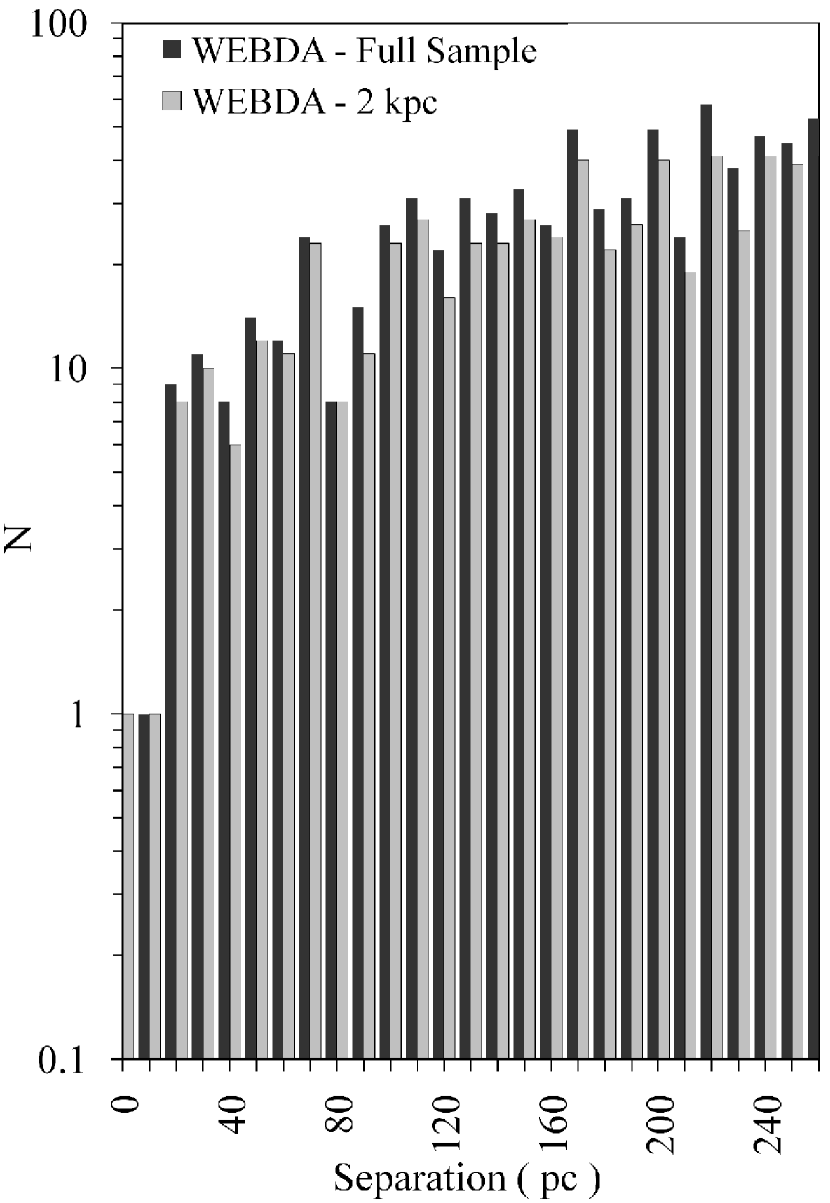
The sample considered above is, in principle, not volume-limited and it may be argued that it is strongly biased in favor of young objects as older open clusters are less likely to be included because they are more difficult to identify. Completeness of general open cluster samples has been traditionally approached under the assumption of uniform surface density of open clusters in the Solar Neighborhood (Battinelli & Capuzzo-Dolcetta 1989, 1991). This hypothesis implies , where is the number of clusters and , a given heliocentric distance. In their papers, it was found that for open clusters within 2 kpc from the Sun and brighter than = -4.5, the assumption of uniform average number density of open clusters was matched well by the observational results. Their sample of 100 objects included clusters younger than 1.6 Gyr (Battinelli et al. 1994). More recently, Piskunov et al. (2006) have concluded that assuming uniform density the completeness limit for clusters of any age could be 0.85 kpc. We found similar results in our sample: for objects in the age range 1-1000 Myr located within 0.9 pc from the Sun the power-law index is 1.960.05 with a correlation coefficient of 0.998. For clusters in the age range 200-1000 Myr located within 1 kpc from the Sun with index 1.960.06 and = 0.996. Our sample is likely to be at least 90% complete for older clusters if the radial distance is restricted to 1 kpc. For open clusters with 2 kpc
| (5) |
and for 1 kpc
| (6) |
Not surprisingly, our volume-limited results are fully consistent, within the error limits, with those from the general sample discussed above as = 0-600 pc in all the calculations. The correlation coefficients are 0.96 and 0.87, respectively. Therefore, our initial sample was already, from a certain point of view, volume-limited and selection effects were rather negligible.
The correlation coefficients for the sample studied here are quite good and the results of the random trials are consistent, indicating that the open cluster - correlation is statistically significant. Following Efremov & Elmegreen (1998), we can conclude that open clusters in the Milky Way disk form in a hierarchical sequence in which the duration of star formation in a region scales with the power of the region size over scales smaller than 600 pc. The error quoted here is the result of a formal least-squares fit and not the absolute uncertainty. The correlation can be written as:
| (7) |
The difference found between the Milky Way and the LMC (Equation 1 vs. Equation 7) regarding the slope of the correlation is therefore statistically significant. Could it be the result of different galaxy type? After all, the Milky Way is a disk galaxy dominated by a spiral arm structure. The LMC is classified as a barred Magellanic spiral galaxy (SBms) and is morphologically in between normal spiral galaxies and irregular galaxies. It has one spiral arm and a bar. The LMC displays a very prominent bar near its center, suggesting that it may have previously been a barred spiral galaxy. A significant number of candidate binary clusters in the LMC appear to be associated with the bar (e.g. Leon et al. 1999). Most clusters appear to be associated with the bar and a surrounding structure that could be the result of the interaction between the LMC and the SMC (Bica et al. 1996). The LMC bar is a region with increased cluster density and 46% of all bar clusters can be found in close pairs or multiple systems (Dieball & Grebel 1999; Dieball et al. 2002). The survival time for cluster pairs is longer in the bar region where the tidal field of the LMC is probably weaker (Bhatia 1990; Elson et al. 1987). Schommer et al. (1992) found that the LMC cluster system has kinematics consistent with the clusters moving in a disk-like distribution. Grocholski et al. (2007) have confirmed the existence of a single rotating disk with clusters and field stars lying in the same plane. The outer clusters also exhibit disk kinematics and there are clear signs of perturbations from the bar. The dominant effect of structure evolution in the LMC is general galactic dynamics (Bastian et al. 2009). With this scenario in mind, the formation and early dynamics of young clusters in the LMC may be indeed similar to what is observed in the inner disk of our own Galaxy, effect of the bar included. There is clear evidence of faster star formation in the direction of Scutum and Norma (de la Fuente Marcos & de la Fuente Marcos 2008) in the Milky Way disk. The results provided above seem to suggest that the different LMC and Milky Way star formation morphologies have a minor role in the overall organization of the spatial correlation of star formation. Certainly, the different strength of the spiral patterns may have some effect but it appears not to be dominant.
Unfortunately, in both the analysis completed above and the one in Efremov & Elmegreen (1998), the important effect of dissolving clusters has not been taken into consideration. The number of open clusters decreases over time because they merge, become unbound and dissolve after rapid mass ejection, or they evaporate as a result of two-body relaxation or tidal shocks with molecular clouds in the gravitational field of the Galaxy (see de Grijs & Parmentier 2007 for a recent review). The first two processes (merging and infant mortality) are only relevant during the early evolution of open clusters (clusters younger than 20-30 Myr), nearly 2/3 of clusters disappear during this initial stage (e.g. de la Fuente Marcos & de la Fuente Marcos 2008). Beyond that age, the third process becomes dominant and over a time-scale of 100 Myr, the surviving fraction of clusters (after the infant mortality phase) is depleted by about 25% (see de la Fuente Marcos & de la Fuente Marcos 2008 for a more detailed discussion). The role of cluster dissolution and its impact on the correlation obtained above is obviously not negligible; as clusters are depleted, the average intercluster separation increases. Fortunately, the effect of cluster dissolution is rather small in the age range 1-20 although incompleteness due to embedded clusters is relevant in the age range 1-10 Myr. This younger age group is strongly affected by detectability issues as embedded proto-open clusters may not be observable at optical wavelengths if the amount of internal extinction due to gas and dust is too high. The situation described in star complexes is similar to the one found in individual young open clusters where pre-main sequence stars (many of them still embedded in their primordial gas cocoons) are found together with fully functional main sequence stars. As a correction to the result in Equation 7 is mandatory, it should be based on the analysis of the open cluster population in the age range 10-20 Myr: the one for which the effects of cluster disruption and incompleteness are less relevant. In principle, such a correction has to preserve the power-law nature of the correlation, being independent on the age binning considered and providing a statistically relevant result. In order to implement this correction, we have considered all the possible binning range combinations (5 to 10 Myr) within that age interval and calculated the corresponding slope for each one of them. The binning choice naturally reflects the level of uncertainty in young clusters age determination. The result is displayed in Figure 4, right panel. The sizes of the result points are proportional to the age bin used. If we recalculate the average parameters of the relation using the values with the highest correlation coefficient (, so at least 50% of the variance in the average age difference can be explained by the regression equation), we obtain:
| (8) |
or
| (9) |
In other words, the overall effect of not accounting for the dissolving of clusters is to make the apparent characteristic star formation time-scale longer; i.e. star formation appears to be slower. This effect also affects the results in Efremov & Elmegreen (1998). The actual power index for the LMC after correction may well be in the range 0.4-0.6. If all the clusters in the age bin 10-20 Myr are considered and no averaging is attempted we obtain:
| (10) |
which is consistent with the previous determination but a factor 2 slower. The reasoning behind the averaging process is as follows. The peak in the open cluster age distribution is found at 15 Myr (de la Fuente Marcos & de la Fuente Marcos 2008). The embedded cluster phase lasts 10 Myr. After 20 Myr a sharp decline in cluster numbers is observed. On the other hand, the actual time-scales depend on the environmental conditions (location within the Galaxy). The averaging is an attempt to compensate for missing clusters because they have not yet been detected or because they have already been destroyed, the two ends of the age interval. It also accounts for the large uncertainties in young cluster age determination, likely 50% or more. It may however be argued that the 10-20 Myr data interval results are not statistically significant (low number of open cluster pairs, 424 pairs or less for each calculated value of the slope in Figure 4). If we attempt a random trial experiment analogous to the one described above, we obtain similar values for the probability of this result being obtained by chance, 0.0005. Therefore, we will consider our result as statistically robust.
The dissolution correction implemented above increases the value of the slope by nearly 50% but as pointed out previously there is an additional effect that may contribute to yield a smaller value for the slope and, therefore, a longer characteristic star formation time-scale. Our original sample is contrast-induced, magnitude-limited and some incompleteness is expected. A simple and robust approach to minimize the effects of incompleteness consists in considering volume-limited samples. In Figure 4 we display the equivalent findings (see above) for a subsample of clusters located within 1 kpc (left panel) and 2 kpc (middle panel) from the Sun. The slope increases (20%) with respect to the previous correction. For young clusters, samples may be considered 90% complete up to 2.5 kpc from the Sun (see de la Fuente Marcos & de la Fuente Marcos 2008, Figure 1). The number of cluster pairs in the entire sample for the age range 10-20 Myr is 424 and the number for the 1 and 2 kpc samples are 140 and 336, respectively. Therefore and in order to preserve some statistical significance, we will consider the subsample found within 2 kpc from the Sun. Recalculating the average parameters of the relation using again the values with the highest correlation coefficient (), we now obtain:
| (11) |
or
| (12) |
The rationale for adopting as our best subsample all clusters in the age interval 10-20 Myr and located within 2.0 kpc from the Sun is that in a volume-limited sample and at these young ages, the vast majority of the open clusters present have been detected even in the presence of early gas expulsion. The 1 kpc subsample produces a slightly higher value for the slope, 0.440.13, but its error interval overlaps with that of the 2 kpc sample so we choose the 2 kpc value for being statistically more significant. The value found is a plausible lower limit for the correction factor. The apparently strong correlation observed in Figure 4 is a natural consequence of the fact that data with low correlation results in models with slope close to zero. On the other hand, if the slope is significantly different than zero, then the regression model can actually be of some use. The clusters of points around the optimal values contribute to enhance this apparent correlation.
Equation 12 strongly supports the idea of rapid star formation: for a 40 pc cloud, the time-scale for star formation is just 1 Myr. This result is consistent with works by Elmegreen (2000, 2007), Ballesteros-Paredes & Hartmann (2007) and Tamburro et al. (2009). The formation times in dense, bound clusters suggest that the main star formation activity is over in 3 Myr.
3 The closest pairs
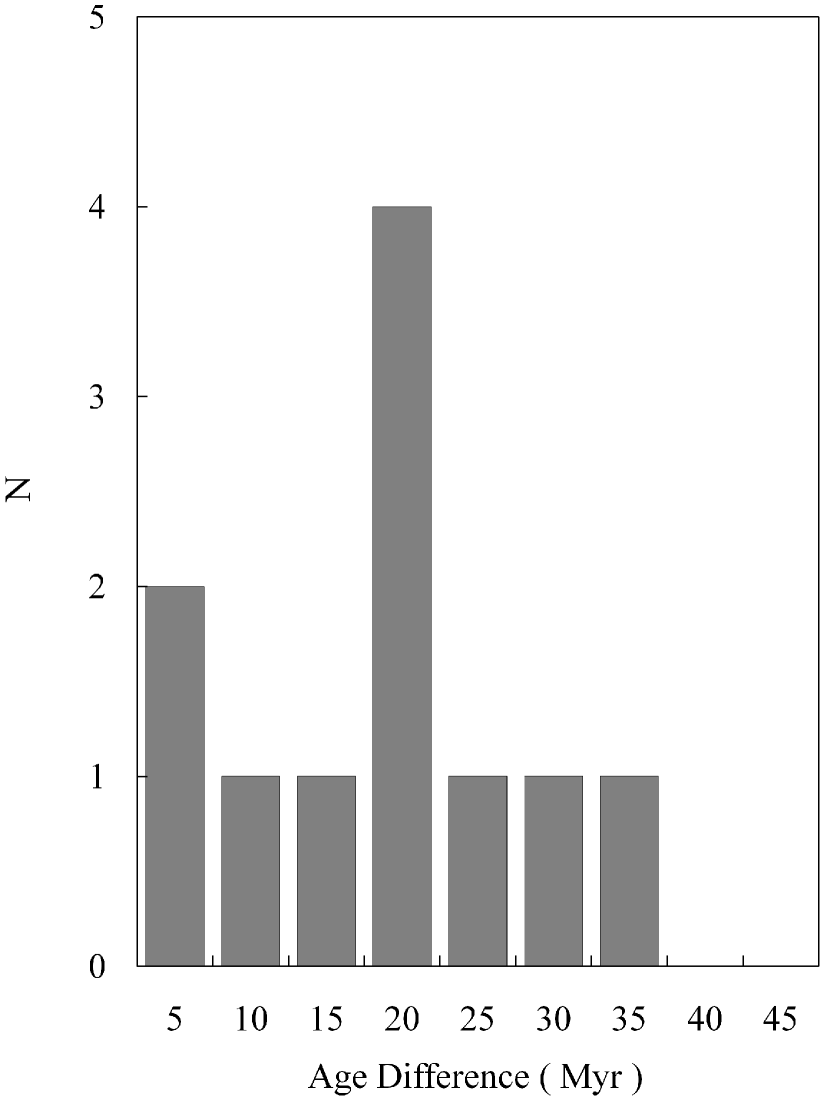
The existence of double/binary star clusters in the Clouds of Magellan was first proposed by Bhatia & Hatzidimitriou (1988, LMC) and Hatzidimitriou & Bhatia (1990, SMC). Over the last few years, this result has been widely accepted (see Dieball et al. 2002 for a recent study). On the other hand, attempts to identify binary open cluster candidates in the Milky Way have given a number of probable pairs (see Subramaniam et al. 1995 for a catalog). To date, the only widely accepted double or binary open cluster in the Galaxy is the Persei pair (NGC 869/NGC 884). The actual physical (not projected) separation between the pair members is, however, 267 pc (using WEBDA data). If they constitute a bound system, its binding energy must be very low and it is highly unlikely to persist in this hypothetical binary state for a long period of time. The analysis carried out in the previous section has produced a number of open cluster pairs with separations significantly below the value found for the Double Cluster. In Table 1 we compile a list of probable binary open clusters. The main criterion used in this compilation is purely dynamical: the pair separation must be less than three times the average value of the tidal radius for clusters in the Milky Way disk (10 pc, Binney & Tremaine 2008). Following Innanen et al. (1972), for two clusters separated by a distance larger than three times the outer radius of each cluster, the amount of mutual disruption is rather negligible. This simple criterion produces only 34 pairs (6.6% of clusters in our full sample). Out of them, we select those with an age difference 45 Myr as they are the most likely candidates to be actual binary open clusters; they are very close and almost coeval. The cluster pair separation histogram for this young sample is displayed in Figure 5. Here we only focus on cluster pairs closer than the Double Cluster separation. Only a few pairs are closer than 40-50 pc. Most of these pairs could be undergoing some type of tidal interaction. The age difference distribution for the closest, likely interacting, subsample is shown in Figure 6. In an effort to rate the strength of this interaction, we propose the following classification scheme (13) based only in the values of separation () and tidal radii ():
| (13) |
In order to apply this criterion, we use tidal radii from Piskunov et al. (2008). These radii have been determined in a self-consistent way from a fitting of King’s profiles. For young clusters, the values calculated by Piskunov et al. (2008) show just small discrepancies with respect to previous determinations by Lamers et al. (2005). The classical King’s Law (King 1962, 1966) is able to fit the overall density of globular clusters very well and also the density profiles of some elliptical galaxies moderately well. It is based on an extensive study of the distribution of stars in globular clusters. The empirical King profile is described by the expression:
| (14) |
where is the central surface density, is a scale factor commonly called the core radius and is the value of (the distance from the assumed cluster center) at which reaches zero, the limiting or tidal radius. Using a King density profile to model the surface density of young open clusters is a normal practice but it presents two main problems: it assumes implicitly that the system under study is bound and the tidal radius may be underestimated due to cluster ellipticity. Interacting clusters are expected to be elliptical in shape (de Oliveira et al. 2000; Carvalho et al. 2008). We refer the reader to the original paper by Piskunov et al. (2008) for the details on how these shortcomings have been addressed. If the value of the tidal radius is unknown, the pair type is left blank.
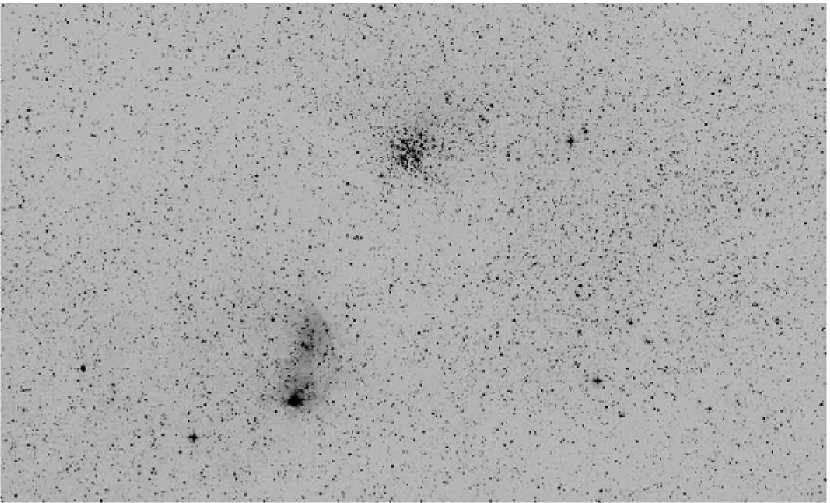
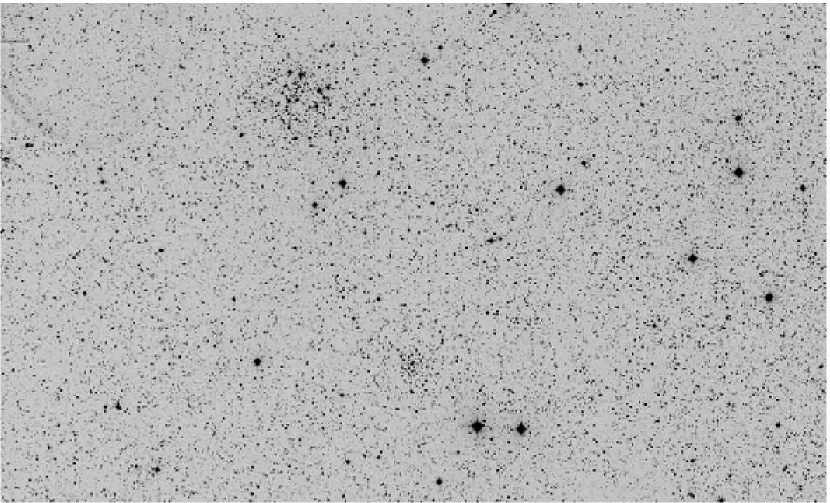
No clusters in Table 1 appear to be in-contact (the strongest interaction level); therefore, it is either physically impossible or, more likely, current observational techniques are unable to properly separate young overlapping clusters. An alternative but a bit speculative possibility is that when close enough, the time-scale for subsequent merging or mutual tidal destruction of clusters is very short (likely less than 16 Myr, the average value of the age difference for pairs in Table 1). Only one pair is candidate to be in the following level of significant interaction, semi-detached: NGC 6618(M 17)/NGC 6613(M 18) in Sagittarius by the Omega Nebula. Again, we must emphasize the strong observational selection effect against identifying pairs of clusters in the semi-detached and in-contact categories. In contrast, the number of weakly interacting clusters is relatively significant, 5 pairs. One of them may constitute a candidate hierarchical triple system, with NGC 1976/NGC 1981 interacting weakly and Collinder 70/NGC 1981 fully detached. NGC 1976 is the Orion Nebula cluster or Trapezium cluster, Collinder 70 is the Orion’s Belt cluster. Also in Orion, we find the weakly interacting pair ASCC 20/ASCC 16. NGC 3324/NGC 3293 is located in Carina (see Figure 7, top), NGC 663/NGC 659 is located in Cassiopeia (see Figure 7, bottom), and NGC 6871/Biurakan 1 is found in Cygnus. Besides the pair Collinder 70/NGC 1981, the only other detached pair is ASCC 21/ASCC 18 also in Orion. The pair ASCC 50/Collinder 197 is located in Vela, NGC 6250/Lynga 14 is in the border between the constellations Ara and Scorpius, and Trumpler 24/NGC 6242 is found in Scorpius. Not surprisingly, all the proposed candidate binary open clusters are in the vicinity of well known OB stellar associations and/or HII region complexes. The Orion Nebula neighborhood appears to be the region with the highest open cluster density and it is also the closest. All the candidates identified here are young and, therefore, they are expected to retain an almost primordial kinematics with similar radial velocity and proper motions within the pair unless we are witnessing an ejection after a close fly-by (as may be the case in pair #8). Two pairs (#5 and #8) are displayed in Figure 7. It is rather difficult to find public data in which any of the pairs in Table 1 are portrayed together. In one of the displayed cases, #5, we clearly observe that the oldest cluster in the pair appears to be significantly more expanded. This is consistent with findings by Baumgardt & Kroupa (2007): after gas expulsion, surviving clusters have typically expanded by a factor of 3 or 4 due to gas removal. This behavior was already predicted on purely theoretical grounds by Hills (1980).
4 Discussion
Star complexes appear to be the largest coherent star-forming units in the Milky Way disk and elsewhere. With characteristic diameters of about 600 pc, if we apply Equation (7), the intrinsic star formation time-scale for these structures is 30 Myr. Star clusters form in a shorter time-scale in the LMC, this is correct even if we take into account the effects of cluster dissolution and incompleteness. That may explain why, in general, young clusters are more massive in the LMC. For size-scales 350 pc, the clustered star formation time-scales in the Milky Way and the LMC are nearly the same: for star complexes both are 30 Myr. If we accept the results based only on the 10-20 Myr age range as statistically significant and the cluster dissolution correction is included, the characteristic star formation time-scale in the quiescent Milky Way disk is dramatically reduced: 1 Myr. This value supports the idea of rapid star formation and is consistent with recent results compiled by Ballesteros-Paredes & Hartmann (2007): the median age of stars in nearby molecular clouds is 1-2 Myr and the median age of star-forming molecular clouds is also 1-2 Myr. On the other hand, the existence of a relatively large number of almost equal-age pairs implies that star formation is synchronized in neighboring regions, which means that there is only a short time interval available for the complete formation of a cluster and its neighbor (Elmegreen 2000). Tamburro et al. (2009) have recently found a short time-scale for the most intense phase of star formation in spiral arms, 1-4 Myr. A considerable fraction of giant molecular clouds exist only for a few Myr before forming stars.
Although statistically robust, our results are affected by the intrinsic errors associated to the determination of open cluster parameters. The current status of the accuracy of open cluster data in the Milky Way has been reviewed by Paunzen & Netopil (2006). In this work, it is pointed out that distances are rather well known because for about 80% of 395 of the best studied objects, the absolute error is 20%. The situation is just the opposite for ages, with only 11% of the investigated open clusters (best sample again) having errors 20% and 30% with absolute errors 50%. Besides, errors are age dependent and the ones associated to young clusters are sometimes significantly larger (in average) than those of older objects (see their list of 72 suggested standard open clusters): 20-30% in the best possible cases. In a large sample, these errors are very likely to be non-homogeneous as different methods have been used by different authors to calculate the ages. In order to check for consistency, we have also used the New Catalogue of Optically Visible Open Clusters and Candidates (NCOVOCC)222http://www.astro.iag.usp.br/wilton/. The first version of this catalogue was presented in Dias et al. (2002). The February 2009 version (v2.10, Dias 2009) includes 1787 objects, with distances and ages for 982 clusters. If we repeat the calculations using the values provided by NCOVOCC for the full sample we obtain consistent values:
| (15) |
| (16) |
| (17) |
The corrected value for the slope is now 0.420.07 which is also consistent with the value obtained using data from WEBDA. Unfortunately, the situation is significantly worst for the LMC where, in addition to the problems with age determinations, the issue of computing the actual physical distances to individual clusters is complicated by the nature of the host galaxy. In summary and if an optimistic perspective is adopted, all the numerical results obtained in this research may well be affected by errors of 20%. On the other hand and strictly speaking, our results are only applicable to current clustered star formation at the Solar Circle.
Regarding the presence of binary open clusters in the Milky Way disk, we conclude that there is a small population of candidate binary (and perhaps higher multiplicity) open clusters. Our list of candidates in Table 1 has only 1 pair in common with the classical study by Subramaniam et al. (1995): Collinder 70/NGC 1981 in Orion. This is to be expected as they used projected distances instead of physical separations. If open clusters are born in complexes with characteristic sizes of 600 pc, some clusters formed along the shock fronts induced by supernova explosions and all of them observed in projection, the likelihood of misidentifying large numbers of double but not physically close young clusters as actual binaries is very high. As clear examples of this situation let us consider the Persei pair discussed before or the double cluster NGC 1912/NGC 1907 identified by de Oliveira et al. (2002) as two clusters experiencing a fly-by (but the actual separation is 490 pc). One of the most intriguing properties of the sample in Table 1 is the relatively large number (62%) of pairs with large differences in the values of their tidal radii. According to recent simulations carried out by Portegies Zwart & Rusli (2007), cluster binary orbits tend to expand due to mass loss but the initially less massive cluster expands more quickly than the binary separation increases. Therefore and contrary to the stellar binary case, the less massive cluster tends to start mass transfer to the most massive cluster. Our results suggest that this process may already be happening within the pair NGC 6618/NGC 6613 as they exhibit the largest ratio of tidal radii ( 5) and the tidal radius of NGC 6618 is almost twice the pair separation. This system is probably bound to merge within the next few Myr. Besides, gas expulsion has also an effect on star cluster evolution; as pointed out before, Baumgardt & Kroupa (2007) have found that after gas removal the surviving cluster expands significantly although Hills (1980) was first in predicting this evolutionary behavior as well as early cluster disruption. In two cases the age difference is so small that the pairs are likely to be primordial, i.e. they were born twins: ASCC 18/ASCC 21 and NGC 3293/NGC 3324. In the other nine cases and taking into consideration the errors in age determination, the pair could be the result of capture in a high cluster density environment (the open cluster family, see de la Fuente Marcos & de Fuente Marcos 2008, 2009). In any case, the observed separations are unlikely to be primordial and they may have increased to produce eccentric orbits as described in Portegies Zwart & Rusli (2007). Regarding the observational selection effect against identifying pairs of clusters in the two highest levels of interaction, the recent results on Bochum 1 may shed some light on this issue. The area around Bochum 1 and FSR911 may be considered as a candidate example for in-contact pairs (see Bica et al. 2008 for details).
5 Conclusions
Our main conclusions can be summarized as follows:
(0) In the Milky Way, open clusters with large spatial separation also tend to have greater age separations. This result is independent on the age group. The correlation found is similar to the one identified for the LMC.
(1) Star formation in the Milky Way disk proceeds hierarchically.
(2) The average age difference between pairs of open clusters in the Milky Way disk increases with their separation as the 0.16 power. This result is obtained for the 1-100 Myr age interval and the 0-600 pc distance range. If the effects of open cluster dissolution and incompleteness are corrected by using volume-limited samples of clusters in the age interval 10-20 Myr, the value of the power index increases to about 0.4.
(3) Open cluster dissolution, if not properly accounted for, induces a significant overestimate in the characteristic star formation time-scale.
(4) Quiescent star formation in the Milky Way disk appears to be very rapid with a characteristic time-scale of about 1 Myr.
(5) The vast majority of open clusters appear to form within some type of complex.
(6) The Milky Way disk appears to host a small but non-negligible population of candidate binary open clusters.
(7) Components in a binary (or higher multiplicity) open cluster are likely formed together. This is a confirmation of the result first obtained by Fujimoto & Kumai (1997) and later supported by the analysis in Dieball et al. (2002).
(8) Identification of in-contact pairs, both , , is an extreme observational challenge. This may explain the absence of candidates of this type in our data set. An alternative but less likely interpretation may be that fully overlapping open clusters are extremely unstable with merging or tidal destruction time-scales 16 Myr, the average age difference for pairs in Table 1.
(9) Binary cluster candidates in the Galactic disk appear to show a tendency to have components of different size (5 out 8 studied pairs have size difference 50%). This is likely the result of dynamical interaction but it could also be caused by an observational selection effect against identifying large, not concentrated interacting clusters.
References
- (1) Ballesteros-Paredes, J., & Hartmann, L. 2007, Rev. Mexicana Astron. Astrofis., 43, 123
- (2) Bastian, N., Gieles, M., Ercolano, B., & Gutermuth, R. 2009, MNRAS, 392, 868
- (3) Bastian, N., Gieles, M., Lamers, H. J. G. L. M., Scheepmaker, R. A., & de Grijs, R. 2005, A&A, 431, 905
- (4) Battinelli, P., & Capuzzo-Dolcetta, R. 1989, Ap&SS, 157, 75
- (5) Battinelli, P., & Capuzzo-Dolcetta, R. 1991, MNRAS, 249, 76
- (6) Battinelli, P., Brandimarti, A., & Capuzzo-Dolcetta, R. 1994, A&AS, 104, 379
- (7) Baumgardt, H., & Kroupa, P. 2007, MNRAS, 380, 1589
- (8) Bhatia, R. K. 1990, PASJ, 42, 757
- (9) Bhatia, R. K., & Hatzidimitriou, D. 1988, MNRAS, 230, 215
- (10) Bica, E., Bonatto, C., & Dutra, C. M. 2008, A&A, 489, 1129
- (11) Bica, E., Claria, J. J., Dottori, H., Santos, J. F. C., & Piatti, A. E. 1996, ApJS, 102, 57
- (12) Binney, J., & Tremaine, S. 2008, Galactic Dynamics, 2nd Ed. (Princeton: Princeton University Press)
- (13) Boily, C. M., & Kroupa, P. 2003, MNRAS, 338, 673
- (14) Dias, W. S. 2009, Catalog of Optically Visible Open Clusters and Candidates, v. 2.10., http://www.astro.iag.usp.br/wilton/.
- (15) Dias, W. S., Alessi, B. S., Moitinho, A., & Lépine, J. R. D. 2002, A&A, 389, 871
- (16) Dieball, A., & Grebel, E. K. 1999, in New Views of the Magellanic Clouds, ed. Y.-H. Chu, N. B. Suntzeff, J. E. Hesser, & D. A. Bohlender, IAU Symposium v. 190, pp. 440
- (17) Dieball, A., Müller, H., & Grebel, E. K. 2002, A&A, 391, 547
- (18) Carvalho, L., Saurin, T. A., Bica, E., Bonatto, C., & Schmidt, A. A. 2008, A&A, 485, 71
- (19) Efremov, Y. N. 1978, Sov. Astr. Lett., 4, 66
- (20) Efremov, Y. N., & Elmegreen, B. G. 1998, MNRAS, 299, 588
- (21) Elmegreen, B. G. 2000, ApJ, 530, 277
- (22) Elmegreen, B. G. 2007, ApJ, 668, 1064
- (23) Elmegreen, B. G. 2009, in The Galaxy Disk in Cosmological Context, ed. J. Ansersen, J. Bland-Hawthorn & B. Nordstrom, IAU Symposium v. 254, pp. 289
- (24) Elmegreen, B. G., Elmegreen, D. M., Salzer, J. J., & Mann, H. 1996, ApJ, 467, 579
- (25) Elson, R. A., Fall, S. M., & Freeman, K. C. 1987, ApJ, 323, 54
- (26) Fall, S. M., Chandar, R., & Whitmore, B. C. 2005, ApJ, 631, L133
- (27) de la Fuente Marcos, R., & de la Fuente Marcos, C. 2004, New Astronomy, 9, 6
- (28) de la Fuente Marcos, R., & de la Fuente Marcos, C. 2008, ApJ, 672, 342
- (29) de la Fuente Marcos, R., & de la Fuente Marcos, C. 2009, New Astronomy, 14, 180
- (30) Fujimoto, M., & Kumai, Y. 1997, AJ, 113, 249
- (31) de Grijs, R., & Parmentier, G. 2007, Chinese J. Astron. Astrophys., 7, 155
- (32) Goodwin, S. P., & Bastian, N. 2006, MNRAS, 373, 752
- (33) Grocholski, A. J., Sarajedini, A., Olsen, K. A. G., Tiede, G. P., & Mancone, C. L. 2007, AJ, 134, 680
- (34) Hatzidimitriou, D., & Bhatia, R. K. 1990, A&A, 230, 11
- (35) Hills, J. G. 1980, ApJ, 235, 986
- (36) Innanen, K. A., Wright, A. E., House, F. C., & Keenan, D. 1972, MNRAS, 160, 249
- (37) King, I. R. 1962, AJ, 67, 471
- (38) King, I. R. 1966, AJ, 71, 276.
- (39) Kroupa, P., & Boily, G. M. 2002, MNRAS, 336, 1188
- (40) Lada, C. J., & Lada, E. A. 1991, ASP Conference Series, 13, 3
- (41) Lada, C. J., & Lada, E. A. 2003, ARA&A, 41, 57
- (42) Lamers, H. J. G. L. M., Gieles, M., Bastian, N., Baumgardt, H., Kharchenko, N. V., & Portegies Zwart, S. 2005, A&A, 441, 117
- (43) Leon, S., Bergond, G., & Vallenari, A. 1999, A&A, 344, 450
- (44) Mermilliod, J.-C., & Paunzen, E. 2003, A&A, 410, 511
- (45) de Oliveira, M. R., Bica, E., & Dottori, H. 2000, MNRAS, 311, 589
- (46) de Oliveira, M. R., Fausti, A., Bica, E., & Dottori, H. 2002, A&A, 390, 103
- (47) Paunzen, E., & Mermilliod, J.-C. 2009, Open Cluster Database, http://www.univie.ac.at/webda
- (48) Paunzen, E., & Netopil, M. 2006, MNRAS, 371, 1641
- (49) Piskunov, A. E., Kharchenko, N. V., Röser, S., Schilbach, E., & Scholz, R.-D. 2006, A&A, 445, 545
- (50) Piskunov, A. E., Schilbach, E., Kharchenko, N. V., Röser, S., & Scholz, R.-D. 2008, A&A, 477, 165
- (51) Portegies Zwart, S. F., & Rusli, S. P. 2007, MNRAS, 374, 931
- (52) Press, W. H., Teukolsky, S. A., Vetterling, W. T., & Flannery, B. P. 2002, Numerical Recipes in C, 2nd Ed. (Cambridge: Cambridge Univ. Press)
- (53) Schommer, R. A., Suntzeff, N. B., Olszewski, E. W., & Harris, H. C. 1992, AJ, 103, 447
- (54) Subramaniam, A., Gorti, U., Sagar, R., & Bhatt, H. C. 1995, A&A, 302, 86
- (55) Tamburro, D. Rix, H.-W., Walter, F., Brinks, E., de Blok, W. J. G., Kennicutt, R. C., & Mac Low, M.-M. 2009, AJ, 136, 2872
- (56) Wall, J. V., & Jenkins, C. R. 2003, Practical Statistics for Astronomers (Cambridge: Cambridge Univ. Press)
| Pair # | Cluster 1 | Cluster 2 | Pair | ||||||
|---|---|---|---|---|---|---|---|---|---|
| (Myr) | (Myr) | (Myr) | (pc) | (pc) | (pc) | type | |||
| 1 | NGC 1981 | NGC 1976 | 31.6 | 12.9 | 18.7 | 3.9 | 6.6 | 7 | W |
| 2 | ASCC 20 | ASCC 16 | 22.4 | 8.5 | 13.9 | 12.6 | 9.1 | 13 | W |
| 3 | ASCC 50 | Collinder 197 | 30.2 | 13.4 | 16.8 | 12.0 | - | 20.5 | - |
| 4 | NGC 6250 | Lynga 14 | 26.0 | 5.2 | 20.8 | 12.1 | - | 20.7 | - |
| 5 | NGC 3293 | NGC 3324 | 10.3 | 5.7 | 4.7 | 7.8 | 18.8 | 21.0 | W |
| 6 | NGC 6613 | NGC 6618 | 16.7 | 1.0 | 15.7 | 7.3 | 38.2 | 21.9 | SD |
| 7 | NGC 1981 | Collinder 70 | 31.6 | 5.1 | 26.5 | 3.9 | 20.3 | 24.5 | D |
| 8 | NGC 659 | NGC 663 | 35.3 | 16.2 | 19.1 | 7.4 | 23.4 | 24.7 | W |
| 9 | ASCC 18 | ASCC 21 | 13.2 | 12.9 | 0.3 | 11.5 | 13.7 | 25.4 | D |
| 10 | NGC 6242 | Trumpler 24 | 40.6 | 8.3 | 32.3 | 9.8 | - | 25.5 | - |
| 11 | Biurakan 1 | NGC 6871 | 17.8 | 9.1 | 8.7 | 13.5 | 14.2 | 27.4 | W |
-
: cluster age in Myr (WEBDA, = 1, 2).
-
: age difference in Myr.
-
: cluster tidal radius in pc (Piskunov et al. 2008, = 1, 2).
-
: cluster pair spatial separation in pc.