Kinematics and Modeling of the Inner Region of M 83
Abstract
Two-dimensional kinematics of the central region of M 83 (catalog ) (NGC 5236) were obtained through three-dimensional NIR spectroscopy with Gemini South telescope. The spatial region covered by the integral field unit ( or pc), was centered approximately at the center of the bulge isophotes and oriented SE-NW. The Pa emission at half arcsecond resolution clearly reveals spider-like diagrams around three centers, indicating the presence of extended masses, which we describe in terms of Satoh distributions. One of the mass concentrations is identified as the optical nucleus (ON), another as the center of the bulge isophotes, similar to the CO kinematical center (KC), and the third as a condensation hidden at optical wavelengths (HN), coincident with the largest lobe in 10 µm emission. We run numerical simulations that take into account ON, KC and HN and four more clusters, representing the star forming arc at the SW of the optical nucleus. We show that ON, KC and HN suffer strong evaporation and merge in 10-50 Myr. The star-forming arc is scattered in less than one orbital period, also falling into the center. Simulations also show that tidal-striping boosts the external shell of the condensations to their escape velocity. This fact might lead to an overestimation of the mass of the condensations in kinematical observations with spatial resolution smaller than the condensations’ apparent sizes. Additionally the existence of two ILR resonances embracing the chain of HII regions, claimed by different authors, might not exist due to the similarity of the masses of the different components and the fast dynamical evolution of M 83 central 300 pc.
1 Introduction
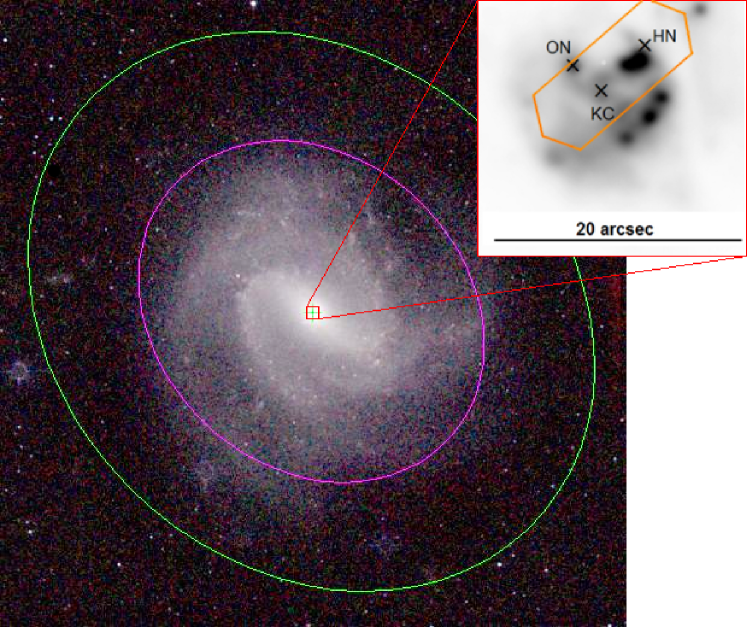
In spite of the peculiar structure of its circumnuclear region, NGC 5236 (catalog ) presents a well-defined bulge that can be fitted by de Vaucouleurs’ law in an annular region between radii ′′ and 40 ′′ (Jensen et al., 1981; Gallais et al., 1991) corresponding to pc. The dramatic inward behavior begins approximately at a radius of 180-190 pc, where the main dust lanes associated with the galaxy bar spiral into a couple of (J-K) rings that, according to Elmegreen et al. (1998), might coincide with two inner Linblad resonances. These rings embrace an arc of about twenty star-forming condensations (Gallais et al., 1991; Heap et al., 1993; Harris et al., 2001) comparable to 30 Doradus in the Large Magellanic Cloud (Heap et al., 1993), clustered in four main knots (Elmegreen et al., 1998, Figure 4). The center of this arc is approximately 6.7′′ to the SW of the condensation known as the optical or visible nucleus (ON) of NGC 5236. ON marks the center of the Elmegreen et al. (1998) inner nuclear ring, but not that of the outer nuclear ring, which is shifted 2.5′′ to the SW of the optical nucleus. K-band spectroscopy (Thatte et al., 2000) suggests a dynamical center coincident with the center of symmetry of the K-band external isophotes (KC), which is shifted 4′′ to the SW of the optical center (see Figure 3 in Mast et al., 2006, and our Figure 1). This dynamical center is also suggested, although with smaller spatial resolution, by 2-D CO spectroscopy (Sakamoto et al., 2004). The region of Thatte’s (2000) isophotal study coincides with that analyzed by Jensen et al. (1981), and is dominated by the bulge light.
The disk-like appearance of the CO kinematics interior to 300 pc (Sakamoto et al., 2004) indicates that the bar perturbed disk survives well inside the galaxy bulge. How deep it extends into the nucleus is a question discussed in this paper. The presence of the hidden condensation (HN) (Díaz et al., 2006a), which is larger and more massive than the optical nucleus, raises doubts about the true nature and the role of the optical nucleus. Furthermore, we also cast doubts on the existence of a double ILR resonance embracing the arc of HII regions.
To better understand the richness of phenomena in the central region of NGC 5236 (catalog ) we performed 3D near infrared spectroscopy at subarsecond resolution using GEMINI+CIRPASS configuration (Díaz et al., 2006a). We observed a region including the ON, KC and HN. Our study is complemented by N-body simulations to test the stability of the M 83 central region, including the star-forming arc. In Section 2 we present our observations, in Section 3 we discuss the central kinematics and the three most important condensations, which present differentiated kinematics. Numerical simulations are presented in Section 4 and in Section 5 we present our conclusions.
| RA | Dec. | Rmax | Vpeak | ||
|---|---|---|---|---|---|
| (J2000) | (J2000) | [pc] | [km s-1] | [km s-1] | |
| KC | |||||
| ON | |||||
| HN |
2 Observations
We used the Cambridge IR Panoramic Survey Spectrograph (Parry et al., 2000, 2004) installed on the GEMINI South telescope in March 2003. These observations, performed in queue mode, were taken with an integral field unit (IFU) sampling of 0.36′′ (6.4 pc) with an array with size . The array of 490 hexagonal doublet lenses attached to fibers provides an area filling factor of nearly 100%. The IFU was oriented at PA and centered slightly to the NW of the kinematical center according to Mast et al. (2002) position. In Figure 1, a sketch of the detector position is shown. It was exposed for 45 minutes and covers a spectral range between , including Pa 1.3 µm and [FeII] 1.26 µm, with a spectral resolution of approximately 3200. The seeing was about 0.5′′; therefore, the focal plane was slightly sub-sampled by the configuration constraint.
The data were reduced using IRAF (distributed by the NOAO), ADHOC (2D kinematics analysis software developed by Marseille’s Observatory) and SAO (spectra processing software developed by the Special Astrophysical Observatory, Russia). More details on the reduction are presented in Díaz et al. (2006b) and the general technique is thoroughly discussed by Díaz et al. (1999) and Mast et al. (2002).
3 2-D kinematics of M 83 central region at less than 10 pc spatial resolution
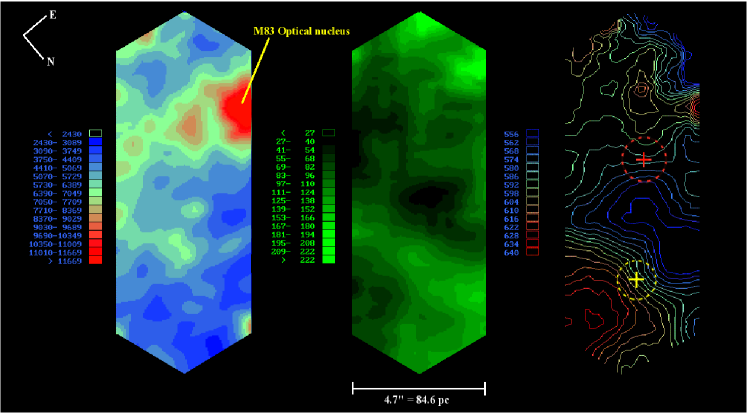
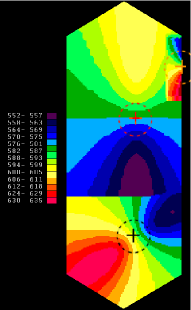
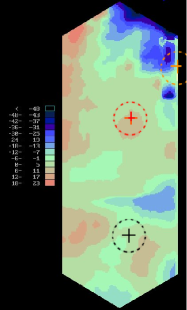
In Figure 1, we present the composed JHK 2-mass image of M 83. The inset shows a blow-up of the central 400400 pc, where we detach the positions of ON, KC and HN. The astrometric positions of the condensations are given in Table 1 (the astrometry is discussed in Díaz et al., 2006b). In Figure 2, we show the brightness distribution at the Pa continuum, the Pa radial isovelocity contours, and the Pa velocity dispersion map. The velocity dispersion is shown as the line FWHM (Table 2). In spite of the complex kinematics shown by the 2-D radial velocity map, we can distinguish ordered radial velocities in the form of spider diagrams around ON, KC and HN. As is well known, a spider diagram indicates disk-like motions. The sizes of the disks around the three condensations, their maximum radial velocities along the line of the nodes, and their velocity dispersions at their centers of symmetry are presented in Table 1.
3.1 The ionized gas kinematics around KC
KC is the most extended of the three disks. Its center coincides, up to the margin of error, with the center of symmetry of the bulge isophotes (Jensen et al., 1981; Thatte et al., 2000), which in turn coincides with that of the CO kinematical center (Sakamoto et al., 2004). We recall that the GEMINI spatial resolution is at least twenty times higher than that of Sakamoto’s CO observation.
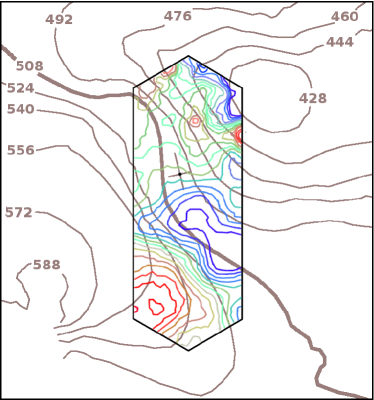
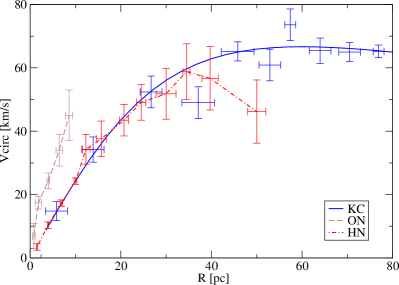
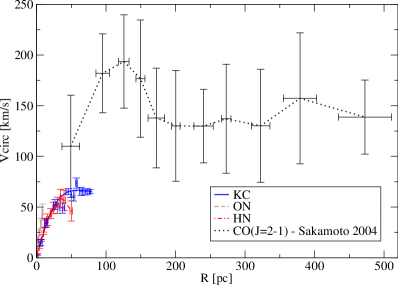
The major axis of the spider diagram is at P.A.. From the spider diagram major-to-minor axis ratio, we derive an inclination of for the gaseous disk. We have to be cautious at this point because the minor axis velocity field seems to be perturbed. The same situation was faced by Sakamoto et al. (2004), who also quote two highly discrepant possible values for the inclination of the 300 pc CO disk. These authors finally chose the inclination angle of the large scale galactic disk based on kinematical reasons. In our case, the best two-dimensional velocity model fitting to the observed velocity field is attained for an inclination angle of (see Section 3.4), which coincides, up to the margin of error, with the small inclination of the large scale M83 disk. A small angle also better fits the innermost scale rotation curves to Sakamoto’s 300 pc disk one (see Fig.3). The inflow of matter along the bar into the central region might be mimicking the disks’ high inclination. The Pa disk around the KC and Sakamoto’s CO disk present different orientations (see Figure 3), probably pointing to a phenomenon of transition between - and -like orbits, as quoted by Sakamoto et al. (2004), or to a strong perturbation of the central structure, as discussed by Díaz et al. (2006a).
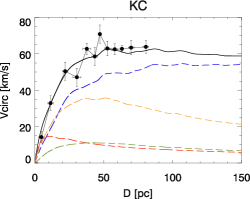
The spider diagram (see Figure 2) can be traced up to R 65 pc but it is strongly perturbed to the E at the receding extreme, and to the W at the approaching extreme. The KC rotation curve was obtained from approximately 60 radial velocity points distributed along the whole disk. From this dataset we obtained 13 mean rotation velocities between 4 pc and 65 pc. Each velocity point entering the mean was weighted by , where is the position angle of the line joining the point to the disk center with respect to the line of the nodes. The disk around KC can be described in terms of a Satoh’s-like spheroid with an effective radius of R pc and a mass inside Rmax of MM⊙ (for a disk inclination of ). We note that an inclination of for the disk around KC would give a mass of M⊙, similar to that deduced spectroscopically by Thatte et al. (2000) from the 12CO bandhead velocity broadening.
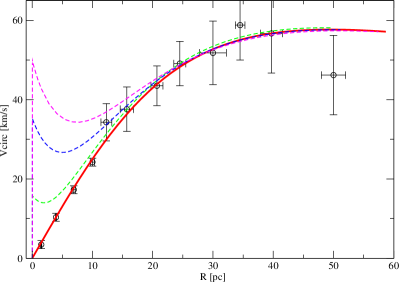
The velocity dispersion in the non-resolved central part is of the order of 80 km s-1 (see middle panel in Figure 2). Assuming that this velocity dispersion is due to a central mass concentration, namely a putative BH, we determined the BH mass upper limit, MBH, by adding Keplerian rotation curves convolved with a 9 pc Gaussian to that of the Satoh disk, and constraining the resulting Satoh+Kepler rotation curve with the central velocity dispersion and the errors of the measured velocity points. The result of this procedure is shown in Figure 5 for M and M⊙. The best fit is quoted in Table 2.
This analysis points to KC as the true nucleus of M 83.
| KC | ON | HN | |
|---|---|---|---|
| PA | 120 | 120 | 64 |
| i | |||
| Reff [pc] | |||
| [] | |||
| [] | 0.2 – 1.0 | 0.2 – 1.0 |
3.2 The ionized gas kinematics around HN
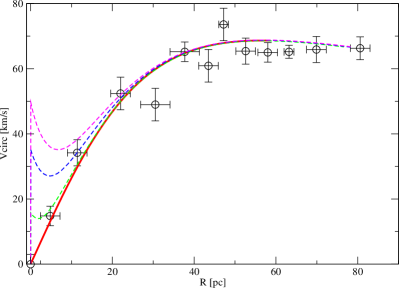
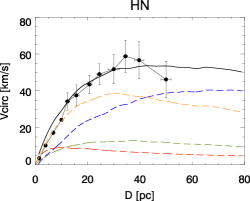
Located at R to the NW of KC (Fig. 2), the spider diagram of the ionized gas around HN presents a P.A. . The form of the spider diagram (open legs) points to a more concentrated and more homogeneous distribution than that of the KC. It is probably a cannibalized dwarf satellite of M 83, as discussed by Díaz et al. (2006b). To derive the rotation curve as for KC, we used a distribution of more than 50 points along the whole disk, which provided 13 mean rotation velocities up to R pc. In Tables 1 and 2 we present the kinematical data for HN and the derived Satoh disk parameters. The mass of HN was also derived from the rotation curve, as well as that of the putative Black Hole at its center (see Table 2), through the velocity dispersion, following the procedure previously outlined for KC.
3.3 The ionized gas kinematics around ON
ON is traditionally referred to as the off-centered optical nucleus of M83. Sakamoto et al. (2004) proposed that it could be a cannibalized satellite.
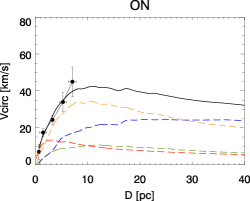
From photometric data, Elmegreen et al. (1998) derived a mass of M⊙ and Thatte et al. (2000) of M⊙. From 12CO band-head 2.293 velocity dispersion, Thatte et al. (2000) derived a kinematical mass of M⊙ within 5.4 pc, assuming that the optical nucleus is virialized. The mass of ON derived photometrically disagrees by a factor of 4 to 5 from that derived spectroscopically, probably indicating a system with a non-virialized periphery, as discussed in Section 4 in connection with the many-body interaction. The disk around ON is the smallest of the three disks discussed in this paper. The ON kinematical center is slightly shifted to the SW of the ON continuum peak at , as can be seen in Figure 2. The velocity gradient across ON is determined from data near the spatial resolution limit. We are probably dealing with problems of oversampling. The rotation curve with mean errors is shown in Figure 4. The mass of ON was also derived from the rotation curve, as well as that of the putative Black Hole at its center (see Table 2), using the velocity dispersion and the procedure previously outlined for KC. Our determination of the mass agrees very well with that obtained from photometric data.
3.4 Fitting the whole central radial velocity field of the gas
The data in Tables 1 and 2 allow us to generate a composed radial velocity map model (Figure 6a), to be compared with the observed one. The fitting of KC was the most critical due to the difficulty in the determination of its disk inclination angle (3.1). Several fits were made, keeping constant the inclination angles of the disks around ON and HN and allowing the one associated with KC to vary from to . We verified that the disk-like residual around KC decreases dramatically when approaching smaller inclinations. Finally, the smallest residuals are obtained for an inclination of . The final map is shown in Figure 6b. This inclination is in good agreement with the inclination of the large scale M83 disk and that of the inner 300 pc, derived from CO kinematics (Sakamoto et al., 2004), as can be seen in Figure 4. This again points to a continuity of the galactic disk kinematics from a kiloparsec scale to the smaller scales studied in this paper, although variations in the position angles of the lines of nodes are observed at 300 pc and at scales smaller that 100 pc as well (see Figure 3).
Figure 6b shows that around KC, ON and HN the residuals are mainly at the noise level, indicating that the interpretation of the observed velocity map as resulting from the superposition of three disks is, from a qualitative point of view, essentially correct. Nevertheless, deviations from rotation points to a more complex situation and indicates that the mass estimations based on rotation curves are barely aproximate. As an example we detect anomalous blueshifted kinematics at the East extreme (upper right) above ON, and redshifted kinematics to the West of HN. These regions coincide with the high velocity dispersion zones in Figure 2. These might indicate regions of inflow of gas along the bar falling into the central region.
The fit of the rotation curve, from the scale of tens to hundreds of parsecs (Fig.3), does not seem to confirm the existence of double ILR, as claimed by Elmegreen et al. (1998) and Sakamoto et al. (2004).
(a) (b)
4 N-body simulations
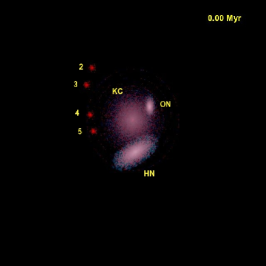
In order to understand the dynamical evolution of the M 83 central region, we performed N-body simulations of a system composed of KC, HN, ON and four condensations representing the star-forming arc. Hernquist’s models were used for KC, HN and ON (Hernquist, 1993). We included stellar and gaseous components. The models were constrained by the bodies’ rotation curves. Figure 7 shows the model rotation curves adjusted in order to fit the observational data. The model parameters are quoted in Table 3. The four condensations on the star forming arc were represented by Plummer’s models, with 1000 particles each, with positions and masses corresponding to regions 2 to 5 in Figure 8 of Elmegreen et al. (1998), where: region 2 has M M⊙; regions 3 and 4 have M M M⊙; and region 5 has M M⊙. All Plummer models have a core radius of 1.5 pc and a cutoff radius of 15 pc.
A large set of simulations was run in order to refine the models and orbital parameters used in the final simulation. The orbital parameters were chosen considering that M83 rotates clockwise. Inclinations and position angles are as in Table 2. Here we suppose that clusters 2 to 5 on the star forming arc, as well as ON are in circular clockwise (prograde) orbits in the plane of the external disk of M83. According to (Díaz et al., 2006a), HN is the remnant of a captured galaxy that triggered the star formation along the arc of HII regions. The form of the arc and its position with respect to HN lead us to adopt a circular counter-clockwise orbit for HN.
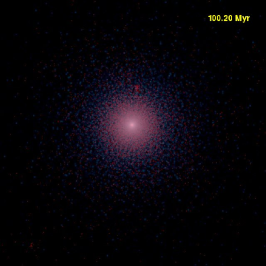
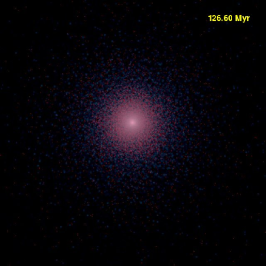
The simulations were performed with Gadget2 (Springel, 2005). A total of 91,552 particles was used, and the simulations were run for 300 Myr, starting at the present time configuration. We considered starting at a previous epoch, before the formation of the arc of HII regions, but the complexity of the environment at the M83 central region and the number of parameters required to qualitatively take into account all possible configurations in the past would be a matter for a paper especially devoted to that study.
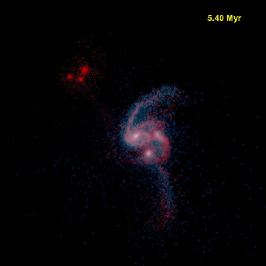
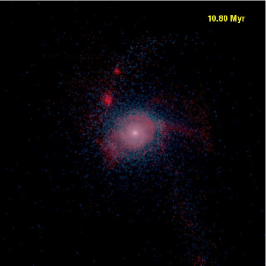
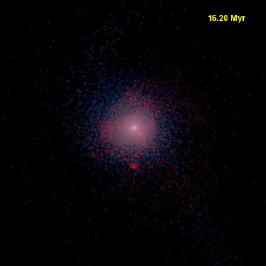
The simulation (see Figure 8) shows that the galaxy nucleus (KC), the optical nucleus (ON) and the hidden nucleus (HN) would form a single massive core in about 16 Myr. All Plummer models (clusters 2 to 5) fall into the nucleus in 130 Myr.
| KC model | HN model | ON model | |
| Number of particles in disk | 16384 | 8192 | 4096 |
| Disk mass | 15.0 | 13.0 | 3.5 |
| Disk radial scale length | 17.0 | 13.0 | 4.5 |
| Disk vertical scale thickness | 1.7 | 0.8 | 0.4 |
| Reference radius Rref | 42.5 | 30 | 8.0 |
| Toomre Q at Rref | 1.5 | 1.5 | 1.5 |
| Number of particles in gas disk | 16384 | 8192 | 4096 |
| Gas disk mass | 1.5 | 1.5 | 0.35 |
| Gas disk radial scale length | 17.0 | 13.0 | 4.5 |
| Gas disk vertical scale thickness | 1.7 | 0.8 | 0.4 |
| Toomre Q at Rref | 1.5 | 1.5 | 1.5 |
| Number of particles in bulge | 512 | 512 | 512 |
| Bulge mass | 1.3 | 0.5 | 0.3 |
| Bulge radial scale length | 3.4 | 4.0 | 1.0 |
| Number of particles in spherical component | 16384 | 8192 | 4096 |
| Halo mass | 150.0 | 40.0 | 7.0 |
| Halo cutoff radius | 200.0 | 80.0 | 45.0 |
| Halo core radius | 17.0 | 25 | 4.5 |
Note: Simulations were done in a system of units with G=1. Model units scale to physical ones such that: length unit is 1 pc, velocity unit is 65.58 km s-1, mass unit is and time unit is 14909.92 yr.
Considering the range of uncertainties in the orbit determination, we can state that this massive core would finally settle as the new nucleus of M 83 in a few tens of Myr, implying a net growth of the central galactic mass. Furthermore, the whole star formation and nuclei merging event would last about the time of a global galactic revolution (about 150 Myr at the radius of 5 kpc).
Simulations also show that tidal-striping of the condensations boosts the velocity field of the external shell to escape velocity, which, if mistaken for the dispersion velocity of systems in equilibrium, might lead to an overestimation of their masses. This seems to be the case for the disagreement between the photometric and kinematic masses derived by Thatte et al. (2000) for ON.
The circumnuclear HII regions arc is far from being a stable system. In fact, it will spread out in an orbital time and be swallowed by the new refurbished nucleus in a period slightly longer than the time of merging of ON, KC and HN. Therefore, the claimed existence of two inner Linblad resonances is difficult sustain.
5 Conclusion
We performed CIRPASS 2D spectroscopy at Pa and its continuum with the GEMINI-S telescope. Pa spectroscopy allows for penetration of the dust in the direction of KC and HN, and for determination of the ionized gas kinematics in the central embracing ON, KC and HN. The kinematics can mainly be explained in terms of three disks around each one of the condensations, KC, HN and ON. Perturbations are visible when the three-disk model is subtracted from the observations. The line of the nodes of a tens of parsecs-scale disk around KC is rotated with respect to that of the hundreds of parsecs-scale CO one, which in turn is rotated with regard to the line of the nodes of the outer galactic disk. They are most probably coplanar up to the margin of error. Nevertheless, a relative warp of the galactic disk inwards of up to can not be ruled out.
Besides the mass of the condensations KC, HN and ON, we inferred upper mass limits for the putative BH that could be associated to them.
Our simulation shows that the three nuclei, KC, HN and ON, will merge in a few tens of Myr. The disruption of the circumnuclear HII regions arc in an orbital time shows that even if ILR do exist, this is not enough to ensure the stability of the HII regions’ orbits.
We are witnessing a dramatic change in the central region of M83, the nearest galaxy with strong nuclear star formation, which may in a few Myrs change the mass at its kinematical center by a factor of 2, as well as the global aspect at a hundred parsec scale. Although HN was interpreted as a captured dwarf satellite, the metamorphosis of the M 83 central region is independent of the origin of HN.
References
- Díaz et al. (1999) R. Díaz, G. Carranza, H. Dottori, and G. Goldes. Kinematics of the Central Regions of NGC 1672. ApJ, 512:623–629, February 1999. 10.1086/306781.
- Díaz et al. (2006a) R. J. Díaz, H. Dottori, M. P. Aguero, E. Mediavilla, I. Rodrigues, and D. Mast. Hidden Trigger for the Giant Starburst Arc in M83? ApJ, 652:1122–1128, December 2006a. 10.1086/507886.
- Díaz et al. (2006b) R. J. Díaz, H. Dottori, E. Mediavilla, M. Aguero, and D. Mast. 3D NIR spectroscopy at subarcsecond resolution. New Astronomy Review, 49:547–552, January 2006b. 10.1016/j.newar.2005.10.024.
- Elmegreen et al. (1998) D. M. Elmegreen, F. R. Chromey, and A. R. Warren. Discovery of a Double Circumnuclear Ring and Minibar in the Starburst Galaxy M83. AJ, 116:2834–2840, December 1998. 10.1086/300657.
- Gallais et al. (1991) P. Gallais, D. Rouan, F. Lacombe, D. Tiphene, and I. Vauglin. The nuclear starburst activity in M83 - Imaging at near-IR wavelengths. A&A, 243:309–318, March 1991.
- Harris et al. (2001) J. Harris, D. Calzetti, J. S. Gallagher, III, C. J. Conselice, and D. A. Smith. Young Clusters in the Nuclear Starburst of M83. AJ, 122:3046–3064, December 2001. 10.1086/324230.
- Heap et al. (1993) S. R. Heap, J. Holbrook, E. Malumuth, S. Shore, and W. Waller. HST Observations of the Starburst Nucleus of M83=NGC 5236. In Bulletin of the American Astronomical Society, volume 25 of Bulletin of the American Astronomical Society, pages 840–+, May 1993.
- Hernquist (1993) L. Hernquist. N-body realizations of compound galaxies. ApJS, 86:389–400, June 1993. 10.1086/191784.
- Jensen et al. (1981) E. B. Jensen, R. J. Talbot, Jr., and R. J. Dufour. M83. III - Age and brightness of young and old stellar populations. ApJ, 243:716–735, February 1981. 10.1086/158640.
- Mast et al. (2002) D. Mast, R. J. Díaz, M. P. Agüero, W. Weidmann, G. Carranza, and G. Gimeno. Espectroscopía de campo integral de la región central de Messier 83. Boletin de la Asociacion Argentina de Astronomia La Plata Argentina, 45:74–75, Astro–ph#0505264, 2002.
- Mast et al. (2006) D. Mast, R. J. Díaz, and M. P. Agüero. Double Nucleus in M83. AJ, 131:1394–1404, March 2006. 10.1086/499941.
- Parry et al. (2004) I. Parry, A. Bunker, A. Dean, M. Doherty, A. Horton, D. King, M. Lemoine-Busserole, C. D. Mackay, R. McMahon, S. Medlen, R. G. Sharp, and J. Smith. CIRPASS: description, performance, and astronomical results. In A. F. M. Moorwood and M. Iye, editors, Ground-based Instrumentation for Astronomy. Edited by Alan F. M. Moorwood and Iye Masanori. Proceedings of the SPIE, Volume 5492, pp. 1135-1144 (2004)., volume 5492 of Presented at the Society of Photo-Optical Instrumentation Engineers (SPIE) Conference, pages 1135–1144, September 2004. 10.1117/12.552012.
- Parry et al. (2000) I. R. Parry, C. D. Mackay, R. A. Johnson, R. G. McMahon, A. Dean, A. N. Ramaprakash, D. L. King, J. M. Pritchard, S. R. Medlen, C. S. Sabbey, R. S. Ellis, and A. Aragon-Salamanca. CIRPASS: a NIR integral field and multi-object spectrograph. In M. Iye and A. F. Moorwood, editors, Proc. SPIE Vol. 4008, p. 1193-1202, Optical and IR Telescope Instrumentation and Detectors, Masanori Iye; Alan F. Moorwood; Eds., volume 4008 of Presented at the Society of Photo-Optical Instrumentation Engineers (SPIE) Conference, pages 1193–1202, August 2000.
- Sakamoto et al. (2004) K. Sakamoto, S. Matsushita, A. B. Peck, M. C. Wiedner, and D. Iono. Molecular Gas around the Double Nucleus in M83. ApJ, 616:L59–L62, November 2004. 10.1086/420845.
- Springel (2005) V. Springel. The cosmological simulation code GADGET-2. MNRAS, 364:1105–1134, December 2005. 10.1111/j.1365-2966.2005.09655.x.
- Thatte et al. (2000) N. Thatte, M. Tecza, and R. Genzel. Stellar dynamics observations of a double nucleus in M 83. A&A, 364:L47–L53, December 2000.