11email: kenta@cosmos.phys.sci.ehime-u.ac.jp, tohru@cosmos.ehime-u.ac.jp 22institutetext: Research Center for Space and Cosmic Evolution, Ehime University, 2-5 Bunkyo-cho, Matsuyama 790-8577, Japan
22email: tani@cosmos.ehime-u.ac.jp 33institutetext: INAF – Osservatorio Astrofisico di Roma, Via di Frascati 33, 00040 Monte Porzio Catone, Italy
33email: maiolino@oa-roma.inaf.it 44institutetext: Dipartimento di Astronomia e Scienza dello Spazio, Universita degli Studi di Firenze, Largo E. Fermi 2, 50125 Firenze, Italy
44email: marconi@arcetri.astro.it
Chemical Evolution of High-Redshift Radio Galaxies ††thanks: Based on data obtained at the VLT through the ESO programs 076.A-0664 and 077.B-0051
We present new deep optical spectra of 9 high- radio galaxies (HzRGs) at obtained with FORS2 on VLT. These rest-frame ultraviolet spectra are used to infer the metallicity of the narrow-line regions (NLRs) in order to investigate the chemical evolution of galaxies in high- universe. We focus mainly on the C iv/He ii and C iii]/C iv flux ratios that are sensitive to gas metallicity and ionization parameter. Although the N v emission has been widely used to infer the gas metallicity, it is often too weak to be measured accurately for NLRs. By combining our new spectra with data from the literature, we examine the possible redshift evolution of the NLR metallicity for 57 HzRGs at . Based on the comparison between the observed emission-line flux ratios and the results of our photoionization model calculations, we find no significant metallicity evolution in NLRs of HzRGs, up to . Our results imply that massive galaxies had almost completed their chemical evolution at much higher redshift (). Finally, although we detect strong N v emission lines in 5 HzRGs at , we point out that high N v/He ii ratios are not indicative of high metallicities but correspond to high ionization parameters of gas clouds in NLRs.
Key Words.:
galaxies: active – galaxies: evolution – galaxies: nuclei – quasars: emission lines – quasars: general1 Introduction
Chemical evolution of galaxies is one of the most important aspects to understand the formation and evolution of galaxies, since it is closely related with the past star formation history of galaxies. The most straightforward way to investigate the chemical evolution of galaxies is measuring the metallicity of galaxies at various redshifts and exploring the systematic trends of the metallicity as a function of redshift (see Maiolino et al. 2008 and references therein). The gas-phase metallicity of star-forming galaxies in the local universe can be measured rather easily by analyzing optical emission line spectra (e.g., [O ii]3727, H, [O iii]5007, H, [N ii]6584; see Nagao et al. 2006b and references therein). However, this is difficult at , since these emission lines are generally very faint and shifted into near-infrared wavelengths where sensitive spectroscopic observations are more difficult than in the optical.
An alternative approach is to focus on active galactic nuclei (AGNs) instead of star-forming galaxies. AGNs generally show various emission lines in rest-frame ultraviolet to infrared wavelengths, that arise in gas clouds photoionized by the radiation from their central engines. Here we focus on the rest-frame ultraviolet lines (e.g., N v1240, C iv 1549, He ii1640, C iii]1909), since we can easily measure the emission-line fluxes of high- AGNs by means of optical spectroscopic observations. These UV emission lines in AGN spectra are generally brighter than optical emission lines in star-forming galaxies at similar redshifts.
| Source | Date | |||
|---|---|---|---|---|
| TN J01211320 | 3.516 | 0.039 | 23400 | 2005 Oct 28, Nov 20, |
| 2006 Sep 17, 20 | ||||
| TN J02052242 | 3.506 | 0.100 | 5400 | 2005 Oct 1 |
| MRC 0316257 | 3.130 | 0.014 | 10800 | 2006 Jul 27, Aug 25, Oct 2 |
| USS 0417181 | 2.773 | 0.048 | 2700 | 2006 Oct 2 |
| TN J09200712 | 2.760 | 0.041 | 10800 | 2006 Apr 3, 4 |
| WN J11233141 | 3.217 | 0.018 | 14400 | 2005 Dec 28, |
| 2006 Apr 5, May 27, Jun 20 | ||||
| 4C 24.28 | 2.879 | 0.018 | 10800 | 2006 Apr 23 |
| USS 1545234 | 2.755 | 0.257 | 14400 | 2006 Apr 5, 23, 24 |
| USS 2202128 | 2.706 | 0.067 | 10800 | 2006 Jul 2, Aug 16 |
-
a
The redshift based on NED (NASA/IPAC Extragalactic Database).
-
b
Galactic extinction [mag] given by Schlegel et al. (1998).
-
c
Total exposure time [sec].
The metallicity of AGNs has been studied extensively, especially by focusing on the broad-line regions (BLRs). It has been reported that the BLR metallicity () is typically higher than the solar value (e.g., Hamann & Ferland 1992; Dietrich et al. 2003; Nagao et al. 2006c), reaching as much as in extreme cases (Baldwin et al. 2003b; Bentz et al. 2004). However it is not clear how the gas metallicity inferred from the broad lines is related to the chemical properties of the host galaxies, since broad lines of AGNs sample only very small regions in galactic nuclei (; e.g., Suganuma et al. 2006), which may have evolved more quickly than their host galaxies. For this reason, here we focus on narrow-line regions (NLRs), instead of BLRs.
Contrary to BLRs, the size of NLRs is roughly comparable to the size of their host galaxies (; e.g., Bennert et al. 2006). The mass of the NLR is about which is much larger than that of the BLR ( ; see, e.g., Baldwin et al. 2003a) and the velocity dispersion of the NLR emission lines well traces the kinematics of their host galaxies (e.g., Greene & Ho 2005; Bennert et al. 2006). The NLR is therefore a good tracer of chemical properties on the galactic scales.
In order to study NLR metallicities it is necessary to focus on type-2 AGNs, where BLR and strong continuum emission are obscured and do not affect the accuracy of narrow line emission measurements. However only very few optically-selected high- type-2 QSOs have been discovered so far. We then focus on NLRs of high- radio galaxies (HzRGs) since several of them have been identified even at high-.
Some studies on the metallicity of the NLR in HzRGs have already been carried out in the past. By studying the emission-line flux ratios of N v1240/C iv1549 and N v1240/He ii1640, generally used to measure the metallicity of BLRs in AGNs, De Breuck et al. (2000) found that the typical metallicity of HzRGs is roughly . They also reported a possible metallicity evolution in their sample: radio galaxies at have lower metallicity than those at . However, the emission-line flux of N v in narrow-line radio galaxies is generally too faint, especially for metal-poor gas. Therefore, only upper-limits on N v are available for the majority of the radio galaxies investigated by De Breuck et al. (2000). Iwamuro et al. (2003) found lower metallicities in the NLRs in HzRGs at than De Breuck et al. (2000), based on their analysis of rest-frame optical emission lines from their sensitive near-infrared observations. In contrast, Humphrey et al. (2008) recently reported that there is no significant difference in NLR metallicities between their sample of HzRGs at and the lower- radio galaxies investigated by Robinson et al. (1987). To solve these apparent contradictions, it is mandatory to carry out further spectroscopic observations of HzRGs.
Nagao et al. (2006a) proposed a new metallicity diagnostic diagram that consists of the C iv1549, He ii1640 and C iii]1909 emission lines, all of which are moderately strong in rest-frame ultraviolet spectra of HzRGs, even at low metallicities. They studied the metallicity of NLRs of HzRGs and reported that the observational data do not show any evidence for a significant evolution of the gas metallicity in NLRs within the redshift range , and instead they found a clear trend for more luminous AGNs to have more metal-rich gas clouds. It should be noted, however, that their sample includes only 5 objects at (or only 2 objects at ). Thus, observing more HzRGs is crucial to assess the possible metallicity evolution.
In this paper we report new spectroscopic observations of 9 HzRGs at . By combining the new data with the Nagao et al. (2006a) database, we discuss the chemical evolution and the metallicity-luminosity relation of HzRGs in the redshift range. We adopt a concordance cosmology with and .
2 Observations
We observed 9 HzRGs at with FORS2 (FOcal Reducer and low dispersion Spectrograph 2) at the VLT (Very Large Telescope). These targets were selected from the catalog of De Breuck et al. (2000), excluding HzRGs whose C iv, He ii and C iii] have been already measured. All the observations were executed in the service mode. The list of the target objects with the observation log is given in Table 1.
Observations were performed with the 300V dispersion element and the G435 order-sorting filter to cover the range, which, at the redshift of our targets, corresponds to the rest-frame ultraviolet and thus includes the UV emission lines needed for abundance determination. We adopted an on-chip binning mode of with a spectral dispersion of 3.2 Å and a spatial scale along the slit of 025 . The slit width was 10, narrower than the typical seeing (FWHM 14). Individual exposure time was 900 s, and the total integration time for each target is given in Table 1.
Standard data reduction procedures were performed used available IRAF tasks. Bias was subtracted by using an averaged bias image and flat-fielding was performed using dome-flat images. Cosmic-ray events were then removed. The wavelength calibration was done by using sky lines. After sky subtraction, we extracted spectra using apertures of 225 along the slit. The spectra were then flux-calibrated by using the following spectrophotometric standard stars. Note that the weather condition was good during most of our observations. Examination of the ESO sky monitor database indicates that most () of our exposures were taken under photometric conditions. Small variations in the absolute calibration due to varying seeing and transparency are unimportant given that we bin our data into three broad luminosity bins.
 |
 |
 |
 |
 |
 |
 |
 |
 |
 |
| Source | Line | ||||
|---|---|---|---|---|---|
| (Å) | () | (Å) | |||
| TN J01211320 | 3.517 | N v1240 | – | – | |
| C iv1549 | 6996.9 | 34.4 | |||
| He ii1640 | 7414.3 | 20.1 | |||
| C iii]1909 | 8622.2 | 32.6 | |||
| TN J02052242 | 3.507 | N v1240 | – | – | |
| C iv1549 | 6981.8 | 33.0 | |||
| He ii1640 | 7387.5 | 47.3 | |||
| C iii]1909 | 8586.0 | 33.4 | |||
| MRC 0316257 | 3.130 | N v1240 | – | – | |
| C iv1549 | 6396.8 | 52.4 | |||
| He ii1640 | 6771.5 | 27.9 | |||
| C iii]1909 | 7874.1 | 41.1 | |||
| USS 0417181 | 2.773 | N v1240 | – | – | |
| C iv1549 | 5845.1 | 37.5 | |||
| He ii1640 | 6188.5 | 28.9 | |||
| C iii]1909 | 7192.8 | 30.7 | |||
| TN J09200712 | 2.758 | N v1240 | 4663.9 | 31.6 | |
| C iv1549 | 5821.4 | 26.6 | |||
| He ii1640 | 6161.5 | 21.4 | |||
| C iii]1909 | 7163.2 | 28.3 | |||
| WN J11233141 | 3.221 | N v1240 | 5238.7 | 31.7 | |
| C iv1549 | 6538.8 | 24.8 | |||
| He ii1640 | 6916.9 | 19.9 | |||
| C iii]1909 | 8046.6 | 20.3 | |||
| 4C 24.28 | 2.913 | N v1240 | 4853.2 | 46.4 | |
| C iv1549 | 6061.6 | 50.7 | |||
| He ii1640 | 6416.3 | 29.5 | |||
| C iii]1909 | 7463.8 | 41.9 | |||
| USS 1545234 | 2.751 | N v1240 | 4642.9 | 50.1 | |
| C iv1549 | 5810.3 | 24.7 | |||
| He ii1640 | 6150.7 | 16.9 | |||
| C iii]1909 | 7150.9 | 26.9 | |||
| USS 2202128 | 2.705 | N v1240 | 4595.0 | 30.4 | |
| C iv1549 | 5739.2 | 22.9 | |||
| He ii1640 | 6074.3 | 20.3 | |||
| C iii]1909 | 7065.5 | 25.6 |
-
a
Redshift of the target calculated from the observed C iv wavelength.
-
b
Line fluxes corrected for the Galactic reddening.
-
c
Observed FWHM (includes instrumental broadening.
-
d
3 upper-limit flux.
3 Observational results
The final reduced spectra of the observed HzRGs are shown in Figure 1. In all spectra continuum emission is very faint; typically S/N and ranging at Å. However the equivalent widths of emission lines are very high and their S/N is accordingly very large. The composite spectrum of HzRGs, which is shown in the lower right panel of Figure 1, was obtained by stacking the 9 spectra of HzRGs after converting to rest frame, normalizing to the He ii flux, and performing a 3 sigma-clipping rejection.
Fluxes of observed emission lines are given in Table 2, where the measurements were performed by fitting a Gaussian profile with the IRAF task splot. The flux error was estimated based on the RMS of the pixels around each emission line. The detected emission lines are well spectrally resolved and instrumental broadening is negligible in most cases. Observed emission-line widths without correction for instrumental broadening are also presented in Table 2. We also provide for each HzRG the redshift calculated from the C iv line. For the composite spectrum the flux ratios of C iv/He ii, C iii]/C iv, and N v/C iv are 1.618, 0.628, and 0.584, respectively.
All the emission lines of C iv, He ii and C iii] (required for the metallicity diagnostic method proposed by Nagao et al. 2006a) are detected in the spectra of all 9 HzRGs observed. In addition, a significant N v emission is also detected in 5 out of 9 objects. We provide a 3 upper limit on the N v emission for objects without a significant detection, by assuming an emission-line width of in rest frame. As shown in Figure 1, various fainter emission lines are also detected including Si ii1265, O i+Si ii1305, C ii1335, O iv]1402, O iii]1663, Si ii1808, [Ne iv]. We will discuss the properties of these faint emission lines in a forthcoming paper (Matsuoka et al. in prep.).
4 Photoionization model
To infer the metallicity from the observed emission-line spectra, we carried out model calculations by using the photoionization code Cloudy version 07.02 111 We proved for some models that the results of the calculations do not change significantly with the use of Cloudy version 08.00 instead of version 07.02; the difference is % at most. (Ferland et al. 1998). Here we assume that the clouds in the NLR of HzRGs are mainly photoionized and not significantly affected by shocks. Although Nagao et al. (2006a) demonstrated that this assumption is appropriate when focusing on C iv, He ii and C iii], we will examine how this assumption is valid in section 5.1. The parameters for the calculations are (1) the spectral energy distribution (SED) of the photoionizing continuum radiation; (2) the hydrogen density of a cloud (); (3) the ionization parameter (), i.e., the ratio of the ionizing photon density to the hydrogen density at the irradiated surface of a cloud; (4) the column density of a cloud (); and (5) the elemental composition of the gas.
For the SED of the ionizing photons, we used the ”table AGN” command, that roughly reproduces the typical SED of ionizing photons in AGNs (Mathews & Ferland 1987). We do not examine the dependences of the calculations on the SED but adopt only this SED, because Nagao et al. (2006a) already investigated the dependences in HzRGs and concluded that the SED effects do not affect the discussion of the NLR metallicity evolution in HzRGs. We adopted gas clouds with the hydrogen density and and the ionization parameters . Here we assumed dust-free gas clouds, since dusty models are inconsistent with observations when high-ionization emission lines of HzRGs are concerned (Nagao et al. 2006a). Note that this is suggested also by rest-frame optical or near-infrared emission lines (e.g., Marconi et al. 1994; Ferguson et al. 1997b; Nagao et al. 2003). For the chemical composition of gas, we assumed that the all metals scale by keeping solar ratios except for He and N. For helium, we assumed a primary nucleosynthesis component in addition to the primordial value. Nitrogen scales as the square power of other metal abundances because it is a secondary element. We adopted the analytical expressions for the helium and nitrogen relative abundances as functions of the metallicity given in Dopita et al. (2000). Another free parameter in our calculation is the cloud column density. Since we are now focusing on relatively high-ionization emission lines (N v, C iv, He ii, and C iii]), we stop our calculations when the hydrogen ionization fraction drops below 15%. This requirements ensures that the line fluxes of interest will not depend on the choice of a particular column density.
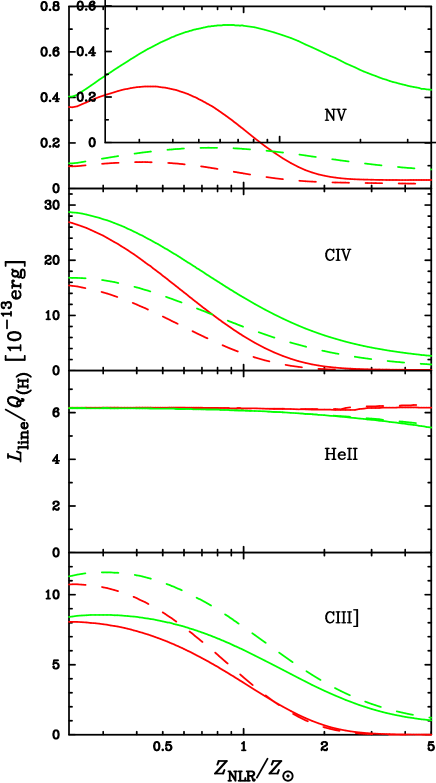
In Figure 2 we show the dependence of the emission-line luminosity on the NLR metallicity, for models with and , and and . The line luminosity is normalized by the number of H-ionizing photons in the input continuum emission. The model behavior is completely different between He ii and the other emission lines: the He ii is a recombination line and its luminosity is proportional to the rate of -ionizing photons, while the other emission lines are collisionally excited and their emissivity strongly depends on the gas temperature. The equilibrium temperature of ionized gas clouds is sensitive to metallicity because of the radiative cooling by metal emission lines. Therefore the luminosity of collisionally excited emission lines decreases at high metallicity. Note that the N v luminosity decreases at much higher metallicity than the C iv and C iii] luminosity. This is because the nitrogen abundance increases at high metallicity, i.e., N/H . All of the above results are insensitive to the adopted gas density and ionization parameter.
Figure 2 suggests that the C iv/He ii flux ratio is possibly good metallicity diagnostic. However, this flux ratio also depends on other parameters such as the ionization parameter. This degeneracy can be solved by combining it with the C iii]/C iv ratio which is primarily sensitive to the ionization parameter. Therefore a diagram involving both the C iv/He ii and C iii]/C iv ratios is expected to be a powerful metallicity diagnostic, as originally proposed by Nagao et al. (2006a). In Figure 3, the results of our photoionization model calculations are plotted on this diagnostic diagram. The model grids indicate that this diagram is quite useful to investigate the NLR metallicity. Note that, as shown in Figure 3, the C iv/He ii flux ratio depends also on the gas density and thus the gas metallicity is not uniquely determined through this diagram. However, it can be useful to investigate relative differences in metallicity and to assess the possible redshift evolution of the NLR metallicity. In the rest of the paper we only consider models with (a typical NLR density; see, e.g., Nagao et al. 2001a, 2002a).
 |
 |
5 Discussion
5.1 The metallicity-redshift and metallicity-luminosity relations in HzRGs
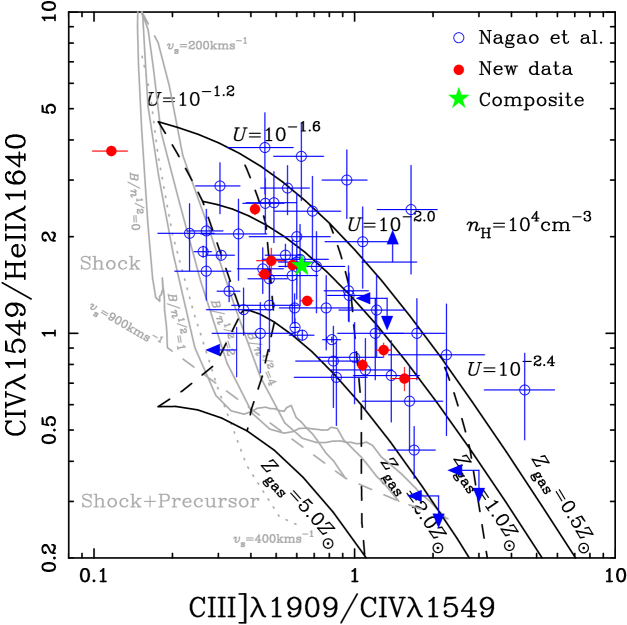
By comparing the observed flux ratios of HzRGs with the prediction of the photoionization models, we investigate the gas metallicity. In Figure 4, we plot the flux ratios of HzRGs on the diagnostic diagram with the calculated model grids. We also plot the flux ratios of the composite spectrum of HzRGs on this diagram. Though new 9 data are at higher redshift than the data in Nagao et al. (2006a) on average, there is no systematic difference in the data distribution between our new observations and the data of Nagao et al. (2006a). This result naively suggests that there is no significant chemical evolution in NLRs of HzRGs, even up to .
We now investigate whether shock models can explain the observed flux ratios of HzRGs. In Figure 4 we overplot the shock models and shock plus precursor models presented by Allen et al. (2008). Specifically, we plot shock models with shock velocities of 200 km km , magnetic parameters of , 1, 2, and 4 G , and solar abundance, and shock plus precursor models with shock velocities of 200 km km , a magnetic parameter of G , solar abundance. As shown in Figure 4, both pure shock models and shock plus precursor models can not explain the observed distribution of line ratios, at variance with pure photoionization models. We therefore conclude that the dominant ionization mechanism of gas clouds emitting C iv, He ii, and C iii] is photoionization.
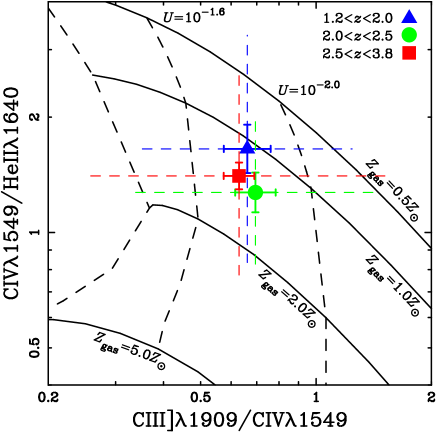
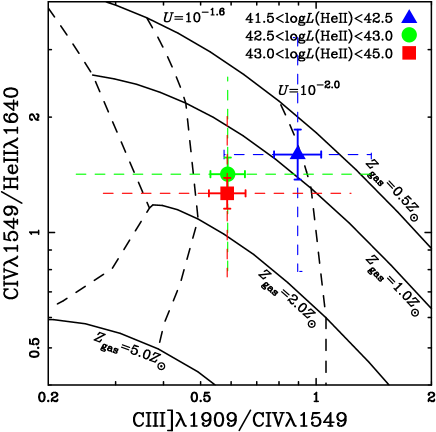
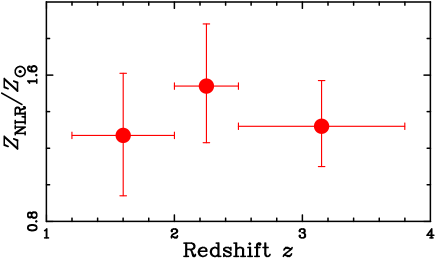
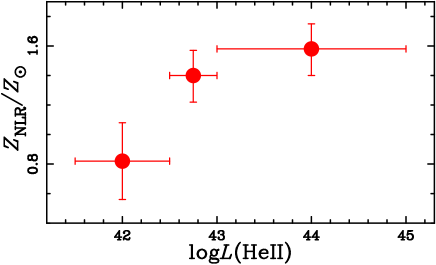
To investigate the relationship between metallicity and redshift or luminosity, we divided our sample into the following three redshift bins: , , and . As for the luminosity, since the non-thermal AGN continuum is obscured in HzRGs, we used the He ii line luminosity as a proxy for the AGN’s bolometric luminosity. This directly traces the rate of -ionizing photons which is proportional to the bolometric luminosity. Luminosity bins are as follows: (He ii) , (He ii) and, (He ii) (see, Table 3). In Figures 5 and 6, we investigate the averaged flux ratios of C iv/He ii and C iii]/C iv for each luminosity and redshift bin to examine the possible metallicity dependence on luminosity and redshift. There is no clear dependence between the flux ratios and redshift as shown in Figure 5, suggesting that the NLRs metallicity of HzRGs does not show significant redshift evolution in the range of . On the other hand, in Figure 6 we find that the flux ratios are correlated with the luminosity, suggesting that more luminous HzRGs have more metal-rich gas clouds. Figure 7 shows the redshift evolution of average metallicity as derived from our sample. Here we use only the HzRG samples with (He ii) to minimize possible Malmquist bias. Note that the metallicity shown here are derived by assuming (see Table 3). Figure 7 clearly shows that there is no significant decline in the NLR metallicity at high redshift. In the same way, Figure 8 shows the luminosity dependence of the averaged NLR metallicity in our sample. Figure 8 clearly shows the correlation between the AGN luminosity and the NLR metallicity. These results are completely consistent with the results of Nagao et al. (2006a) but more reliable since our new sample includes a larger number of HzRGs at high redshift (). Note that the positive correlation between the AGN luminosity and the gas metallicity of ionized clouds is indicated also for the BLR, that does not show any redshift evolution (e.g., Hamann & Ferland 1993; Nagao et al. 2006c; see also Jiang et al. 2007; Juarez et al. 2009).
| Sample | Number | He ii | C iv/He ii | C iii]/C iv | |||
|---|---|---|---|---|---|---|---|
| He ii | 8 | 1.70 | 41.96 | ||||
| He ii | 7 | 1.66 | 42.70 | ||||
| He ii | 2 | 1.81 | 43.32 | ||||
| He ii | 4 | 2.28 | 42.25 | ||||
| He ii | 10 | 2.28 | 42.78 | ||||
| He ii | 6 | 2.24 | 43.22 | ||||
| He ii | 4 | 2.78 | 42.39 | ||||
| He ii | 9 | 3.06 | 42.73 | ||||
| He ii | 7 | 2.67 | 43.40 |
-
a
Assuming the hydrogen density of .
-
b
Line luminosity of He ii1640 in units of ergs .
5.2 Interpretation
In section 5.1, we reported a significant positive correlation between the NLR metallicity and the AGN luminosity. In this section we discuss two possible origins for this correlation:
-
•
the galaxy mass-metallicity relation (assuming )
-
•
a dependence of NLR metallicity on the Eddington ratio
We discuss each of these scenarios below.
One possible scenario for the positive correlation between NLR metallicity and AGN luminosity is that it reflects the relation between galaxy mass and metallicity (e.g., Lequeux et al. 1979; Tremonti et al. 2004; Lee et al. 2006). Since the metal content of NLRs is the result of the past star-formation history in the host galaxies, the metallicity of galaxies and that of NLRs should be closely related. Galaxies are characterized by a well defined mass-metallicity relation even at high redshift (Maiolino et al. 2008). On the other hand, AGN luminosities and host galaxy masses should also be closely related, if the Eddington ratio is roughly the same within this class of objects and the correlation between the mass of supermassive black holes (SMBHs) and that of galaxy spheroidal components holds also at high redshift. Therefore, by assuming a narrow range of the Eddington ratios and the -galaxy mass relation, the positive correlation between NLR metallicity and AGN luminosity is naturally expected. Indeed, some observational studies report that the Eddington ratio of high-z quasars is limited in a narrow range (e.g., Kollmeier et al. 2006; Trump et al. 2009).
However, this scenario has a serious problem. We found that the NLR metallicity shows no significant redshift evolution, up to . On the contrary, the mass-metallicity relation in galaxies shows a significant redshift evolution, at least in the range (e.g., Savaglio et al. 2005; Erb et al. 2006; Liu et al. 2008; Maiolino et al. 2008). If the relation between NLR metallicity and AGN luminosity is simply caused by the galaxy mass-metallicity relation, the NLR metallicity is also expected to show a significant redshift evolution, in contrast with our observational results. Below we discuss possible reasons for this apparent contradiction and the implications of the relation between NLR metallicity and AGN luminosity.
A possibility to reconcile this problem is that the apparent lack of evolution is the extreme consequence of galaxy downsizing on metal enrichment. We know that low mass galaxies evolve slowly, even from the chemical point of view, on a prolonged time scale extending to the current epoch. In contrast, massive galaxies reach their chemical maturity on short time scales and at high redshift (Maiolino et al. 2008 and references therein). Since the host galaxies of HzRGs are very massive (e.g. De Breuck et al. 2002), their chemical evolution may be completed at much earlier epochs than observed in the current sample, i.e. at . This scenario predicts that the NLR metallicities in lower-luminosity HzRGs (hence probably hosted in less massive hosts) may show evolution even at . This prediction can be tested with sensitive spectroscopic observations of faint HzRGs.
Alternatively, the relation between NLR metallicity and AGN luminosity may be independent of the mass-metallicity relation of galaxies, since the Eddington ratio is likely not universal. Recently it was reported that the BLR metallicity in quasars is correlated with the Eddington ratio (e.g., Shemmer et al. 2004; see also Nagao et al. 2002b; Shemmer & Netzer 2002). This suggests that the NLR metallicity may be also correlated with the Eddington ratio, although the physical origin is not clear. In this case, the correlation between the AGN luminosity and the NLR metallicity is independent of the galaxy mass-metallcity relation.
Whatever the scenario, our study strongly suggests that HzRGs completed their major chemical evolution in the very high-z universe, i.e., . If the minimum time-scale for a significant enrichment of carbon ( Gyr; e.g., Matteucci 2008) is taken into account, the major epoch of the star formation in HzRGs may have occurred at .
Note that our conclusions are in contrast with some of the earlier studies mentioned in section 1. The most significant difference between previous works and our own is the adopted diagnostics, i.e., we do not use N v emission to investigate the NLR metallicity. While the N v emission is too weak in most HzRGs to be measured accurately, all of the lines used by us (C iv, He ii, and C iii]) are so strong that we can measure their fluxes rather easily. Therefore we can investigate the chemical evolution of HzRGs without relying on upper-limit data. Another serious problem in using the N v emission in metallicity studies is that the flux ratios including N v are sensitive not only to the NLR metallicity but also to the ionization parameter as discussed in the following section.
 |
 |
5.3 The N v emission in HzRGs
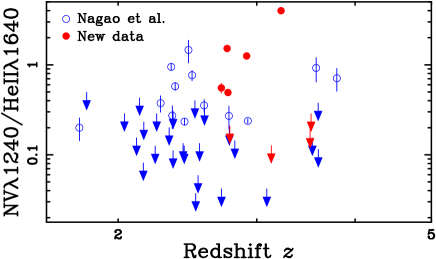
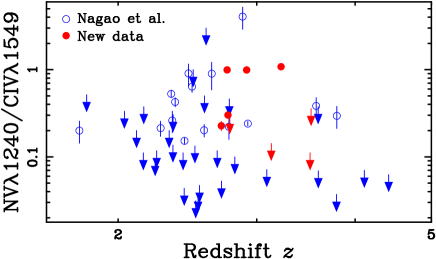
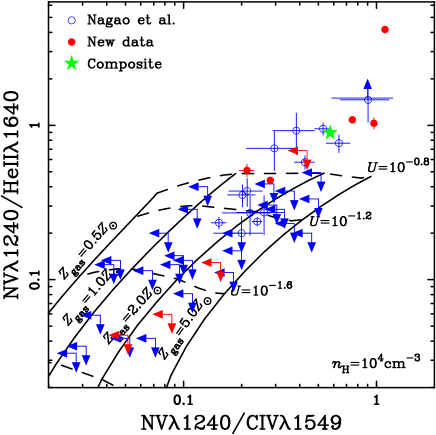
Given the high S/N of our spectra, the N v emission line is securely detected in 5 out of 9 objects. Nitrogen is a secondary element and thus its abundance is expected to be proportional to the square of the metallicity [i.e., N/O O/H, or equivalently, N/H ]. Therefore, the N v line is widely regarded as a good metallicity indicator, at least for BLRs (e.g., Hamann & Ferland 1992, 1993; Hamann et al. 2002; Dietrich et al. 2002, 2003; Nagao et al. 2006c). Accordingly the N v line is sometimes regarded as a metallicity indicator also for NLRs (e.g., van Ojik et al. 1994; De Breuck et al. 2000; Vernet et al. 2001; Overzier et al. 2001; Humphrey et al. 2008). We thus examine the N v/C iv and N v/He ii flux ratios as a function of redshift, to infer possible redshift evolution of the NLR metallicity independently of the diagnostic diagram of C iv/He ii versus C iii]/C iv. These two flux ratios are plotted as a function of redshift in Figure 9. Our new data at clearly show the existence of HzRGs with high N v/C iv and N v/He ii flux ratios even at , which seems consistent to the idea that there is no significant evolution in the NLR metallicity of HzRGs as suggested by the C iv/He ii and C iii]/C iv flux ratios.
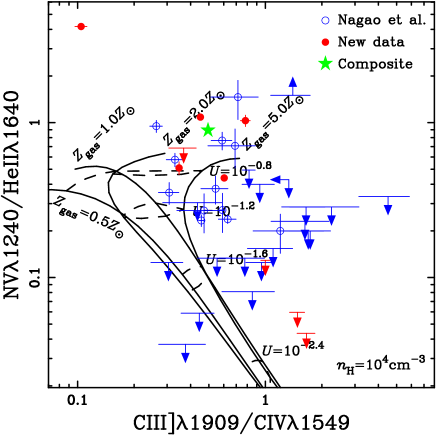
Figure 9 shows, however, the presence of a large number of HzRGs with a very weak N v emission. In particular, some HzRGs show N v/He ii and N v/C iv while others show N v/He ii and N v/C iv . With the models presented by Vernet et al. (2001), these flux ratios would correspond to for N v-weak HzRGs and for N v-strong HzRGs. This would suggest that the NLR metallicity of HzRGs varies from object to object in a very wide range ( dex). This seems inconsistent with the results obtained through the analysis of the C iv/He ii and C iii]/C iv emission-line ratios (Figure 3). To investigate the origin of this apparent contradiction, in Figure 10 we plot the observational data on the N v/He ii versus N v/C iv diagram and compare them with our model calculations. The distribution of the observational data on this diagram seems consistent with the area spanned by model grids. The near horizontal lines of constant- in Figure 10 suggest that the N v/He ii flux ratio is sensitive to the ionization parameter but insensitive to the NLR metallicity. The N v/C iv ratio appears to depend on both and . In other words, the increase of the ionization parameter for a given metallicity results in high N v/He ii and N v/C iv flux ratios, while the increase of the metallicity for a given ionization parameter results in high N v/C iv but nearly constant N v/He ii flux ratios. This suggests that the N v/He ii flux ratio is sensitive to the ionization parameter rather than to the NLR metallicity. This is demonstrated more clearly in Figure 11, where we show the N v/He ii versus C iii]/C iv diagram. The narrow coverage of the model grids in this diagram suggests that both N v/He ii and C iii]/C iv flux ratios depends mainly on the ionization parameter but are nearly independent of the NLR metallicity. Note that the observational data appears to be distributed in a wider range with respect to the one predicted by the models. Indeed, only the models with are plotted in the diagram and most of the observational data are upper limits.
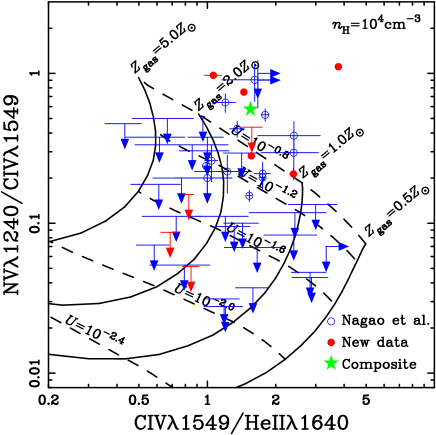
The physical reason why the N v/He ii flux ratio is less sensitive than the N v/C iv flux ratio is shown in Figure 2 and described in section 4. Both N v and C iv are collisionally excited emission lines and thus become weak at high metallicity where the equilibrium temperature is low. However, N v emission decreases much more slowly with metallicity than C iv, because nitrogen is a secondary element. This is the main reason of the metallicity dependence of the N v/C iv flux ratio. However, especially at , the metallicity dependence of the N v emission is small (see the top panel of Figure 2). As already mentioned in section 4, the He ii emission is also insensitive to the metallicity because it is a recombination line. This is demonstrated in Figure 12, where we plot the N v/C iv versus C iv/He ii diagram. Here -sequences are mostly perpendicular to -sequences, and -sequences go towards the upper-left direction with increasing NLR metallicity. However this diagram is less useful than the C iv/He ii versus C iii]/C iv diagram to infer the NLR metallicity, because N v/C iv flux ratios of HzRGs are difficult to be measured accurately; indeed most of the observational data in Figure 12 are upper-limit values.
In Figure 9 – 12, the inferred ionization parameter for the N v-detected HzRGs is much higher than that suggested by the diagram in Figure 4. This is due to the higher ionization potential of the ion (77.4 eV) compared to the (47.9 eV) and (54.4 eV) ions; i.e., the N v emission tends to arise from regions characterized by higher ionization parameters with respect to C iv and He ii. Although multi-zone photoionization models for NLRs (e.g., Ferguson et al. 1997a; Nagao et al. 2001b) solve this discrepancy in ionization parameter, it is beyond the scope of this paper and thus they are not discussed further.
6 Conclusion
To investigate the metallicity evolution of galaxies in the high- universe, we have performed new spectroscopic observations of 9 HzRGs at , which complement data available at lower redshifts. By comparing the total set of data of 57 HzRGs at with photoionization models, we found the following results.
-
1.
Our analysis of the emission-line flux ratios of C iv, He ii and C iii] suggests that there is no significant chemical evolution in the redshift range of .
-
2.
We found a positive correlation between the NLR metallicity and the AGN luminosity. There are two possible origins for this correlation: the galaxy mass-metallicity relation and a dependence of the NLR metallicity on the Eddington ratio.
-
3.
The non-evolution of the gas metallicity of the NLRs implies that the major epoch of star formation in the host galaxies is at .
-
4.
We detected the N v emission in the spectra of 5 HzRGs at , and found that there are some HzRGs with high N v/C iv and N v/He ii flux ratios even at such high redshift.
-
5.
However, high N v/He ii ratios do not always mean high NLR metallicities, but correspond mainly to high ionization parameters.
Acknowledgements.
We would like to thank the VLT staff for their invaluable help during the observations and G. Ferland for providing the excellent photoionization code Cloudy to the public. We also thank the anonymous referee for useful comments and suggestions. This work was financially supported in part by the Japan Society for the Promotion of Science (Nos. 15340059, 17253001, and 19340046). KM acknowledges financial support from the Circle for the Promotion of Science and Engineering of Japan. TN is financially supported through the Research Promotion Award of Ehime University. RM and AM acknowledge partial support by the Italian Space Agency (ASI) through contract ASI-INAF I/016/07/0.References
- (1) Allen, M. G., Groves, B. A., Dopita, M. A., et al. 2008, ApJS, 178, 20
- (2) Baldwin, J. A., Ferland, G. J., Korista, K. T., et al. 2003a, ApJ, 582, 590
- (3) Baldwin, J. A., Hamann, F., Korista, K. T., et al. 2003b, ApJ, 583, 649
- (4) Bennert, N., Jungwiert, B., Komossa, S., et al. 2006, A&A, 456, 953
- (5) Bennert, N., Jungwiert, B., Komossa, S., et al. 2006, A&A, 459, 55
- (6) Bentz, M. C., Hall, P. B., & Osmer, P. S. 2004, AJ, 128, 561
- (7) De Breuck, C., Röttgering, H., Miley, G., et al. 2000, A&A, 362, 519
- (8) De Breuck, C., van Breugel, W, Stanford, S. A., et al. 2002, AJ, 123, 637
- (9) Dietrich, M., Hamann, F., Shields, J. C., et al. 2002, ApJ, 581, 912
- (10) Dietrich, M., Hamann, F., Shields, J. C., et al. 2003, ApJ, 589, 722
- (11) Dopita, M. A., Kewley, L. J., Heisler, C. A., et al. 2000, ApJ, 542, 224
- (12) Erb, D. K., Shapley, A. E., Pettini, M., et al. 2006, ApJ, 644, 813
- (13) Ferguson, J. W., Korista, K. T., Baldwin, J. A., et al. 1997a, ApJ, 487, 122
- (14) Ferguson, J. W., Korista, K. T., & Ferland, G. J. 1997b, ApJS, 110, 287
- (15) Ferland, G. J., Korista, K. T., Verner, D. A., et al. 1998, PASP, 110, 761
- (16) Ferrarese, L., & Merritt, D. 2000, ApJ, 539, L9
- (17) Gebhardt, K., Bender, R., Bower, G., et al., 2000a, ApJ, 539, L13
- (18) Gebhardt, K., Richstone, D., Kormendy, J., et al., 2000b, AJ, 119, 1157
- (19) Greene, J.E., & Ho, L. C. 2005, ApJ, 627, 721
- (20) Hamann, F., & Ferland, G. J. 1992, ApJ, 391, L53
- (21) Hamann, F., & Ferland, G. J. 1993, ApJ, 418, 11
- (22) Hamann, F., Korista, K. T., Ferland, G. J., et al. 2002, ApJ, 564, 592
- (23) Humphrey, A., Villar-Martín, M., Vernet, J., et al. 2008, MNRAS, 383, 11
- (24) Iwamuro, F., Motohara, K., Maihara, T., et al. 2003, ApJ, 598, 178
- (25) Jiang, L., Fan, X., Vestergaard, M., et al. 2007, AJ 134, 1150
- (26) Juarez, Y., Maiolino, R., Mujica, R., et al. 2009, A&A 494, L25
- (27) Kollmeier, J. A., Onken, C. A., Kochanek, C.S., et al. 2006, ApJ, 648, 128
- (28) Kormendy, J., & Richstone, D. 1995, ARA&A, 33, 581
- (29) Lee, H., Skillman, E. D., Cannon, J. M. et al. 2006, ApJ, 647, 970
- (30) Lequeux, J., Peimbert, M., Rayo, J. F., et al. 1979, A&A, 80, 155
- (31) Liu, X., Shapley, A. E., Coil, A. L., et al. 2008, ApJ, 678, 758
- (32) Magorrian, J., Tremaine, S., Richstone, D., et al. 1998, AJ, 115, 2285
- (33) Maiolino, R., Nagao, T., Grazian, A., et al. 2008, A&A, 488, 463
- (34) Marconi, A., & Hunt, L. K. 2003, ApJ, 589, L21
- (35) Marconi, A., Moorwood, A. F. M., Salvati, M., et al. 1994, A&A, 291, 18
- (36) Mathews, W. G., & Ferland, G. J. 1987, ApJ, 323, 456
- (37) Matteucci, F. 2008, arXiv:0804.1492
- (38) Nagao, T., Maiolino, R., & Marconi, A. 2006a, A&A, 447, 863
- (39) Nagao, T., Maiolino, R., & Marconi, A. 2006b, A&A, 459, 85
- (40) Nagao, T., Marconi, A., & Maiolino, R. 2006c, A&A, 447, 157
- (41) Nagao, T., Murayama, T., Shioya, Y., et al. 2002a, ApJ, 567, 73
- (42) Nagao, T., Murayama, T., Shioya, Y., et al. 2002b, ApJ, 575, 721
- (43) Nagao, T., Murayama, T., Shioya, Y., et al. 2003, AJ, 125, 1729
- (44) Nagao, T., Murayama, T., Taniguchi, Y. 2001a, ApJ, 546, 744
- (45) Nagao, T., Murayama, T., Taniguchi, Y. 2001b, ApJ, 549, 155
- (46) Overzier, R. A., Röttgering, H. J. A., Kurk, J. D., et al. 2001, 370, L39
- (47) Robinson, A., Binette, L., Fosbury, R. A. E., et al. 1987, MNRAS, 227, 97
- (48) Savaglio, S., Glazebrook, K., Le Borgne, D., et al. 2005, ApJ, 635, 260
- (49) Schlegel, D. J., Finkbeiner, D. P., & Davis, M. 1998, ApJ, 500, 525
- (50) Shemmer, O., & Netzer, H. 2002, ApJ, 567, L19
- (51) Shemmer, O., Netzer, H., Maiolino, R., et al. 2004, ApJ, 614, 547
- (52) Suganuma, M., Yoshii, Y., Kobayashi, Y., et al. 2006, ApJ, 639, 46
- (53) Tremonti, C. A., Heckman, T. M., Kauffmann, G., et al. 2004, ApJ, 613, 898
- (54) Trump, J. R., Impey, C. D., Kelly, B. C., et al. 2009, ApJ, submitted
- (55) van Ojik, R., Röttgering, H. J. A., Miley, G. K., et al. 1994, A&A, 289, 54
- (56) Vernet, J., Fosbury, R. A. E., Villar-Martín, M., et al. 2001, A&A, 366, 7