MULTIPLICITY OF NOVA ENVELOPE SOLUTIONS AND OCCURRENCE OF OPTICALLY THICK WINDS
Abstract
We revisit the occurrence condition of optically thick winds reported by Kato (1985) and Kato & Hachisu (1989) who examined mathematically nova envelope solutions with an old opacity and found that optically thick winds are accelerated only in massive white dwarfs (WDs) of . With the OPAL opacity we find that the optically thick wind occurs for WDs and that the occurrence of winds depends not only on the WD mass but also on the ignition mass. When the ignition mass is larger than a critical value, winds are suppressed by a density-inversion layer. Such a static solution can be realized in WDs of mass . We propose that sequences consisting only of static solutions correspond to slow evolutions in symbiotic novae like PU Vul because PU Vul shows no indication of strong winds in a long-lasted flat peak followed by a very slow decline in its light curve.
Subject headings:
binaries: symbiotic — novae, cataclysmic variables — stars: individual (PU Vul) — stars: interiors — stars: mass loss1. INTRODUCTION
Nova is a thermonuclear runaway event on a white dwarf (WD). During a nova outburst, the envelope on the WD expands to a giant size. It reaches the maximum brightness and then becomes dark as the envelope loses its mass due to strong winds. Evolutions of such shell flashes have been theoretically followed by many authors with hydrodynamic/hydrostatic time-dependent calculations (Paczyński & Żytkow, 1978; Sparks et al., 1978; Nariai et al., 1980; Iben, 1982; Prialnik et al., 1986; Prialnik & Kovetz, 1995; Sion et al., 1979), by using a sequence of steady-state solutions (Kato, 1983b; Kato & Hachisu, 1988, 1994), and by using a sequence of static solutions (Fujimoto, 1982; MacDonald, 1983).
The time scale of nova evolution depends strongly on the WD mass. Massive WDs correspond to fast novae while less massive WDs do to slow novae. When the optically thick winds occur a large part of the envelope is blown off by winds, and the nova duration is drastically shortened (Kato & Hachisu, 1994; Prialnik & Kovetz, 1995). In less massive WDs winds are relatively weak, and in some cases, no optically thick winds occur. However, the occurrence condition of winds has not been well studied yet.
Kato (1985) mathematically examined the occurrence of optically thick winds with the Kramers opacity and found that the optically thick wind occurs when the luminosity approaches the Eddington luminosity and the opacity increases outward. Kato & Hachisu (1989) showed that the optically thick wind occurs only in massive WDs of , where is the WD mass. Wind acceleration is due to opacity enhancements at hydrogen and helium ionization zones. They also showed that a nova evolution can be well represented by a sequence consisting only of static solutions for , and by a sequence of wind and static solutions for .
In the beginning of 1990’s, opacity tables are revised (OPAL opacity: Iglesias & Rogers, 1996, and references therein), which show a prominent peak at (K) strong enough to accelerate winds even in less massive WDs of (Kato & Hachisu, 1994). However, the occurrence condition of winds has not been clarified yet, because the OPAL opacity has an intense peak at much higher temperature region than the helium ionization zone. Therefore, we re-examine the occurrence of optically thick winds for the OPAL opacity. We focus on less massive WDs in view of the application to slow novae or symbiotic novae in which less massive WDs certainly inhabit.
In §2 we introduce our simplified model for nova outbursts. Then we present evolution sequences for three different WD masses in §3. Temporal changes of internal structure during nova outbursts are shown in §4. The occurrence condition of optically thick winds on various WD masses is presented in §5. Discussion and summary follow in §§6 and 7.
2. A SIMPLIFIED MODEL

Figure 1 presents a schematic HR diagram of one cycle of nova outbursts. After thermonuclear runaway sets in on an accreting white dwarf (point A), the star brightens up and its envelope expands to a giant size. Optically thick winds blow in massive WDs during the extended envelope stage (from point B to point D through C). The star reaches the maximum radius at point C, where the envelope settles down into a thermal equilibrium in which nuclear energy generation is balanced with radiative loss. Afterwards, the star moves leftward keeping luminosity almost constant. Hydrogen nuclear burning stops at point E, and the star cools down to point A.
When the wind occurs we solve the equations of motion, mass continuity, radiative diffusion, and conservation of energy, from the bottom of the hydrogen-rich envelope through the photosphere assuming steady-state and spherical symmetry. This steady-state is a good approximation in the decay phase or in weak shell flashes (Prialnik et al., 1986; Kato et al., 1989). When the optically thick wind does not occur, we solve the equation of hydrostatic balance instead of the equation of motion. In the rising phase, we integrated energy conservation equation without energy generation term due to nuclear burning and later estimated energy generation using the temperature and density obtained (Fujimoto, 1982). In the decay phase we set the condition that the energy generation is balanced with radiative energy loss. These equations and method of calculations are already published in Kato & Hachisu (1994).
In the rising phase, i.e., from point A to C in Figure 1, we approximate the nova evolution by a sequence of envelope solutions as follows. When the optically thick wind occurs we use static solutions from point A to B and steady-state wind solutions from point B to C in Figure 1. When the wind does not occur the entire sequence consists only of static solutions. The occurrence of optically thick winds is detected by the condition described in Kato (1985) :(1) the photospheric luminosity approaches the Eddington limit and (2) at the same time the thermal energy at the photosphere is comparable to the gravitational energy. We further assume that the envelope mass does not decrease much in the rising phase, i.e., we approximate the rising-phase by a sequence of envelope solutions with a constant mass which we define as the “ignition mass”, . This approximation may be too simple but we are interested in qualitative properties of the envelope evolution, which are hardly changed even if we assume decreasing envelope mass.
In the decay phase the envelope settles down into a thermal equilibrium, that is, the energy release due to nuclear burning is balanced to the outgoing energy flux. We approximate this stage by a sequence of optically thick wind solutions (from point C to point D) and static solutions (from point D to point E). When the wind does not occur, the entire decay phase are approximated by a sequence only of static solutions. In this sequence (from point C to E) the envelope mass is decreasing from its initial value of at point C. Time-evolution is calculated from the mass decreasing rates by nuclear burning and wind mass-loss if it occurs (see Kato & Hachisu, 1994, for more details). Hydrogen burning stops at point E and after that, from point E to A, the evolution is followed by a static solution with a constant envelope mass.
We have neglected effects of convection in wind solutions, because convection is ineffective in a rapidly expanding envelope (Kato & Hachisu, 1994). Convective energy transport is calculated in static solutions using the mixing length theory with otherwise specified. Effects of the parameter on our results are discussed in §6.3. We use the OPAL opacity (Iglesias & Rogers, 1996).
We further assume that the chemical composition of the envelope is uniform throughout the envelope and is unchanged with time, because the convection widely develops to mix the whole envelope in the early phase of outbursts. The solar composition is assumed for the envelopes otherwise specified, which is a good approximation for weak shell flashes. Prialnik & Kovetz (1995) showed that the composition of ejecta is close to the solar for high mass accretion rates.
The above approximations may not be accurate enough to follow nova outbursts but sufficient for our purpose of qualitative study on the occurrence of winds and on the internal structures of WD envelopes.
3. NOVA SEQUENCES
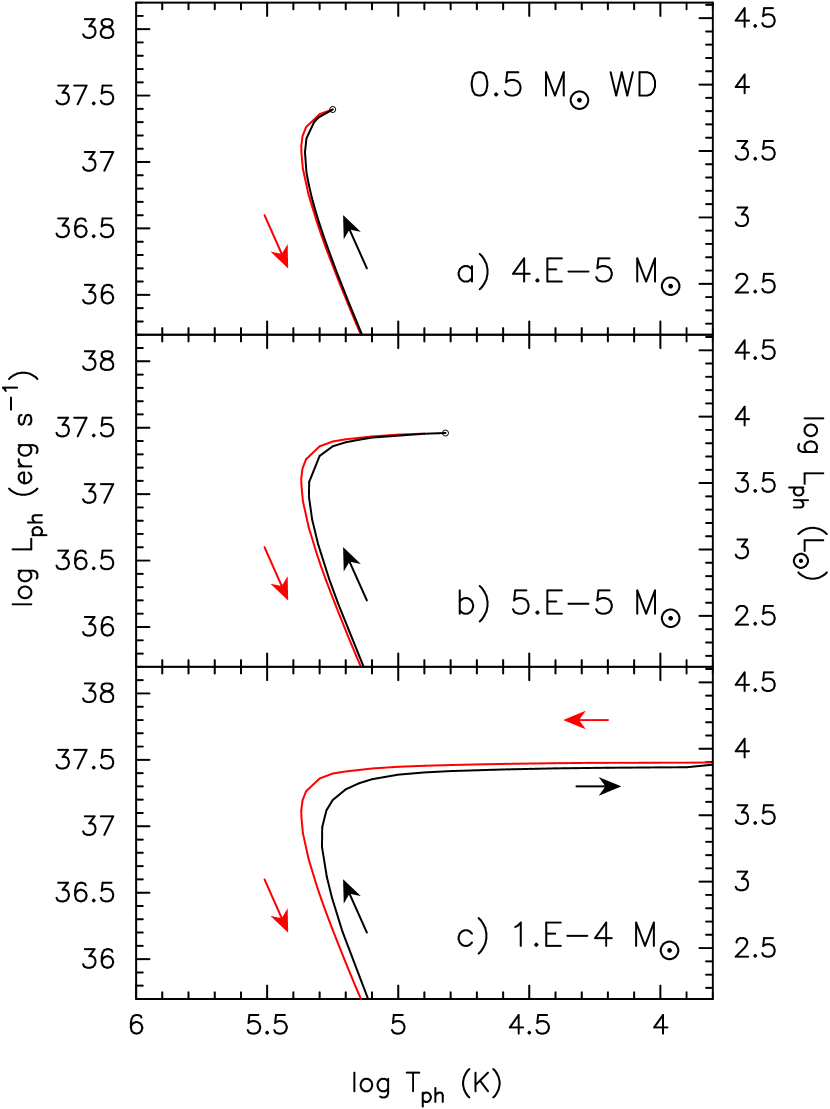
Figures 2, 3, and 4 show the quasi-evolution sequences that mimic the rising and decay phases of nova outbursts. In a case of WD, no optically thick winds are accelerated at all, thus all the sequences in Figures 2 consist of static solutions. Figure 2a shows a case with a small ignition mass of . The rising phase ends when the photospheric temperature and radius reach (K) and (cm), respectively. This point is the maximum expansion where the envelope reaches thermal equilibrium. The maximum expansion shifts toward lower temperature when we increase the ignition mass. In a case of (Fig. 2b) the temperature and radius at the maximum expansion are (K) and (cm), respectively, and for (Fig. 2c), (K) and (cm), respectively.
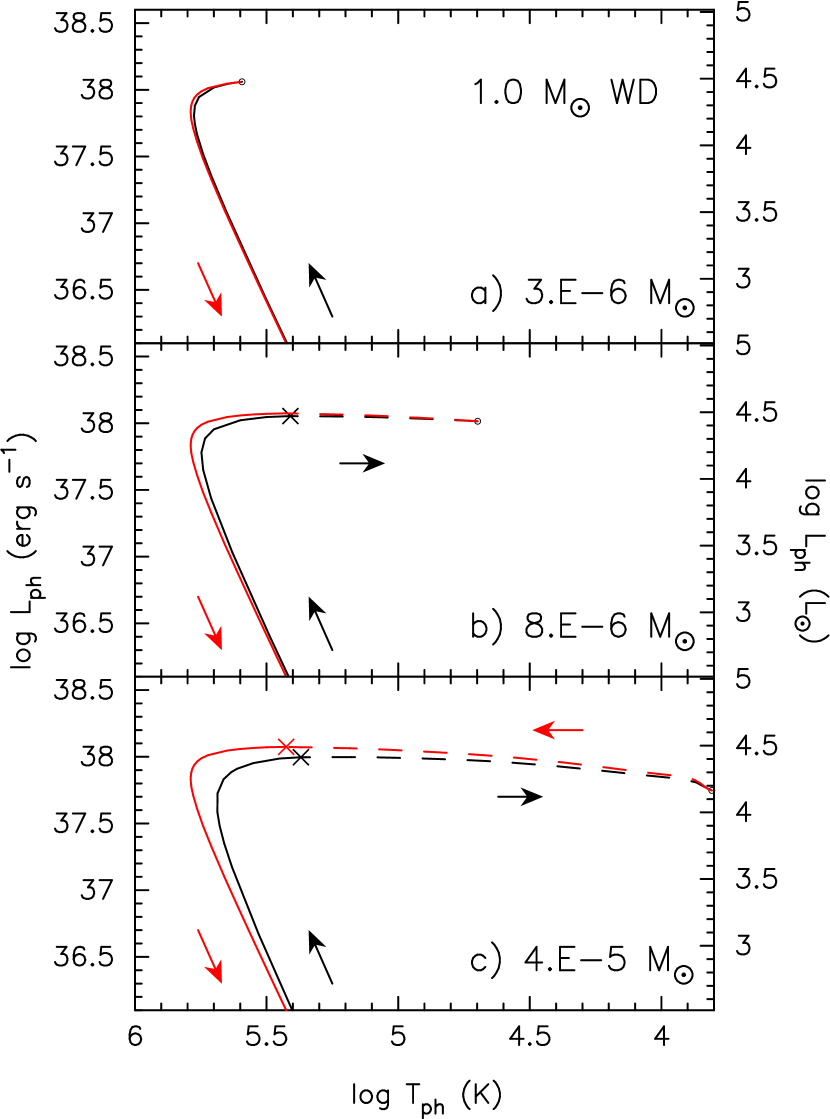
Figure 3 shows a WD case. If we increase the ignition mass as , and , the temperature and radius at the maximum expansion change to (K), and 3.8, and (cm), , and , respectively. We found that optically thick winds occur for . We define this critical mass for winds as , i.e., winds occur when . As a wind is accelerated due to the opacity peak at (K), optically thick winds occur in the lower temperature side of the peak (Kato & Hachisu, 1994) as shown by the dashed line in Figures 3b and 3c. If we further increase the ignition mass to , winds are suppressed and static solutions exist instead of wind solutions. This is because hydrostatic balance is established in the envelope when a substantial amount of matter above the super-Eddington region, i.e., around the opacity peak, supresses down the wind-acceleration. We define this critical mass for static expansion, as . If no winds are accelerated and the envelope expands without optically thick winds. However, this critical value is too large for the ignition mass of an accreting WD (Prialnik & Kovetz, 1995), so such static solutions are not realized and we don’t go into details.
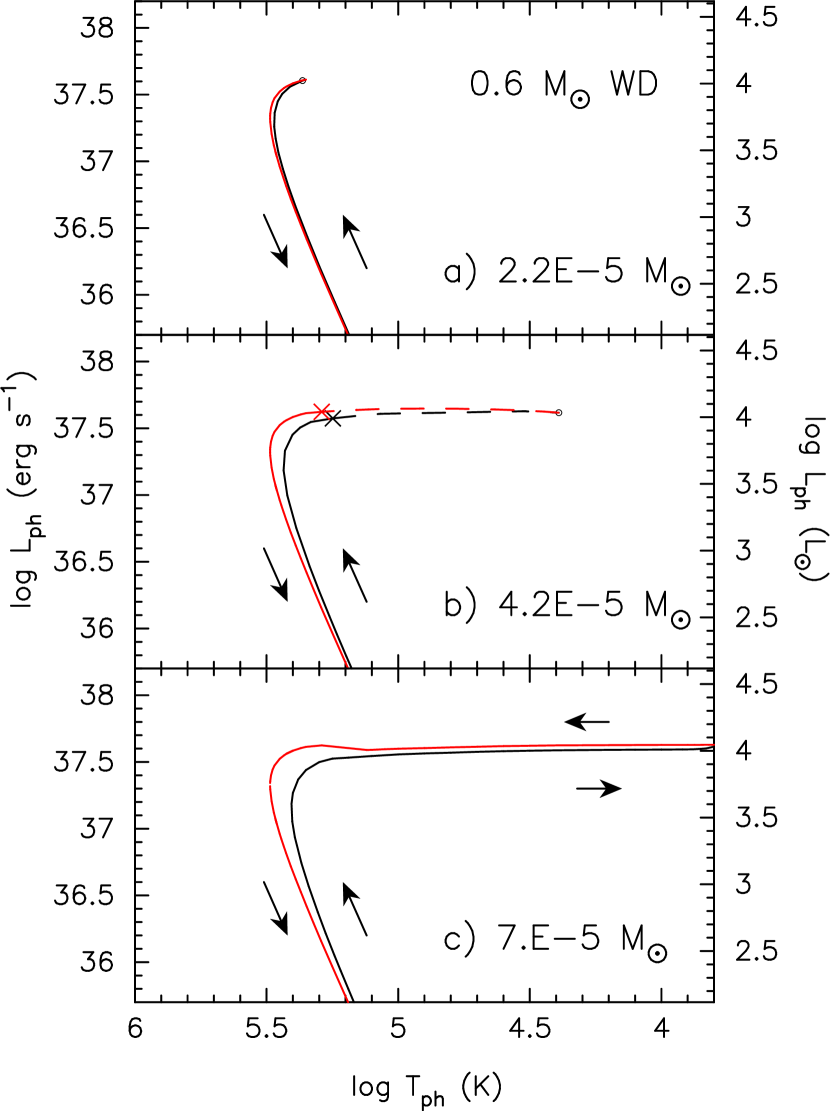
These two critical masses of and depend on the WD mass. For a 0.6 WD, we obtained and . Figure 4a shows a case of , in which no winds occur because the photospheric temperature does not reach the OPAL peak even at the maximum expansion at (K)= 5.35 and (cm). In the case of (Fig. 4b) the optically thick winds begin when the photospheric temperature decreases to (K). The maximum expansion reaches the photospheric radius of (cm) and the temperature of (K) . Figure 4c shows the case of () in which the whole period of the outburst can be followed by a sequence of static solutions.
Note that there is only one path for the decay phase of the WD when it is in a thermal equilibrium. The two decay phases in Figures 2a and 2b are a part of that in Figure 2c. Similarly the decay phases of Figures 3a and 3b are identical to that of Figure 3c. On the other hand, there are two different paths in the WD even when it is in thermal equilibrium. The decay phase of Figure 4b consists of wind and static solutions, only the latter part of which is identical to that of Figure 4c. The wind sequence in Figure 4b and the static sequence at in Figure 4c are different from each other all in envelope structure, in evolution time scale, and in light curve as we will see later.
4. INTERNAL STRUCTURES

Figure 5 shows the distribution of the diffusive luminosity and the local Eddington luminosity against the temperature for solutions along the rising phase of Figure 4b, i.e., WD of . Here, the local Eddington luminosity is defined as
| (1) |
where is the opacity in which we use the OPAL opacity (Iglesias & Rogers, 1996). Since the opacity is a function of the temperature and density, the Eddington luminosity is also a local variable. This Eddington luminosity has a local minimum at (K) = 5.25 corresponding to the opacity peak as shown in Figure 5f.
As the star moves upward in Figure 4b, the diffusive luminosity increases and approaches the Eddington luminosity near the photosphere (Figures 5a,b, and c). When the photospheric temperature decreases to (K) , matter is accelerated and steady mass-loss begins (Figure 5d). After that, the envelope continuously expands to until point C in Figure 1. A narrow super-Eddington region appears corresponding to the opacity peak at (K) .

The change of envelope structure is shown in Figure 6. We see that the structure of the static solution just before the wind occurs is very similar to that of the adjacent wind solution. This property has been already pointed out by Kato (1985) for the old opacity and here we confirm it for the OPAL opacity having a prominent peak at a much higher temperature region.

In the massive envelope of , however, no winds arise when the envelope expands beyond the opacity peak of (K) . Figures 7 and 8 show internal structures in such an evolution sequence. Difference from the wind sequence becomes prominent as the envelope expands (see Figs. 5 and 6).
A remarkable difference can be observed in the density distribution. Figure 6 shows the monotonically decreasing density having a dependence in the outer envelope ( (cm) ) as expected from the equation of continuity const, where the velocity is almost constant in an outer part of the envelope. On the other hand, the envelope in the static sequence (Fig. 8) develops large density-inversion at (cm) corresponding to a super Eddington region. This density-inversion arises in order to keep hydrostatic balance in the super-Eddington region () as expected from the equation of hydrostatic balance. Inefficient convections occur in the region of but are unable to carry all of the diffusive energy flux, thus the structure is super-adiabatic. Comparing Figure 8 with Figure 6 we see a prominent core-halo structure in the density and temperature distributions in the static solutions.

Such differences between the wind and static sequences can be also seen in the decay phase. Figure 9 demonstrates the difference between the two solutions in the decay phase of WD. Both the static and wind solutions have the same photospheric temperature (K) but they are very different in their internal structures. The mass-losing envelope shows the density distribution of in the outer part while the quasi-static envelope develops a wide density-inversion region.

5. OCCURRENCE OF OPTICALLY THICK WINDS
As we have seen in the previous sections, the wind mass-loss occurs in a limited range of the envelope mass. When the ignition mass is smaller than the envelope expands a little and the photospheric temperature does not reach the opacity peak of (K) (see Figs. 3a and 4a). Therefore, no optically thick winds occur. On the other hand, if the ignition mass is larger than , winds are suppressed in a way that density-inversion balances to radiation-pressure gradient in a super-adiabatic region (see Fig. 8). In this case the envelope expands without optically thick winds. Therefore, optically thick winds occur only for as we have already seen in the 0.6 WD.

Figure 10 depicts these two critical masses of and for various WD masses. Optically thick winds are driven in the right hand side of the thick solid line. In the lower region the envelope does not expand much and no optically thick winds arise. In the upper region ) the envelope is so massive and winds are suppressed. Here, we label the lower region “no expansion”, and the upper region “expansion”, which is an abbreviation of “quasi-static expansion”.
As the OPAL opacity depends on the chemical composition of the envelope, both and depend on the composition. For a composition of typical classical novae ( and the wind is strongly accelerated and the “wind” region extends as shown in Figure 10. On the other hand, for Population II stars with lower metal content, the wind is weak (Kato, 1997, 1999) and the “wind” region becomes narrower.
Figure 10 also shows that increases with the WD mass and reaches as large as for WDs. Such a large ignition mass is unlikely to be realized in accreting WDs. Dynamical calculations have shown that the envelope mass is up to for a 1.0 WD and for a 1.4 for the accretion rate of yr-1 and yr-1 for cold WDs (Yaron et al., 2005). These values are practically upper limits for the envelope mass in nova outbursts but are still much smaller than . Therefore, we regard that the ”expansion” region and a part of the upper “wind” region theoretically exist but may not be realized in the actual mass-accreting WDs.
In less massive WDs such as , on the other hand, is as small as , which corresponds to the mass-accretion rates of yr-1 (Prialnik & Kovetz, 1995), a typical mass accretion rate in cataclysmic variables. Therefore, the “expansion” region becomes a subject of realistic interest. If the ignition mass is larger than the envelope expands in a quasi-static manner. In less massive WDs of the “wind” region disappears completely and the envelope evolves in a quasi-static manner.
6. DISCUSSION
6.1. Light Curves in the Decay Phase
As we see in Figure 4 there are two different sequences that represent the decay phase of nova outbursts on a 0.6 WD. These two sequences are different from each other in its envelope mass and mass decreasing rate, so the light curves are also different. Figure 11 shows the light curves corresponding to these sequences, both of which start from (K) . The light curve of the static sequence decays much slowly, because its evolution speed is determined by the mass-decreasing rate due only to hydrogen nuclear burning, whereas in the ”wind” sequence the evolution is accelerated by the winds which carry away a large part of the envelope matter. The most remarkable difference is in the flat peak of the static sequence, whereas it decays sharply in the wind sequence.

The flat peak in the static sequence reminds us a peculiar light curve of the symbiotic nova PU Vul, which shows a very long plateau peak of 3000 days followed by a slow decline of 3 magnitudes/2500 days. The spectra suggest a very quiet expansion with no indication of wind mass loss during the flat peak (Iijima & Ortolani, 1984; Kanamitsu et al., 1991; Kolotilov et al., 1995; Yamashita et al., 1982). We may apply our static ”expansion” sequences to such slow outbursts. Detailed light curve fitting will be presented separately.
Both of the wind and static expansion solutions are certainly stable because they represent nova envelope and red giant envelope, respectively. However, it is interesting to point out a possibility that a nova evolves along the static expansion sequence but it suddenly jumps in the wind sequence or vice versa during the course of evolution. If this kind of transition occurs it may proceed from a higher total enthalpy state to a lower one. The enthalpy integrated for the entire envelope is, for example, erg for a static envelope solution of with (K) , and erg for a wind mass-loss solution of a similar envelope mass and photospheric temperature. Therefore, if the transition occurs it possibly goes from the static expansion sequence to the wind sequence. As the internal structure of the two solutions are very different (see Fig. 9) and the excess energy will be released, the transition may not occur in a quiet way but accompany some violent activities. It may be interesting to connect such activities to oscillatory behaviors often observed in early light curves of slow/symbiotic novae.
Figure 11 demonstrates that both of the static ”expansion” and ”wind” sequences exist for the same WD mass and the same chemical composition of the envelope. If the accretion rate onto the WD changes with time and, as a result, the ignition mass changes from one outburst to the next around , these two different types of outbursts can be realized on the same WD. In such a case outbursts behave very differently for a small change of mass-accretion rate.
In this way, we expect many active phenomena associated with static expansion sequences. More quantitative studies including light curve analysis of slow/symbiotic novae are necessary.
6.2. Comparison with Dynamical Calculations
We have obtained , the lower critical mass for the envelope having optically thick winds. This critical mass is compared with hydrodynamical calculations by Prialnik & Kovetz (1995) who presented a number of shell flashes for various parameters. The open circles with a dot in Figure 10 denote their models in which mass ejection occurs, and the crosses indicate the models with no mass ejection. In these models the chemical composition of the envelope is not uniform but close to the solar value because dredge-up of WD material is insignificant for high mass-accretion rates. Therefore, these models can be compared with our model labeled “solar”. Our critical line is quite consistent with their results except the WD, in which their crosses are above our line. These authors defined the ”mass ejection” by that the expansion velocity exceeds the escape velocity, which is different from our definition of occurrence condition of the winds described in §4. In our wind solutions of the velocity does not exceeds the escape velocity as shown in Figure 6. Considering this difference and other difference of input parameters, we can say that our is quite consistent with results in Prialnik & Kovetz (1995).
6.3. Dependence on the Mixing Length Parameter
We assumed a mixing-length parameter of . Many authors have estimated the parameter to be (Asida, 2000; Palmieri et al., 2002, and references therein) for various types of stars. The mixing-length parameter could be a function of stellar parameters or could depend on stellar structure, but these dependences are not known yet. Therefore, we simply adopted .
In order to see the dependence of light curves on the mixing-length parameter we have calculated additional models with and as shown in Figure 11. For a smaller , the energy transport is more efficient and the star evolves faster, resulting in a steeper light curve. Even though, the static sequences still show a long-lasted flat peak and slow decline after that.
7. SUMMARY
Our main results are summarized as follows;
(1) For a given WD mass and chemical composition, the optically thick wind occurs when the ignition mass () satisfies the condition, i.e., . If the envelope does not expand and no wind is accelerated. When , winds are suppressed and the envelope expands with no optically thick winds.
(2) Optically thick winds occur smoothly from a static envelope because the structure is not drastically changed before and after the wind occurs. This property was already reported in Kato (1985) for the old opacity but we confirm this for the OPAL opacity.
(3) For a given WD mass and chemical composition, there exist two solutions with different structures. One is the wind solution with a monotonic decrease in the density distribution. Another is the static solution that develops a wide super-adiabatic region with density inversion.
(4) In massive WDs (), is very large and the static-expansion sequence is not practically realized (). In the intermediate mass WDs (), both the optically thick wind and quasi-static expansion are realized depending on the ignition mass. In less massive WDs () no optically thick wind occurs independently of the ignition mass.
(5) The wind sequence has been applied to nova outbursts in which strong mass-loss is observed. The newly found quasi-static expansion sequence may be applied to slow evolutions of symbiotic novae like PU Vul, which shows a long-lasted flat peak with no indication of strong winds.
References
- Asida (2000) Asida, S.M. 2000, ApJ, 528, 896
- Fujimoto (1982) Fujimoto, M.Y. 1982, ApJ, 257, 752,
- Iben (1982) Iben, I. Jr. 1982, ApJ, 259, 244
- Iglesias & Rogers (1996) Iglesias, C. A., & Rogers, F. J. 1996, ApJ, 464, 943
- Iijima & Ortolani (1984) Iijima,T., & Ortolani,S. 1984, A&A, 136, 1
- Kanamitsu et al. (1991) Kanamitsu, O., Yamashita, Y., Norimoto, Y., Watanabe, E., Yutani, M. 1991, PASJ, 43, 523
- Kato (1983a) Kato, M. 1983a, PASJ, 35, 33
- Kato (1983b) Kato, M. 1983b, PASJ, 35, 507
- Kato (1985) Kato, M. 1985, PASJ, 37, 19
- Kato & Hachisu (1988) Kato, M., & Hachisu, I. 1988, ApJ, 329, 808
- Kato (1997) Kato, M. 1997, ApJS, 113, 121
- Kato (1999) Kato, M. 1999, PASJ, 51, 525
- Kato & Hachisu (1989) Kato, M., & Hachisu, I., 1989, ApJ, 346, 424
- Kato & Hachisu (1994) Kato, M., & Hachisu, I., 1994, ApJ, 437, 802
- Kato et al. (1989) Kato, M., Saio, H., & Hachisu, I., 1989, ApJ, 340 509
- Kolotilov et al. (1995) Kolotilov,E.A., Munari,U., & Yudin,B.F., 1995, MNRAS275,185
- MacDonald (1983) MacDonald, J. 1983, ApJ, 267,732
- Nariai et al. (1980) Nariai, K., Nomoto, K., & Sugimoto, D. 1980, PASJ, 32, 473
- Paczyński & Żytkow (1978) Paczyński, B. & Żytkow, A.N. 1978, ApJ, 222, 604
- Palmieri et al. (2002) Palmieri, R., Piotto, G., Saviane, I., Girardi, L. & Castellani,V. 2002, A&A, 392, 115
- Prialnik et al. (1986) Prialnik, D., 1986, ApJ, 310,222
- Prialnik & Kovetz (1995) Prialnik, D., & Kovetz, A. 1995, ApJ, 445,789
- Sion et al. (1979) Sion, E. M., Acierno, M.J., & Tomczyk, S. 1979, ApJ, 230, 832
- Sparks et al. (1978) Sparks, W. N., Starrfield, S., & Truran J. W. 1978, ApJ, 220, 1063
- Yaron et al. (2005) Yaron, O., Prialnik, D., Shara, M.M., Kovetz, A. 2005, ApJ, 623, 398
- Yamashita et al. (1982) Yamashita, Y., Maehara, H., Norimoto, Y., 1982, PASJ, 34,269