A 50 MHz System for GMRT
Abstract
This paper describes a 50 MHz system being developed for GMRT to provide imaging capability in the frequency range 30-90 MHz. Due to its larger collecting area and higher antenna efficiency, the low frequency GMRT system will be several times more sensitive than the present 74 MHz VLA system and is likely to remain a competitive instrument in this frequency band. In the first phase of this project, receiver systems consisting of V-dipole feeds and front-ends have been installed on four of the thirty GMRT antennas. Test observations were carried out on a number of bright 3C sources. The initial results are encouraging. This paper will also describe results of simultaneous observations carried out using the existing GMRT correlator, the new GMRT software correlator and a system employing digitization and direct recording of signals at two antenna bases.
Raman Research Institute, Bangalore 560 080, India
Email: uday@rri.res.in
1. Introduction
The Giant Metrewave Radio Telescope (GMRT) is an interferometric array consisting of thirty 45-m diameter antennas spread over 25 km, operating in frequency bands centred around 151, 325, 610/235, and 1400 MHz. Receivers and feeds for operation at frequencies below 100 MHz are currently not available.
A 50 MHz system for GMRT is being built by the Raman Research Institute, Bangalore, to carry out a low frequency survey of the sky visible to GMRT with arcmin resolution and better surface brightness sensitivity. The survey results and the observing system will be made available to the astronomy community. With a primary beam area of 0.03 steradians, a mosaic of about 300 pointings is required to cover the northern sky. Expected survey parameters, at 50 MHz, assuming a 10 MHz bandwidth, are given below and a comparison with other major surveys is given in Table 1.
-
•
Nominal system temperature: K (sky dominated).
-
•
Synthesized beam: .
-
•
RMS sensitivity (4 hr synthesis with dual polarization): mJy beam-1 (thermal noise limited).
This is about two orders of magnitude better than the 74 MHz VLA survey. We expect the proposed 50 MHz survey to be at least an order of magnitude better even if we do not achieve the thermal noise limited sensitivity but get limited by the dynamic range.
| Survey | Sky | Telescope | Surveying | RMS | Equivalent RMS |
|---|---|---|---|---|---|
| Name | Coverage | time | speed | noise | noise at 50 MHz |
| (Frequency) | steradians | hours | hours/steradian | - in mJy | - in mJy |
| RRI-GMRT (50 MHz) | 3 | 1200 | 128 | 2(10)* | 2(10)* |
| NVSS (1.4 GHz) | 10.3 | 2700 | 262 | 0.45 | 6.5 |
| WENSS (325 MHz) | 960 | 305 | 3.6 | 16 | |
| VLSS (74 MHz) | 900 | 95 | 100 | 137 |
* Terms in brackets denote dynamic range limited performance.
2. Feed design
The main goals of the feed system design were to obtain a reasonable aperture efficiency (), symmetrical E & H-plane patterns and, a suitable physical dimension for co-locating it with one of the existing feeds on the GMRT antenna turret, with minimum interference to its operation. The desired frequency range of operation (30-90 MHz) was chosen to facilitate imaging in the band protected for radio astronomy (around 38 MHz), to have an overlap with the 74 MHz system of VLA and to minimize the radio frequency interference (RFI) due to the FM radio band starting beyond 90 MHz.
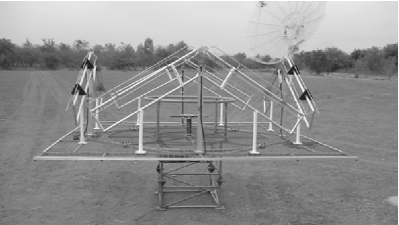
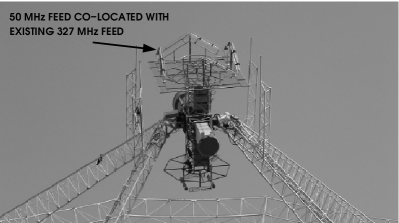
A feed system consisting of four folded V-dipoles in a boxing-ring configuration (Fig. 1a) was developed since it provides a more symmetric E & H-plane patterns than a single dipole feed (Amiri et al. 2007). After extensive simulations and field trials, it was decided to co-locate the new feed with the existing 327 MHz feed (Fig. 1b). A V-configuration of the dipole facilitated accommodating the required length of the dipole despite the space constraints.
Four GMRT antennas, C04, C11, E02 and W02, were equipped with the new V-dipole feeds. The maximum east-west baseline, E02-W02, is km, while the north-south baseline, C04-C11, is km.
3. Test observations with the new feed system
In September 2007, several 3C sources (including Cyg-A and Cas-A) were observed using the existing GMRT receiver system. Observations of Cyg-A, centred at 55 MHz, for an hour showed:
- •
-
•
The rms noise observed in a single channel, with a bandwidth of 31.25 kHz, is 6% of the flux density of Cyg-A.
-
•
The RMS of closure phase is , which is as expected for a measured SNR of 17 on the amplitude measurement of Cyg-A in each baseline.
Test observations carried out at GMRT showed that improvement in signal-to-noise ratio (SNR) as a function of bandwidth () and integration time () was not forthcoming when observed using the existing GMRT receiver chain (Dwarakanath et al. 2008). This is a well known issue with GMRT continuum observations at other frequencies also. The SNR saturated at a value of 17 for all the observed baselines. While the reasons for this were not clear, RFI was suspected to be one of the causes. To study if this limitation could be overcome by digitizing the outputs of the low frequency front-end receivers right at antenna bases, direct voltage recording systems were developed.
4. Direct voltage recording system

A simplified block schematic of the direct voltage recording system developed at the Raman Research Institute (hereafter referred to as RRI-DS) is shown in Fig. 2. A detailed description of this system can be found in Girish (2009).
RRI-DS digitizes a signal of MHz bandwidth using a sampling clock of MHz. The digitized data is recorded on hard disks at a rate of about 80 GB/hour (dual polarization). A GPS-disciplined rubidium oscillator installed at each antenna base synchronizes the recording systems with an accuracy of ns. The s averaged visibilities are computed offline by averaging 1024, 8192-point FFT frames.
5. Test observations with a two-element interferometer
| GMRT-HC | GMRT-SC | RRI-DS | |
|---|---|---|---|
| Bandwidth (MHz) | 8 | 16 | 5.5 |
| Spectral Channels | 128 | 512 | 4096 |
| Spectral Resolution (kHz) | 62.5 | 31.25 | 1.36 |
| Integration time (s) | 1 | 1 | 0.75 |
RRI-DSs were installed at antennas C04 and C11. In July 2008, simultaneous test observations of 3C sources were carried out using GMRT hardware correlator (GMRT-HC), GMRT software correlator (GMRT-SC) and RRI-DS, to compare the performance of the three systems. For GMRT-HC and GMRT-SC, the IF bandwidth was set to 6 MHz. Hence, only 3 MHz band was available in each sideband. There are about 50 and 100 channels, within the 3 dB bandwidth, in the GMRT-HC and GMRT-SC spectrum, respectively. Table 2 shows the relevant specifications of these three systems.
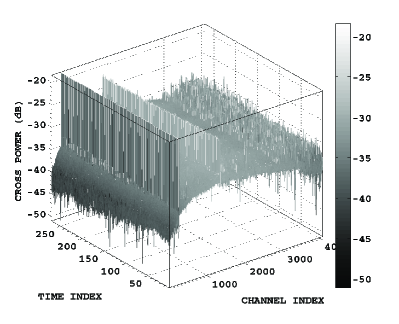
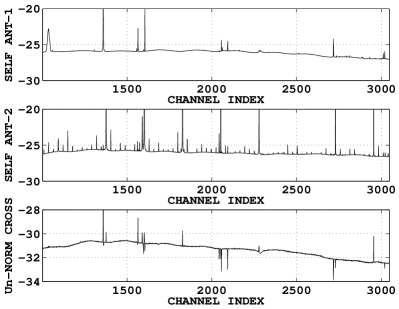
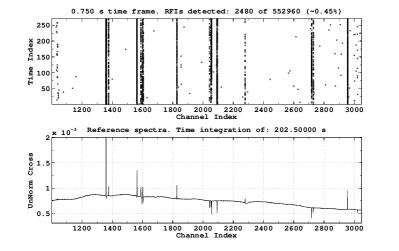
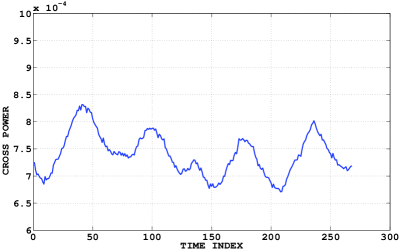
Fig. 3a shows a dynamic 4096-point cross-power spectra of Cyg-A for about 4 min with s integration time. Prior to obtaining the cross-power spectra, we mitigate strong and short (spiked) bursts of RFI in the temporal domain. Fig. 3b shows central 2048 channels of self-power and cross-power spectrum (obtained with 4 min integration). Notice the comb in self-power spectrum of antenna-2 (C11). Clearly, antenna C11 is affected more by RFI, compared to antenna C04. From the dynamic spectra, each 1 s averaged instantaneous time frame was band-normalized using a bandpass template. Any spectral channel above the 4- threshold was flagged as RFI affected channel. Fig. 4a shows the RFI scenario for the 4 min data. Statistics showed, % of the data was affected by RFI and there were less than 10 interference points that were present continuously for 10 s or more. Fig. 4b shows a plot of variation of the integrated cross-power in each of the 270, s averaged cross-power spectra. It is clearly seen that there is a very low-frequency underlying time-structure with a periodicity of about 45 s. This underlying time-structure is seen at the output of all the three systems.
After a generous excision of RFI channels and removing the low-frequency underlying structure, the SNR (mean/rms) measured after collapsing channels and integrating in time is shown in Table 3. The SNR improvements measured in GMRT-SC and RRI-DS are better by factors of about 2 and 3, respectively, when compared to GMRT-HC. However, the absolute SNR values measured for RRI-DS are off by factor of 2-5, compared to those expected.
| GMRT-HC | GMRT-SC | RRI-DS | |||||||
|---|---|---|---|---|---|---|---|---|---|
| Integration | Channel BW (kHz) | Channel BW (kHz) | Channel BW (kHz) | ||||||
| Time (s) | 62.5 | 250 | 500 | 62.5 | 250 | 500 | 62.5 | 250 | 500 |
| 1 | 41 | 43 | 55 | 66 | 80 | 105 | 87 (90)* | 150 (180)* | 175 (260)* |
| 4 | 43 | 44 | 55 | 75 | 83 | 114 | 129 (180)* | 187 (365)* | 207 (520)* |
| 8 | 45 | 45 | 56 | 77 | 85 | 116 | 148 (260)* | 198 (520)* | 215 (730)* |
* Numbers is round brackets show expected SNR.
6. Conclusions
We have successfully designed, installed and tested a 50 MHz system on 4 GMRT antennas. Aperture efficiency of % was measured in the band centred at 55 MHz. Test observations indicate satisfactory performance of the feed system. Investigations are underway to understand the mitigation of systematics and RFI, to achieve performance limited by thermal noise.
Acknowledgment
We thank our colleagues at GMRT site, NCRA and, the Mechanical Engineering Services and the Radio Astronomy Lab of RRI, for their excellent support.
References
- Amiri et al. (2007) Amiri, S., Udaya Shankar, N., Somashekhar, R., Dwarakanath, K.S., 2007, Technical Report, Raman Research Institute.
- Baars et al. (1977) Baars, J.W.M., Genzel, R., Pauliny-Toth, I.I.K. and Witzel, A., 1977, A&A., 61, 99.
- Dwarakanath et al. (2008) Dwarakanath, K.S., Udaya Shankar, N. and Somashekhar, R., 2008, Technical Report, Raman Research Institute.
- Girish (2009) Girish, B.S., 2009, MSc. (Engg.) Thesis, Submitted to the Visvesvaraya Technological University.
- Milogradov-Turin and Smith (1973) Milogradov-Turin, J. and Smith, F.G., 1973, MNRAS, 161, 269.