The Scale Height of NGC 1058 Measured from its HI Power Spectrum
Abstract
We have measured the HI power spectrum of the nearly face-on spiral galaxy NGC 1058 from radio-interferometric observations using a visibility based estimator. The power spectrum is well fitted by two different power laws , one with at small length-scales and another with at large length-scales . We interpret this change in the slope of the power spectrum as a transition from 3D turbulence at small length-scales to 2D turbulence in the plane of the galaxy’s disk at large length-scales. We use the observed break in the power spectrum to estimate the galaxy’s scale-height, which we find to be pc.
keywords:
physical data and process: turbulence-galaxy:disk-galaxies:ISM1 introduction
Evidence has been mounting in recent years that turbulence plays an important role in determining the physical conditions of the neutral interstellar medium (ISM) as well as generating the hierarchy of structures seen in it (see Elmegreen & Scalo 2004; Scalo & Elmegreen 2004, for recent reviews). Observational evidence includes the fact that the fluctuation power spectrum of a variety of tracers (HI 21-cm emission intensity, HI 21-cm optical depth, dust and molecular emission) is a scale-free power-law (Crovisier & Dickey 1983; Green 1993; Stutzki et al. 1998; Stanimirovic et al. 1999; Deshpande et al. 2000; Elmegreen et al. 2001). This scale-free behavior is characteristic of a turbulent medium. Similarly, the HI distribution in several dwarf galaxies in the M81 group appears to be fractal (Westpfahl et al. 1999). Further, the Fourier transform power spectra of the V and H images of a sample of irregular galaxies are also found to be a power law, indicating that there is no characteristic mass or luminosity scale for OB associations and star complexes (Willett et al. 2005).
Recently Begum et al. (2006) have presented a visibility based formalism for determining the power spectrum of HI intensity fluctuations in galaxies with extremely weak emission. This was applied to the dwarf galaxy DDO 210 and the power spectrum was found to be a power law with slope over the length scales pc. In a subsequent paper, we (Dutta et al., 2008) have applied the same formalism to an external disk galaxy NGC 628 (M 74) and found the slope to be over the length scales kpc. This is significantly shallower than the power spectra in earlier measurements including our Galaxy, the SMC and DDO 210, all of which exhibit a slope roughly in the range to (Green 1993; Stanimirovic et al. 1999; Begum et al. 2006). The shallower slope observed in NGC 628 was interpreted as arising from two dimensional (2D) turbulence in the plane of the galaxy’s disk on length-scales larger than the galaxy’s scale-height. The steeper slope seen in the other galaxies was ascribed to three dimensional (3D) turbulence at small length-scales. We expect a transition from 3D to 2D turbulence at a length-scale corresponding to the galaxy’s scale height. An observational detection of this transition provides a method to estimate the scale-height of face-on galaxies (Padoan et al., 2001; Elmegreen et al., 2001), a quantity which is otherwise difficult to measure.
NGC 1058 is an almost face-on, type Sc, spiral galaxy with an inclination angle in the range to (Petric & Rupen, 2007). In this Letter we use a break in the observed HI power spectrum to determine the galaxy’s scale-height. The distance to this galaxy is uncertain with previous estimates ranging from (Boroson, 1981) to (Sandage & Tammann, 1974). Throughout this paper we adopt a distance of 10 Mpc for NGC 1058. At this distance 1′′ corresponds to 48.5 pc.
2 Data and Analysis
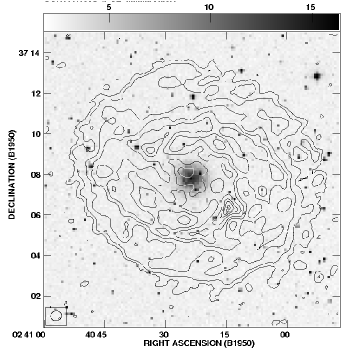
We have used archival HI data of NGC 1058 from the Very Large Array (VLA). The observations had been carried out on 14th June 1993 in the C configurations of the VLA. The data was downloaded from the VLA archive and reduced in the usual way using standard tasks in classic AIPS111NRAO Astrophysical Image Processing System, a commonly used software for radio data processing.. The HI emission from NGC 1058 spans 24 channels (i.e, channel 53 to channel 76) of the 127 channel spectral cube. We have used only the central channels (i.e, channel 57 to channel 72) with relatively strong HI emission. The frequency width of each channel corresponds to . The continuum from the galaxy was subtracted from the data in the uv plane using the AIPS task UVSUB. The resulting continuum subtracted data was used for the subsequent analysis. Figure 1 shows a total HI column density (Moment 0) map of NGC 1058 made from this data. The HI disk of the galaxy is nearly face-on. The angular extent of the HI distribution in Figure 1 is measured to be at a column density of , which is times it’s Holmberg diameter (Petric & Rupen, 2007).
Begum et al. (2006) and Dutta et al. (2009) contains a detailed discussion of the visibility based HI power spectrum estimator , hence we present only a brief discussion here. Here refers to a baseline, the antenna separation projected in the plane perpendicular to the direction of observation, measured in units of the observing wavelength . Note that, expressed this way is a dimensionless quantity. It is common practice to express in units of kilo wavelength (k). Every visibility is correlated with all other visibilities within a disk , where is the angular extent of the galaxy. The correlations are averaged over different directions assuming that the signal is statistically isotropic in the plane of the galaxy’s image . To increase the signal to noise ratio we further average the correlations in bins of and over all frequency channels with HI emission. The expectation value of the estimator is real, and it is the convolution of the HI power spectrum with a window function . The window function quantifies the effect of the large-scale HI distribution and the finite angular extent of the galaxy, and it can be assumed to be sharply peaked around with a width of order . At baselines the function is well approximated by a Dirac delta function and the expectation value of gives an estimate of the HI power spectrum . The effect of in estimating the power spectrum and the considerations for determining is discussed in detail in Dutta et al. (2009).
The error-bars for the estimated power spectrum is a sum, in quadrature, of contributions from two sources of uncertainty. At small the uncertainty is dominated by the sample variance which comes from the fact that we have a finite and limited number of independent estimates of the true power spectrum. At large , it is dominated by the system noise in each visibility.
To determine if the slope of the HI power spectrum changes with the width of the frequency channel, we have combined successive channels to obtain a data set with channels of width each. We have determined the HI power spectrum for a range of values.
3 Results and Discussion
Figure 2 shows the real and imaginary parts of , which is the observed value of the estimator . As expected from the theoretical considerations (Begum et al. 2006), the imaginary part is well suppressed compared to the real part. To test for a possible contribution from residual continuum, we also show the real part of estimated using line free channels. This is found to be much smaller than the signal. For the channels with HI emission, the observed may be directly interpreted as the HI power spectrum at values that are considerably larger than .
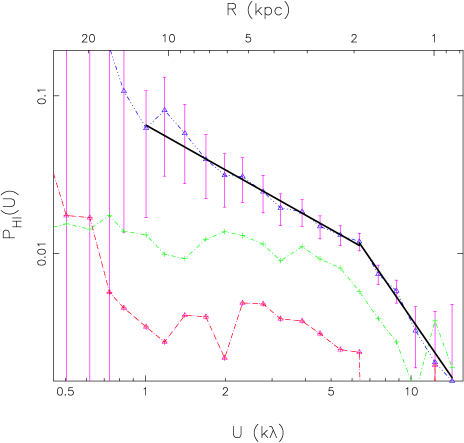
The power spectrum is well fitted by two different power laws , one with for to (large length-scales) and another with for to (small length scales). The results are tabulated in Table 1. The best-fit power-law were determined by a minimization with respect to the amplitude, A and the power-law index, (Begum et al. 2006). The error-bar on , the parameter of interest here, is determined by projecting the ellipse corresponding to onto the axis in the parameter space (page 694 of Press et al. (1992)).
Both HI density fluctuations as well as spatial fluctuations in the velocity of the HI gas contribute to fluctuations in the HI specific intensity. Considering a turbulent ISM, Lazarian & Pogosyan (2000) have shown that it is possible to disentangle these two contributions by studying the behavior of the HI power spectrum as the thickness of the frequency channel is varied. The slope of the HI power spectrum is expected to change with the frequency channel thickness if it is due to the gas velocities, However, Begum et al. (2006), Dutta et al. (2008) and Dutta et al. (2009) do not find this change for any of the galaxies in their sample of spiral and dwarf galaxies. Further, Elmegreen et al. (2001) also reported a similar behavior for LMC. We find that the HI power spectrum of NGC 1058 does not exhibit a statistically significant change with increase of the channel thickness (Table 1), indicating that the observed power spectrum is due to HI density fluctuations.
| Baseline Range | N | ||
|---|---|---|---|
| (k) | (km s-1) | ||
| 1 | 2.68 | ||
| 8 | 21.44 | ||
| 16 | 42.88 | ||
| 1 | 2.68 | ||
| 8 | 21.44 | ||
| 16 | 42.88 |
A baseline corresponds to an angular scale of in the plane of the sky. In the subsequent discussion, we use (distance to the galaxy) to convert the baseline to a length-scale in the plane of the galaxy’s image. We find that the slope of the power spectrum of NGC 1058 is at small length-scales () whereas it is at large length-scales ( ). The largest length-scale () is definitely larger than the typical HI scale heights within the Milky-Way (Lockman et al., 1984; Wouterloot et al., 1990) and in external spiral galaxies (e.g. Narayan & Jog 2002). It is then quite reasonable to conclude that the slope is that of 2D turbulence in the plane of the galaxy’s disk. Simulations of the power spectrum of HI emission from a face-on disk galaxy (Dutta et al., 2009) predict a change in the slope corresponding to a transition from 2D to 3D turbulence. This is expected to occur at a baseline , where is the galaxy’s scale-height. Interpreting the change in the slope of the observed power spectrum seen at as the transition from 2D to 3D turbulence, we find the scale-heigth of NGC 1058 to be . Further, we interpret the slope of to be that of 3D turbulence. To our knowledge this is the first observational determination of the scale-height of a nearly face on spiral galaxy through its HI power spectrum. The width of the bin , corresponding to the baseline where the break occurs, gives an estimate of the uncertainty in the estimated scale-height as , whereby we have . Kregel et al. (2004) present HI images of a large sample of edge on intermediate to late type spirals; from their data the ratio of the HI disk height to the radius of the HI disk (at a column density of 1pc-2) is . Since the disk of NGC 1058 has a diameter of (Figure 1) at this column density, we expect it’s scale-height to be , in excess of our result. Note that the HI scale-height is known to increase with the distance from the center, and our result is an average value over the entire disk with possibly a larger contribution from the inner parts where the emission is strongest.
A similar behavior of a change in the slope of the power spectrum at larger length scales has been also observed in LMC (Elmegreen et al. 2001). The HI power spectrum of the LMC flattens at large length-scales, which was interpreted as a transition from three-dimensional to two-dimensional turbulence. Using this method the scale-height of LMC was found to be 100 pc (Elmegreen et al. 2001). It is well known (eg. Elmegreen & Scalo 2004) that the slope of the velocity power spectrum changes by unity from to in going from 3D to 2D for incompressible Kolmogorov turbulence (Kolmogorov, 1941). This may be related to the change in slope from to measured in NGC 1058, though the turbulence here is compressible and the observations are those of density fluctuations and not the velocity. The relation between the power spectrum of density fluctuations and the velocity power spectrum is not very clear for compressible turbulence.
There is now mounting evidence that spiral galaxies exhibit scale-invariant density fluctuations that extend to length-scales of (eg. NGC 628, NGC 1058) which is comparable to the diameter of the HI disk. While a large variety of possible energy sources like proto-stellar winds, supernovae, shocks, etc. have been proposed to drive turbulence (Elmegreen & Scalo, 2004), it is still to be seen whether these are effective on length-scales as large as .
It is interesting to note that a break in the power spectrum, like the one seen here for NGC 1058, has also been observed in the shell-type supernovae remnant Cassiopeia A (Roy et al., 2008). The slope of the power spectrum changes from at (large length-scales) to at (short length-scales). This change in the slope is interpreted as a transition from 2D to 3D magneto hydrodynamic turbulence. The transition occurs at a length-scale of which corresponds to the thickness of the shell.
Acknowledgments
P.D. is thank full to Sk. Saiyad Ali, Kanan Datta, Tapomoy Guha Sarkar, Suman Majumder, Abhik Ghosh and Prakash Sarkar for use full discussions. P.D. would like to acknowledge SRIC, IIT, Kharagpur for providing financial support. S.B. would like to acknowledge financial support from BRNS, DAE through the project 2007/37/11/BRNS/357. The data presented in this paper were obtained from the National Radio Astronomy Observatory (NRAO) data archive. The NRAO is a facility of the US National Science Foundation operated under cooperative agreement by Associated Universities, Inc.
References
- Begum et al. (2006) Begum, A., Chengalur, J. N., & Bhardwaj, S. 2006, MNRAS, 372, L33
- Boroson (1981) Boroson, T. 1981, ApJS, 46, 177
- Crovisier & Dickey (1983) Crovisier, J., & Dickey, J. M. 1983, A&A, 122, 282
- Deshpande et al. (2000) Deshpande, A. A., Dwarakanath, K. S., & Goss, W. M. 2000, ApJ, 543, 227
- Dutta et al. (2008) Dutta, P., Begum, A., Bharadwaj, S., & Chengalur, J. N. 2008,MNRAS, 384, L34
- Dutta et al. (2009) Dutta, P., Begum, A., Bharadwaj, S., & Chengalur, J. N. 2009, (Submitted, MNRAS)
- Elmegreen et al. (2001) Elmegreen, B. G., Kim, S., & Staveley-Smith, L. 2001, ApJ, 548, 749
- Elmegreen & Scalo (2004) Elmegreen, B. G., & Scalo, J. 2004, ARA&A, 42, 211
- Green (1993) Green, D. A. 1993, MNRAS, 262, 327
- Kolmogorov (1941) Kolmogorov, A. 1941, Akademiia Nauk SSSR Doklady, 30, 301
- Kregel et al. (2004) Kregel M., van der Kruit P. C., de Blok W. J. G., 2004, MNRAS, 352, 768
- Lazarian & Pogosyan (2000) Lazarian, A., & Pogosyan, D. 2000, ApJ, 537, 720
- Lockman et al. (1984) Lockman, F. J., Hobbs, L. M., & Shull, J. M. 1984, BAAS, 16, 981
- Narayan & Jog (2002) Narayan, C.A. & Jog, C.J. 2002, A&A, 390, 35
- Padoan et al. (2001) Padoan, P., Kim, S., Goodman, A., & Staveley-Smith, L. 2001, ApJL, 555, L33
- Petric & Rupen (2007) Petric, A. O., & Rupen, M. P. 2007, AJ, 134, 1952
- Press et al. (1992) Press, W. H., Teukolsky, S. A., Vetterling, W. T., & Flannery, B. P. 1992, Numerical Recipes in C, Cambridge University Press
- Roy et al. (2008) Roy, N., Bharadwaj, S., Dutta, P., & Chengalur, J. N. 2008,MNRAS, 393L,26
- Sandage & Tammann (1974) Sandage, A., & Tammann, G. A. 1974, ApJ, 194, 559
- Scalo & Elmegreen (2004) Scalo, J., & Elmegreen, B. G. 2004, ARA&A, 42, 275
- Stanimirovic et al. (1999) Stanimirovic, S., Staveley-Smith, L., Dickey, J. M., Sault, R. J., & Snowden, S. L. 1999, MNRAS, 302, 417
- Westpfahl et al. (1999) Westpfahl, D. J., Coleman, P. H., Alexander, J., & Tongue, T. 1999, AJ, 117, 868
- Stutzki et al. (1998) Stutzki, J., Bensch, F., Heithausen, A., Ossenkopf, V., & Zielinsky, M. 1998, A&A, 336, 697
- Willett et al. (2005) Willett, K. W., Elmegreen, B. G., & Hunter, D. A. 2005, AJ, 129, 2186
- Wouterloot et al. (1990) Wouterloot, J. G. A., Brand, J., Burton, W. & Kwee, K. K. 1990, A&A, 230, 21