Soft phonon columns on the edge of the Brillouin zone in the relaxor PbMg1/3Nb2/3O3
Abstract
We report lattice dynamical measurements, made using neutron inelastic scattering methods, of the relaxor perovskite PbMg1/3Nb2/3O3 (PMN) at momentum transfers near the edge of the Brillouin zone. Unusual“columns” of phonon scattering that are localized in momentum, but extended in energy, are seen at both high-symmetry points along the zone edge: and . These columns soften at 400 K which is similar to the onset temperature of the zone-center diffuse scattering, indicating a competition between ferroelectric and antiferroelectric distortions. We propose a model for the atomic displacements associated with these phonon modes that is based on a combination of structure factors and group theoretical analysis. This analysis suggests that the scattering is not from tilt modes (rotational modes of oxygen octahedra), but from zone-boundary optic modes that are associated with the displacement of Pb2+ and O2- ions. Whereas similar columns of scattering have been reported in metallic and (less commonly) molecular systems, they are unusual in insulating materials, particularly in ferroelectrics; therefore, the physical origin of this inelastic feature in PMN is unknown. We speculate that the underlying disorder contributes to this unique anomaly.
pacs:
77.80.-e, 61.10.Nz, 77.84.DyI Introduction
The lead-based, relaxor ferroelectrics are chemically disordered compounds that have attracted considerable scientific interest due to their remarkable structural, dynamical, and electromechanical properties. Ye98:81 ; Bokov_rev ; Hirota06:11 PbMg1/3Nb2/3O3 (PMN) and PbZn1/3Nb2/3O3 (PZN) are two of the most widely studied compounds, and both display the broad, frequency-dependent peak in the dielectric response as a function of temperature that is characteristic of relaxors. Viehland90:68 Surprisingly, even though both possess unusually large dielectric susceptibilities ( 25,000), neither PMN nor PZN exhibits a well-defined structural transition, and thus no ferroelectricity, in zero electric field. Bonneau89:24 ; Mathan91:3 ; Xu04:70 When diluted with sufficient amounts of PbTiO3 (PT), which is a conventional ferroelectric, a long-range ferroelectric ground state is established and the piezoelectric coefficients grow to record-setting levels, making these materials prime candidates for industrial applications. But beyond a certain concentration of PbTiO3, which defines the Morphotropic Phase Boundary (MPB) that separates the low-concentration monoclinic phase from the high-concentration tetragonal phase, the piezoelectric coefficients drop precipitously. Park97:82 ; Liu99:85 ; Kiat02:65 Whereas different ideas have been proposed to explain these effects, no consensus exists on the origin of the exceptional piezoelectric properties.
The static properties of relaxors are highly unusual. A structural distortion was observed in single-crystal PZN using low-energy x-ray diffraction techniques, Lebon but this was subsequently shown to be confined to a near-surface region of the crystal by another diffraction study that employed higher-energy x-rays. Xu03:67 This localized structural distortion, known as the “skin effect,” is enhanced by strong electric fields and has been confirmed using neutron strain-scanning techniques in other PZN- and PMN-based compounds. Conlon04:70 ; Xu06:79 ; Stock07:unpub ; Gehring04:16 Despite the absence of a bulk ferroelectric ground state in either PMN or PZN, evidence of static, short-range, polar correlations has been inferred from measurements of the optic index of refraction Burns83:48 and by the presence of temperature-dependent diffuse scattering that is centered on the Bragg peaks. Naberezhnov The refraction measurements have been interpreted in terms of local, nanometer-scale regions of randomly oriented ferroelectric order, often termed polar nanoregions (PNR), which form below the Burns temperature, , which is nominally 620 K in PMN. Burns83:48 Various models of the diffuse scattering and low-energy phonons have been proposed; however, all models associate the diffuse scattering with the formation of polar nanoregions in PMN and PZN, because both appear at the temperature . You97:79 ; Hirota02:65 ; Welberry05:38 ; Vug06:73 For PT-concentrations beyond the MPB, no diffuse scattering is observed. As this coincides with the precipitous drop in the size of the piezoelectric coefficients, the presence of substantial elastic diffuse scattering near the zone center is associated with the relaxor effect. Hiraka04:70 ; Matsuura06:74
Whereas this diffuse scattering represents a definitive, static signature of relaxors, extensive research has yet to identify a well-defined dynamical property that is uniquely associated with relaxor behavior. Being chemically disordered solids, the lattice dynamics of PMN and PZN are quite complex. Nevertheless, important similarities exist between the two compounds. Like the parent material PbTiO3, which is a soft-mode (displacive) ferroelectric, both PMN and PZN exhibit phonon spectra near the zone center that are dominated by a soft transverse optic (TO) mode that reaches a minimum frequency on cooling and then hardens at lower temperatures. Gehring01:87 ; Naberezhnov ; Wakimoto02:65 ; Stock04:69 ; Gvasaliya04:69 ; Gvasaliya05:17 Concurrent with the decrease in frequency, the linewidth of this mode broadens in energy until it becomes heavily damped, but only for wave vectors near the zone center. This anomalous temperature- and wave vector-dependent damping produces a false, dispersion-like feature known as the “waterfall,” which has been observed in PMN, PZN, and other relaxor compounds. Gehring_Aspen ; Gehring_pzn Early studies speculated that the phonon damping resulted from a strong interaction between the soft mode and the PNR. Gehring_pzn8pt Since then, however, the origin of the waterfall effect has been a topic of considerable debate. Hlinka03:91 ; Hlinka08:81 ; Vak02:66 There is now strong evidence that refutes the idea that the waterfall effect is caused by TO-PNR coupling. Low-frequency phonon studies of PMN mixed with 60% PbTiO3 (PMN-60PT), a composition that is not a relaxor and that displays a long-range, first-order, cubic–tetragonal phase transition, have found a waterfall feature very similar to that seen in PMN. Stock06:73 Attempts to find a waterfall in the K(Ta1-xLix)O3 relaxor system have not been successful. Wakimoto06:74 Thus, the heavily damped soft mode is not a defining characteristic of relaxors, and its existence does not require the presence of PNR. Instead, the waterfall feature probably results from another form of strong disorder common to both relaxor and non-relaxor ferroelectrics. A dynamic feature that is very probably associated with the PNR (i.e., with the diffuse scattering), and thus the relaxor phenomenon, is the strong damping of the low-energy transverse acoustic phonons. This damping was recently reported to have a strong dependence on the electric field and is absent in PMN-PT compositions that lie beyond the MPB. Stock05:74 ; Xu08:unpub
No signature of the relaxor phase has yet been identified from studies of the zone-center soft optic mode, although it was recently suggested that the MPB begins at that PT concentration where the structural transition temperature matches the temperature at which the zone-center soft phonon mode reaches a minimum. Cao08:78 The existence of the two temperature scales in the relaxor phase has been explained by random field theories. Stock04:69 ; Fisch03:67 ; Westphal92:68 Finding such a feature in PMN is extremely important because, as is the case with soft modes in conventional ferroelectrics, a unique dynamical signature can provide information on the underlying structural distortions that are specific to the relaxor state. In view of the similarities of the zone-center soft mode dynamics throughout the relaxor-ferroelectric phase diagram, such as the waterfall effect, we believe it is necessary to search other regions of the Brillouin zone for a dynamic signature that is unique to relaxors.
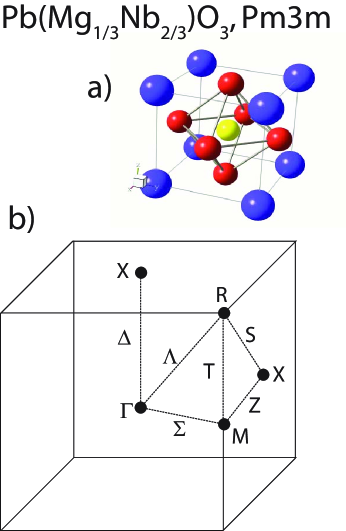
In comparison to the zone center, little experimental attention has been paid to the zone boundary of relaxor ferroelectrics, but intriguing temperature-dependent superlattice peaks have been observed in PMN using TEM and x-ray diffraction techniques at the reciprocal lattice vectors and . Hilton ; Vakhrushev_ZB ; Tkachuk ; Tkachuk2 Being zone boundary locations these would seem unlikely to be associated with the relaxor transition, as any softening would be indicative of antiferroelectric, rather than ferroelectric, distortions. However, it has been suggested theoretically that both ferroelectric and antiferroelectric distortions can coexist, and such a concept has been applied to the case of SrTiO3 in Ref. Zong95:74, . The average, long-range structure of the cubic phase of PMN is illustrated in Fig. 1, as are the high-symmetry positions of the associated Brillouin zone. There are two high-symmetry points along the edge of the Brillouin zone: , and . In this paper we report the presence of soft phonons at both of these high-symmetry points in PMN. Unlike the highly damped TO phonons measured near the zone center, the zone-boundary points display vertical columns of phonon scattering that are especially strong at , and these appear at a temperature that coincides with the appearance of diffuse scattering at the zone center. Such columns of inelastic scattering are very unusual in insulators, and their ultimate origin remains unknown at this time. We focus only on the soft phonons in this study and do not deal directly with the full complexity of the elastic diffuse scattering near the zone boundaries reported elsewhere. Gosula00:61
This paper is divided into three sections. The first section provides the experiment details of the measurements conducted at the respective neutron scattering facilities located at the National Institute of Standards and Technology Center for Neutron Research (NCNR) and Canadian Neutron Beam Centre at the Chalk River Laboratories. The second section deals with the static properties of PMN, in particular the temperature dependence of the elastic scattering measured at the zone boundary. The third section describes the inelastic measurements showing the presence of a temperature-dependent column of scattering that is associated with the temperature-dependent elastic diffuse scattering. We compare these results to other systems and, in particular, to PMN-60PT, which is not a relaxor, but undergoes a long-range, cooperative cubic–tetragonal transition, similar to that occuring in the parent material PbTiO3. Shirane70:2a
II Experimental Details
The measurements described in this paper are based on two single crystals with volumes of 3 cc and 9 cc. Both samples were grown using the Bridgeman technique described elsewhere. Luo00:39 The large 9 cc sample is the same crystal that was used in a previous phonon study. Stock05:74 Both samples have a room temperature lattice constant Å; thus one reciprocal lattice unit (1 rlu) equals Å-1.
Neutron inelastic scattering experiments were carried out on the time-of-flight Disk Chopper Spectrometer (DCS, NCNR), the SPINS cold neutron triple-axis spectrometer (NCNR) and the C5 and N5 thermal neutron triple-axis spectrometers (Chalk River). The experiments conducted at both the N5 and C5 thermal triple-axis spectrometers used a cryofurnace to vary and control the sample temperature between 10 K and 600 K. Experiments conducted on the DCS and SPINS instruments employed a high-temperature displex over a similar temperature range. To prevent any possible decomposition, the sample was never heated beyond 600 K and neither sample was ever exposed to an electric field at any temperature. Next we describe the experimental setups used for the various neutron scattering measurements on each instrument. All uncertainties (error bars) shown in the figures in this paper correspond to the square root of the measured neutron intensity.
II.1 Triple-axis Spectrometers (C5, N5, and SPINS)
Measurements on the C5 thermal triple-axis spectrometer were made with a variable-focusing (002) pyrolytic graphite (PG) monochromator and a flat PG (002) analyzer. The horizontal angular beam collimation sequence was set to either 12’-33’--29’-72’ or 33’(open)-33’--29’-72’ ( Sample), and a fixed, final neutron energy meV was used to define the energy transfer as . A PG filter was placed after the sample to remove neutrons scattering from higher order reflections of the monochromator and a sapphire filter was placed before the monochromator to remove high-energy, “fast” neutrons. The instrumental elastic energy resolution, defined as the full width at half maximum (FWHM) of the elastic () peak, was 0.9 meV for both collimation sequences. The sample was aligned in the (HK0), (HHL), and the (H3HL) scattering planes. The (HK0) plane allows a complete investigation of the zone center acoustic phonons as described in Ref. Stock05:74, . Through the use of the lower symmetry (H3HL) scattering plane, we are sensitive to the zone-boundary acoustic modes, which are tilt (or rotary modes) as outlined in Ref. Lynn78:27, .
Experiments conducted on N5 utilized both a flat PG (002) monochromator and analyzer. The final (scattered) neutron energy was fixed to meV, the collimation was set at 30’(open)-40’--40’-open, and a PG filter was placed after the sample. The instrumental elastic energy resolution was 1.3 meV FWHM. For these experiments the sample was aligned in the (HHL) scattering plane. We note that all of the inelastic data presented in this paper taken on triple-axis spectrometers have been corrected for contamination of the incident beam monitor as described elsewhere. Shirane:book
Measurements on SPINS used a vertically-focused PG (002) monochromator and a flat PG (002) analyzer. The final neutron energy was fixed to meV and the horizontal beam collimations were set to (guide)-80’-80’-(open) resulting in an instrumental elastic energy resolution of 0.25 meV FWHM. A liquid-nitrogen-cooled beryllium filter was placed after the sample to remove higher-order neutron contamination.
II.2 Disk Chopper Spectrometer (DCS)
Measurements on the Disk Chopper Spectrometer (DCS) were made at 40 different successive crystal orientations, spaced apart about a vertical axis, at 300 K and 600 K. The DCS instrument consists of 325 detectors in the horizontal scattering plane (or 913 including the out-of-plane detectors) with active dimensions in and normal to the scattering plane of 3.1 cm and 40 cm, respectively. For all data presented here, only the central detector bank was used. The detectors are located 4 m from the sample at scattering angles ranging from to . Further details of the instrument can be found elsewhere. Copley03:292 The incident energy was fixed at 6.0 meV and 10.4 meV for measurements made in the (HK0) and (HHL) scattering planes, respectively, resulting in instrumental elastic energy resolutions of 0.25 meV and 0.6 meV FWHM. The data were binned and visualized using the DCS MSLICE program. Qiu:mslice To obtain the energy positions and linewidths throughout the Brillouin zone, we fit the data to a linear combination of simple damped harmonic oscillators. This lineshape is described in detail elsewhere (Ref. Stock05:74, ; Stock06:73, ; Cowley73:6, ).
The DCS experiments were conducted on the neutron energy-gain side, where is negative, whereas the bulk of our triple-axis work was conducted on the neutron energy-loss side where is positive. The intensity of the scattering on the energy-gain side is related to that on the energy-loss side through detailed balance. Shirane:book Therefore, throughout this paper we retain the convention that energy transfer is defined by and indicate the energy transfer to be negative for data from DCS and positive for the bulk of our triple-axis work. This experimental setup provided good energy resolution near the elastic position (near ), which allowed us to measure the details of the low-energy acoustic and optic modes, and coarser energy resolution at larger negative energy transfers, where contamination from elastic scattering is not a concern.
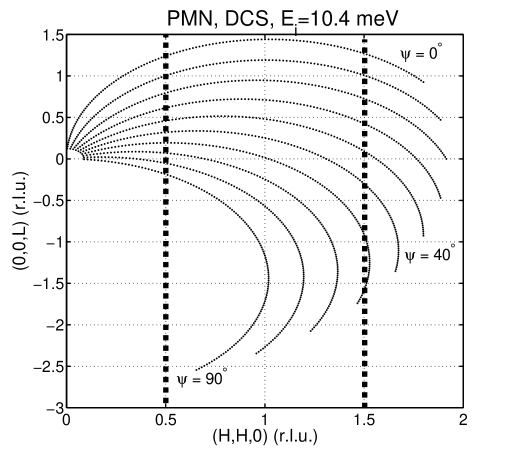
The use of a chopper instrument may seem like an unusual choice for study phonons which have dispersion in energy in all three directions of momentum. The use of DCS is different from that of a triple-axis as there are many more detectors whose position and scattering angle are fixed. By measuring the intensity at each detector as a function of time (and hence as a function of energy transfer), a trajectory in - space is obtained. To obtain a complete map of reciprocal space as a function of energy transfer, many successive crystal orientations need to be obtained. A summary of the momentum space coverage at a series of crystal orentations is illustrated Fig. 2. The angle is defined as the angle between the [001] axis of the crystal and the incident beam. Each line in the figure corresponds to a particular crystal orientation and it can be seen that by rotating the sample orientation with respect to the incident beam, an entire map of - space can be obtained. Throughout this paper, we have symmetrized the data around and plotted it in terms of positive values of L.
III Elastic Scattering
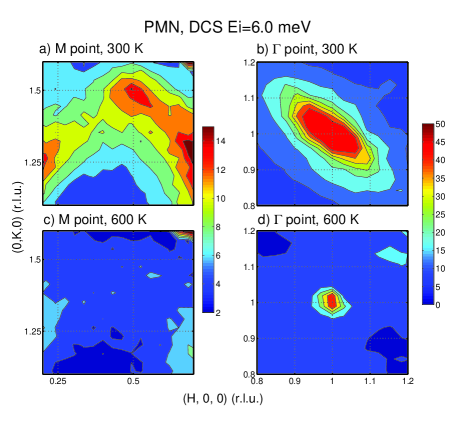
We first examine the elastic scattering measured near all three high-symmetry points on the zone boundary (, , and , as defined in Fig. 1). Figure 3 illustrates contour plots of the elastic intensity measured with the DCS instrument in the (HK0) scattering plane in the vicinity of the reciprocal lattice vectors and . At 600 K there is no observable scattering around , and the -point is characterized by a sharp Bragg peak. At 300 K strong diffuse scattering is seen near the -point with a lineshape in (the reduced wave vector, which is measured relative to the zone center in reciprocal lattice units) that is consistent with previous measurements. Hiraka04:70 A broad peak is also observed at the -point (Fig. 3) indicating a second type of structural instability. The fact that the scattering is not resolution-limited in at the -point indicates that any static correlations are short-range and thus do not correspond to a well-defined structural distortion: long-range correlations would result in a resolution-limited Bragg peak like that shown in Fig. 3).
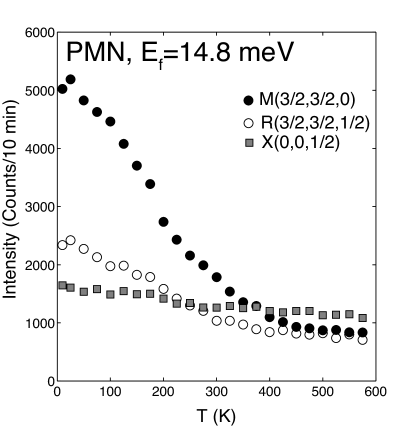
The temperature dependence of the zone boundary elastic scattering was studied on the N5 triple-axis spectrometer and is illustrated in Fig. 4. The intensity at the -point increases with decreasing temperature, but this growth matches the change in transmission through the crystal (measured with the straight through beam) and is otherwise featureless; thus it does not represent any intrinsic structural change. By contrast, the intensities measured at both the - and -points show a strong temperature dependence and a clear upturn near 400 K. These data are consistent with the available temperature-dependent x-ray data of Gosula et al. (Ref. Gosula00:61, ), except that we have extended the temperature range up to 600 K and show that the onset is near 400 K. The enhancement of the elastic scattering as a function of temperature at the - and -points is suggestive of incipient structural instabilities; however, it is also relatively smooth and is not associated with a sharp transition to a long-range, structurally distorted phase, which would result in a new Bragg peak. As the scattering is diffuse, these data infer the onset and subsequent growth of short-range, antiferrodistortive correlations below 400 K. This finding is significant because 400 K is the same temperature at which the zone-center TO mode reaches a minimum in energy Wakimoto02:65 and at which the strong, zone-center diffuse scattering, which is associated with the formation of static polar nanoregions, first appears. Hiraka04:70 Indeed, that the onset of zone center diffuse scattering occurs at 400 K in PMN motivated a very recent neutron scattering study of the Burns temperature using extremely sharp energy resolution and resulted in a reassessed value of TB = 420 K 20 K, roughly 200 K below the value identified by Burns and Dacol in 1983. Gehring_TB
Zone-boundary elastic scattering has been observed with neutrons and transmission electron spectroscopy in PbZr0.52Ti0.48O3 by Noheda et al., however, these superlattice peaks were determined to be from a minority domain with antiphase rotations of the oxygen octahedra about [111]. Noheda02:66 X-ray studies of both PMN and PSN (PbSc1/2Nb1/2O3) have also found evidence of diffuse scattering at the - and -points. Takesue99:82 ; Gosula00:61 PSN is unique as the perovskite site is occupied equally by Sc3+ and Nb5+ and, therefore, ordering on this site may be expected to induce at least short-range correlations at either the - or -points. The stoichiometry on the site of PMN does not allow such ordering, which means that short-range correlations at either or are not necessarily expected. Consequently, it is important to search for any phonon anomaly at the - and -points to determine the symmetry of the distortion, as well as to determine whether the elastic scattering originates in the bulk, and thus is an intrinsic effect, or whether it is limited to the surface or “skin” region and is influenced by strain or local compositional inhomogeneities.
IV Inelastic Scattering
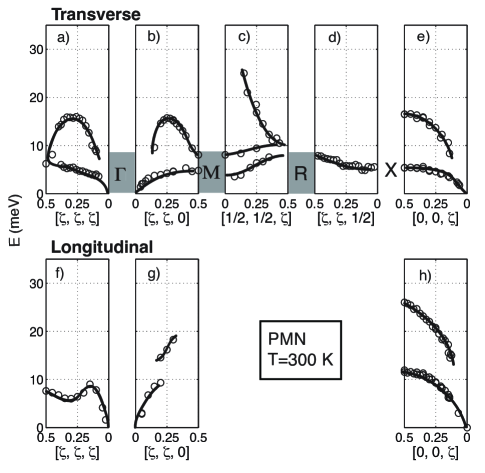
Phonon dispersion measured below 30 meV, for both transverse and longitudinal polarizations, are plotted in Fig. 5. These data are based on the experiments described in the previous section and represent a compilation of triple-axis and time-of-flight measurements. Previous experiments have focused on phonon branches that include the -point as well as on the temperature dependence of the soft transverse optic and acoustic modes. The data for those measurements are summarized at room temperature in panels a), b), and e) for modes propagating along the [111], [110], and [001] directions, respectively. Whereas we will not discuss the longitudinal scattering in detail in this paper, we summarize our current data set to define the energy scale of the phonon scattering in PMN in panels f), g), and h): the energy scale is similar to that reported for PbTiO3.
The dispersion curves reveal several possible incipient soft mode positions, these being where the optic modes reach a minimum energy as a function of reduced wave vector. Aside from the soft TO mode at the -point, which has been studied in detail by several groups, optic mode minima are seen at the - and -points; these minima correspond to the locations where strong, temperature-dependent elastic scattering was observed, as described in the previous section. In this paper we concentrate on the phonons and the dispersion curves along the -line, which is the zone-boundary edge that links the high-symmetry - and -points (see Fig. 5 c)). We next describe the temperature and wave vector dependence of the soft modes, and we assign these to specific optic modes based on our measurements conducted with time-of-flight and triple-axis spectrometers. More importantly, we show that these soft modes cannot be the tilt instabilities in cubic perovskites, which are also associated with phonon instabilities at these same points along the edge of the Brillouin zone.
IV.1 DCS Time-of-Flight Spectra
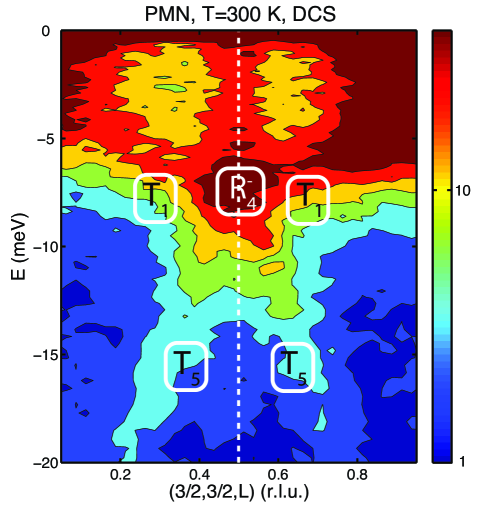
We summarize the unusual zone-boundary phonon scattering in Fig. 6, which displays DCS spectra reconstructed along the -line with and and at 600 K and 300 K. These color contour plots illustrate three key features regarding the nature of the lattice dynamics near the zone boundaries.
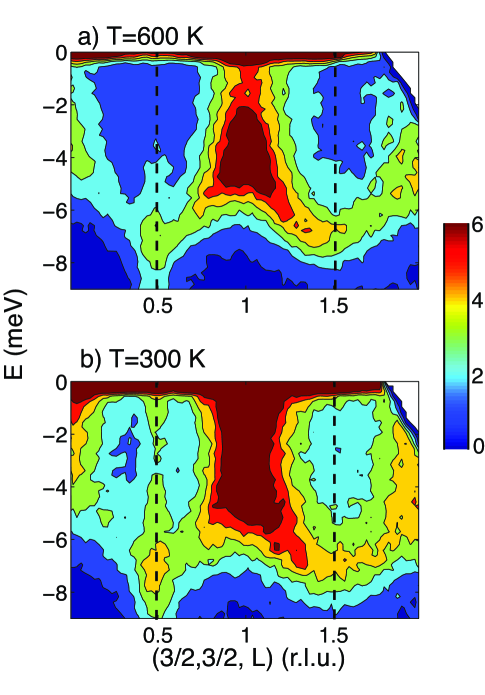
First, a soft mode is evident at the -point in PMN given the substantial increase in spectral weight that occurs at low energies upon cooling from 600 K to 300 K, which results in the column of scattering shown at in Fig. 6. At 600 K (panel a)) the data show the presence of a broad mode centered near 4 meV. At 300 K (panel b)) this mode softens considerably on cooling, extending all the way to the elastic position, but it does so in such a way that it essentially becomes a continuum of scattering over energy transfers from 0–5 meV.
Second, another soft phonon is observed at the -point . At 300 K there is evidence of a column, but it is far weaker and much narrower in momentum than that at . This column appears to extend down to the elastic position clearly at 300 K. It is also important to note the absence of any column at . We attribute this to the phonon structure factor, and we use this observation later when assigning the symmetries to the incipient soft modes at and .
A third feature, which is common to both the - and -points, is that the strong softening of these zone-boundary modes has an unusual dispersion that is localized in momentum but broad in energy, which is what gives rise to the appearance of a column of scattering in - space. This feature is anomalous amongst the ferroelectrics and perovskites, where soft modes are usually described by a well-defined dispersion that is characterized by a single, temperature-dependent value of energy for a given momentum transfer, as seen near the -point in several studies of PbTiO3, PMN and PMN-60PT. Since the soft modes observed at both the - and -points exhibit a continuum of energies at these specific momentum transfers, they cannot be understood by such a well-defined function.
IV.2 Triple-Axis Measurements at the - and -Points
To determine the origin of the inelastic scattering, understand the temperature dependence, and assign the soft mode to a particular symmetry, we have conducted a series of triple-axis experiments in the (HK0), (HHL), and (H3HL) scattering planes, each of which provides access to different types of phonon modes.
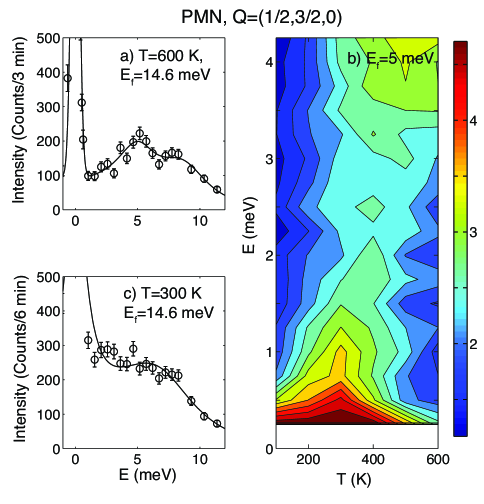
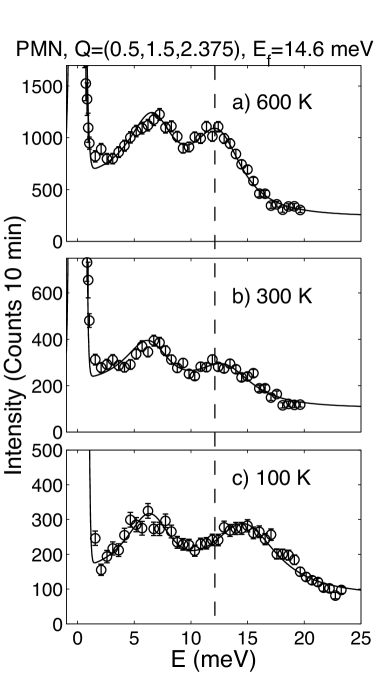
We first examine the -point phonons. Fig. 7 displays two constant- scans in which the scattered intensity was measured at a fixed momentum transfer = while scanning the energy transfer at 600 K (panel a)) and 300 K (panel c)). Whereas two well-defined modes are present at 600 K, the 300 K data show a broad distribution of scattering resembling a continuum that extends up to 7 meV. The lineshape used to fit these data is based on the sum of two damped, simple harmonic oscillators and has been described elsewhere. Stock05:74 Panel b) illustrates the evolution of the phonon scattering with temperature at through a color contour plot compiled from constant- scans measured from 10 K to 600 K. At high temperature little scattering is seen below 4 meV; at lower temperature (near 300 K) a clear continuum of scattering develops with intensity extending from 4 meV to the lowest energy transfer investigated. The large intensity below meV is attributed to pure elastic scattering that is sampled due to the energy resolution of 0.25 meV. For temperatures below 300 K, a decrease in the scattering is observed in the energy range 0–4 meV. This behavior is consistent with that of the soft mode observed near the -point and illustrates the transfer of spectral weight from the inelastic channel to the elastic channel, discussed in the previous section.
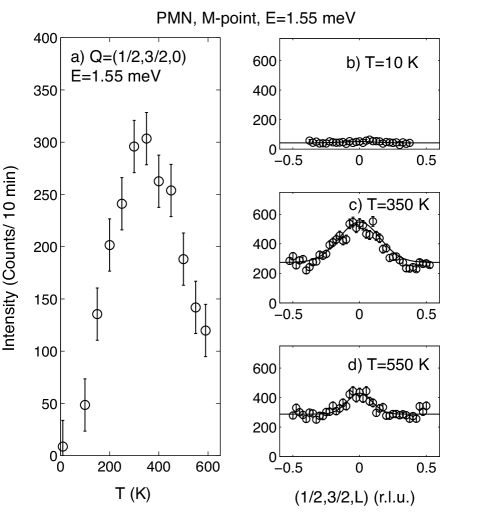
The temperature dependence of the -point inelastic scattering was characterized using constant-energy scans. This method was chosen over the conventional constant- method because the column is a spectral feature that is well defined in momentum, but broad in energy. Therefore, a scan of momentum transfer , at a fixed energy , will result in a well-defined peak centered at the zone boundary.
Fig. 8 illustrates constant energy scans measured at meV over 10 K to 600 K. The data were taken on the C5 triple-axis spectrometer using a fixed final neutron energy meV. Panel a) summarizes the peak intensity, taken as the amplitude of a Gaussian fit to the correlated scattering in momentum across the -point, as a function of temperature. On cooling, the intensity at 1.55 meV increases, peaks at K, and rapidly declines, becoming nearly unobservable by 10 K. Examples of the fits at several temperatures are illustrated in panels b)-d).
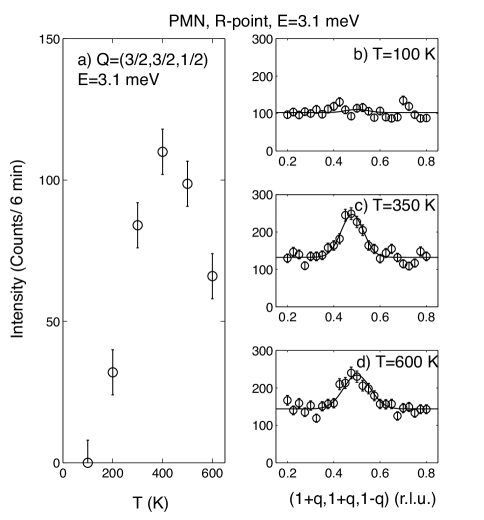
Whereas our preceding discussion has focused around the -point, the - data taken on DCS reveal a second column at the -point. Fig. 9 shows constant-energy scans at meV. Panel a) shows the temperature dependence of the column. Panels b)–d) display representative constant-energy scans fit to Gaussian peaks centered at . The scattering at (Fig. 9) shows a temperature dependence on cooling nearly identical to that observed at (Fig. 8), reaching a maximum intensity at 400 K and declining at lower temperatures. The temperature dependence of the scattering observed at both and cannot be accounted for by the Bose factor alone; if this were the case, then the intensity at a fixed energy transfer would continue to grow with increasing temperature. Therefore, our results show that there are incipient soft modes at both and that reach a minimum frequency (hence giving maximum intensity along the energy column) at 400 K.
It is important to work out whether the soft modes at and are acoustic (tilts of the octahedra) or optic modes. It is difficult to answer this question using scans exactly at these high-symmetry points, where the soft modes form a broad continuum in energy. We therefore found it useful to conduct constant- scans at wave vectors slightly displaced from and , where the acoustic and optic modes could be resolved at all temperatures.
Constant- scans near the -point are presented in Fig. 10, where the solid line is the result of a fit to two damped harmonic oscillators. Two distinct modes are observed, with the lower-energy mode showing little temperature dependence while the higher-energy mode hardens upon cooling to 100 K. As this upper mode is temperature dependent, we associate the columns of scattering at the -point with this optic mode, and not the tilts. This point is confirmed directly using structure factors and group theory analysis in the final section of this paper. We have not pursued the temperature dependence of the frequencies at high temperatures (to observe the softening) due to the possibility of sample breakdown. This softening would require measurements over a very broad temperature range as the rate of softening with temperature is predicted, and has been observed in conventional ferroelectrics, to be much less than the rate of recovery at low temperatures.
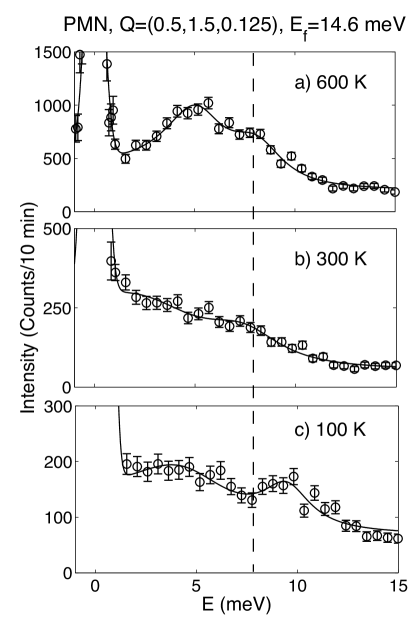
Similar scans were also conducted near and are presented in Fig. 11. The solid line in the figures is a fit to the sum of two damped harmonic oscillators. For scans at , which lies close to , two low-energy phonon modes could be clearly observed at 600 K (panel a) of Fig. 11). At 300 K (panel b)) only a continuum of scattering is observed, but a recovery of a higher energy branch is apparent at 100 K (panel c)), where the higher energy mode recovers to an energy transfer of meV. Whereas the interpretation of the low-energy scattering in these scans is ambiguous, because the -column is intense and distributed in momentum (see Fig.6) and there are several modes that may be close in energy (see Ref. Boyer81:24, ), these scans do show that there exists a higher-energy mode that is temperature dependent. This implies that an optic mode contributes strongly to the column of scattering at this wave vector. We rule out the contribution from zone-boundary acoustic, or tilt, modes through a discussion of structure factors and group theory presented later in the paper.
IV.3 Comparison with a “Conventional” Ferroelectric (PMN-60PT)
We now make a brief comparison with PMN-60PT, a conventional ferroelectric that undergoes a first-order, cubic–tetragonal transition at 540 K. The large concentration of PT places PMN-60PT beyond the MPB, which divides relaxor ferroelectrics, defined by broad temperature- and frequency-dependent peaks in the dielectric susceptibility, from conventional ferroelectrics, defined by sharp peaks in the dielectric susceptibility and well-defined structural transitions. The transition in PMN-60PT is driven by a soft TO mode and has been studied as a function of temperature. The soft TO mode is the same mode that softens in relaxors, such as PMN and PZN, and that possibly gives rise to the static diffuse scattering.
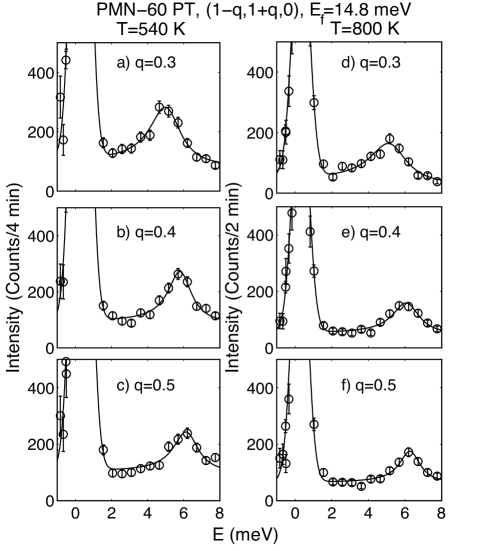
A summary of the phonon dispersion, measured in the (HK0) scattering plane, is illustrated in Fig. 12 for K (panels a)-c)) and K (panels d)-f)) near . At the zone boundary (panels c) and f)), a well-defined phonon mode is observed near 6 meV at both 800 K and 540 K. The phonon linewidth is smaller than the energy of the phonon and therefore the peaks represent underdamped propagating phonon modes. The phonon energy is unchanged within error on cooling from 800 K to 540 K, a temperature very near to the structural transition temperature. The phonon peaks are well defined and no column or continuum of scattering is observed near (). Constant- scans at (panels a) and d)) and at (panels b) and e)) show that, in contrast to PMN, well-defined phonon modes are observed. No continuum scattering has been reported in pure PbTiO3 (PT) and we therefore assume it to be absent as it is in PMN-60PT. Tomeno06:73
It seems likely that the soft columns at the high-symmetry points of the Brillouin zone edge are only present in the relaxor phase and possibly only for PT concentrations below the MPB. This will need to be verified through a study of several other lead-based relaxor ferroelectrics, particularly near the MPB concentration, which for PMN-PT is .
V Group Analysis
Having identified that the columns at and are the result of soft optic (not acoustic or tilt) modes, we now investigate which atoms contribute to these modes through the use of group theory and structure factors. The history of the lattice dynamical studies of perovskites is so long that various systems have been used to label the eigenmodes of the phonons, including a system used by Cowley, Cowley64:134 Miller and Love, Miller-Love and Bouckaert, Smoluchowski, and Wigner (BSW). BSW The translation between the labeling system of Cowley and BSW is given by Boyer. Boyer81:24 The established setting of the crystal in most lattice dynamical studies of perovskites is one where the octahedron sits in the center of the unit cell, centered on the Wyckoff -sites with O on the -sites, and Pb on the corner -sites (Fig. 1 a). This contrasts with most discussions of the structure and group theory underlying the tilt transitions in perovskites, in which, the octahedron conventionally sits on the corner of the unit cell. Howard-Stokes98 ; Howard-Stokes02 This difference in the cell setting causes the mode labels, even within the same labeling system, to change. In order to make a comparison to the majority of the lattice dynamics studies we use the former setting, typically used for dynamical studies. The decompositions were performed with SMODES,Isotropy and the compatibility relations were derived with the Isotropy Isotropy code. We calculated the structure factors based on the mode eigenvectors derived from Isotropy Isotropy and visualized them with Isodisplace. Isodisplace We use the labels of Miller and Love. Miller-Love
V.1 Mode Decomposition and Structure Factor Analysis
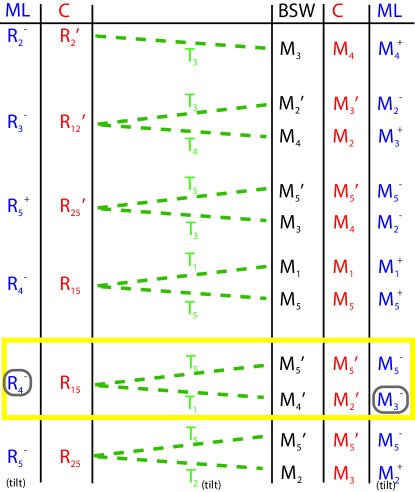
The Brillouin zone is shown in Fig. 1b, along with labels of high-symmetry points and lines, using the system of Miller and Love. Miller-Love The total decomposition of the atomic motions into irreducible representations was calculated at , , and and compared to that derived by Cowley. Cowley64:134 A compatibility diagram is shown in Fig. 13, which also relates our notation to those listed previously. To remove ambiguity as to which modes at are linked to those at , published, measured, and calculated dispersion curves of SrTiO3, Cowley64:134 RbCaF3, Boyer81:24 CaSiO3, Stixrude96:81 KNbO3, Yu95:74 PbTiO3, Garcia96:54 ; Tomeno06:73 BaTiO3, Shirane70:2 KTaO3, Perry89:39 KMnF3 Gesi72:5 and PbZrO3 Ghosez99 were consulted. There are relatively few -modes. A common feature of the low-frequency lattice dynamics of all the perovskites listed above is that the two lowest frequency -modes are and , whereas the highest frequency mode is . Owing to the number of modes at , there are fewer general observations that can be made about the spectra at this wave vector.
The -point is the corner of the Brillouin zone, which, being a cube, lies at the convergence of three zone edges (Fig. 1b). Therefore, in general, the -point irreducible representations are of higher dimensionality than those at ; on moving from to the loss of degeneracy means that, with the sole exception of the highest-frequency mode, each -mode splits into two -branches terminating in a single -mode. Fig. 14 plots contours of phonon intensity of the column near the -point at 300 K, based on data taken on the DCS instrument. The -axis is the direction, i.e., the -line denoted in Fig. 1b. The plot shows the soft mode at splitting into the two -branches: one low-energy mode that resides between 5–8 meV, and another mode that rises rapidly in energy to over 20 meV.
One famous feature of the low-frequency dynamics of perovskites is the tilt modes. Swainson05:61 All of the commensurate tilt structures of perovskites can be related to combinations of various dimensions of two zone-boundary acoustic modes at and . Howard-Stokes98 ; Howard-Stokes02 The -line that joins these points has also been shown to have tilt modes, GiddyA49:93 and the whole -- line has been observed to soften in some cases such as SrTiO3. Stirling72:5 The tilt mode at is , which splits into one low-frequency tilt mode, terminating in the tilt mode, and one non-tilt mode, which rises rapidly in frequency, terminating in a mode of symmetry (Fig. 13). Similarly, the low-frequency optic mode splits into the - and -branches, which terminate in and , respectively: there is, therefore, the potential for an anti-crossing (Fig. 13) of the -branches in the low-frequency dynamics, as is observed near in RbCaF3 Boyer81:24 and CaSiO3. Stixrude96:81 These represent the likeliest candidates to be observed in the lowest frequency part of the spectra. To avoid relying solely on these general observations, we have examined the structure factors of all the and modes so as not to exclude other possibilities.
The inelastic structure factor is given by the following formula for the m-th mode,
| (1) |
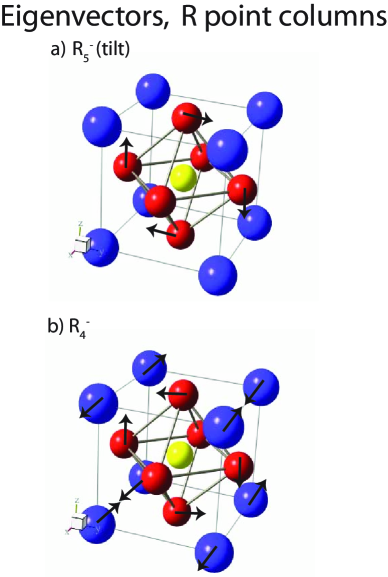
where is the total momentum transfer, is the eigenvector for the -th eigenmode, and is the position, the scattering length, and the mass of the -th atom. In this equation sums over all atoms in the unit cell.Harada70:26 Since we are working at a fixed temperature and for comparably small momentum transfers, we have ignored the Debye-Waller factor. Using this formula and the eigenvectors obtained from Isotropy,Isotropy we find that tilt distortions at , where we observe the strong column of scattering, have identically zero structure factor in the zones in which the DCS spectra were measured. Therefore, the modes contributing to the columns must instead be zone-boundary optics, i.e., dynamic antiferroelectric distortions.
By comparison with many other cubic perovskites, the likeliest next-lowest frequency optic mode at is (Fig. 13). This is particularly clear in the calculations of Garcia and Vanderbilt Garcia96:54 for PbTiO3 that have been confirmed experimentally by Tomeno et al. Tomeno06:73 In addition to the general observation about the order in frequency of modes at , calculations of the structure factors of -point phonons show that a single- structure of , in which Pb and O are displaced, can lead to near-zero neutron structure factors at those -points for which all indices are equal, as observed in our scattering data at , , etc.
Having assigned the -column based on a combination of group theory and structure factor analysis, and having eliminated the tilt modes from consideration, we now assign the displacements associated with the -column. As illustrated in Fig. 11, a single -branch appears to be interrupted by columns at the high-symmetry - and -points. As the -branch, due to anti-crossing, typically rises rapidly in energy in other perovskites, the symmetry of the -column is probably compatible with the -branch. Assuming this, we assign the symmetry of the -column phonon to . This conclusion is corroborated by structure factor calculations. We observe a soft phonon column at -points of all forms, including and . The inelastic structure factor of the phonon is finite at all positions and grows with increasing . The eigenvectors of consist only of displacements of Pb ions along the directions. We note that this conclusion is in agreement with calculations presented in Ref. Prosandeev04:70, , which predict a low energy phonon mode consisting of antiphase displacements of Pb.
VI Discussion
It is interesting to compare the lattice dynamics of relaxors to those of conventional ferroelectrics. Two notable features are present in PMN. The first is the “waterfall” effect, which is characterized by a broadening in energy of the low-energy TO mode for wave vectors near the zone center. This phonon anomaly is also present in PMN-60PT, which exhibits a sharp structural phase transition, and in relaxor ferroelectrics having PT concentrations below the critical concentration of 32, which defines the MPB. As the exceptional dielectric properties of relaxor ferroelectrics are absent in PMN-60PT, the “waterfall” effect cannot be linked to relaxor behavior. The second notable feature is the presence of columns of inelastic scattering observed at the - and -point zone boundaries in PMN. These columns exhibit a similar softening near 400 K, where strong diffuse scattering is onset (as shown in other experiments Hiraka04:70 ; Gehring_TB ), but they are not present in PMN-60PT. Therefore, whereas the zone-boundary soft phonons may not be the direct cause of the unique dielectric properties in PMN, they may be indirectly coupled and indicative of the underlying relaxor ferroelectricity.
There is no obvious physical reason for these columns of scattering. Similar columns have been observed in several other systems; examples include TTF-TCNQ (Ref. Shirane76:14, ), K2Pt(CN)4Br0.3 2.3 D2O (Ref. Shapiro76:14, ; Carneiro76:13, ), K0.3MoO3 (Ref. Pouget91:43, ), and body-centered cubic zirconium (Ref. Heiming91:43, ). In the above cases, the near vertical rod of phonon scattering has been attributed to a Kohn anomaly or a coupling between electronic and lattice degrees of freedom. Cowley06:75 Columns of scattering in insulators, where no such coupling can exist, are much rarer but have been observed in CaCO3 (Ref. Harris98:10, ) and KCN (Ref. Rowe78:40, ). Both of these systems display molecular rotations and the transitions are order-disorder in nature; here the columns were interpreted in terms of a coupling between molecular relaxational modes and harmonic lattice vibrations. Theories describing such coupling have been proposed by Michel and Naudts (Ref. Michel78:68, ) and similar models have been used by Shapiro et al. (Ref. Shapiro72:6, ) to describe the central peak in SrTiO3. Therefore, columns of scattering have been associated with a coupling of the lattice (harmonic degrees of freedom) with another degree of freedom (either electronic or molecular for the examples cited).
The soft phonon columns in PMN are therefore very unusual. The lineshape, which is localized in momentum but broad in energy, cannot be associated with an electronic process (such as a Kohn anomaly) as PMN is an insulator and therefore there is no Fermi surface. Nor can they be directly associated with a coupling to molecular rotations, as no such local molecular ions exist in the PMN structure. One possibility is of a local rattling of atoms, which is directly related to the disorder in PMN. The local disorder and random fields caused by the charge difference between Nb5+ and Mg2+ may introduce a number of local states that can be occupied (in analogy to molecular solids), to which the lone pair displacement of Pb2+ ions can couple. Such structures have been proposed to understand powder diffraction measurements in PZN (Ref. Iwase99:60, ) and PMN (Ref. Bonneau89:24, ) as well as NMR measurements (Ref. Blinc03:91, ). The role of Pb2+ ion displacements in the unusual piezoelectric properties was also proposed based on PDF analysis. Egami98:32 Therefore, as the same atoms can be on several sites in different unit cells, this may act as a means for a relaxational mode that can then couple to the harmonic modes at high energies. Columns are not observed in PMN-60PT, which lacks any temperature dependent zone-center or zone-boundary elastic diffuse scattering, but are present in PMN, where strong zone-boundary elastic diffuse scattering is present, inferring that static, short-range correlations are required for columns to form. The columns of scattering seem to represent a series of nearly degenerate states, which must be related to the formation of a non-zero polarization, as evidenced by the soft mode at the -point. The presence of several nearly degenerate states is also evident from the complex structural phase diagrams and properties observed as a function of PT-doping. Cao06:73 We note that this idea is completely heuristic, and thus it will be interesting if future calculations and theories can reproduce these columns.
The temperature dependence of the soft phonon columns and the fact that the softening occurs at nearly the same temperature as the minimum in the frequency of the zone-center TO mode and the onset of the diffuse scattering is strongly suggestive that the zone-boundary columns maybe a signature of the relaxor state. This is confirmed by the absence of of these columns in PMN-60PT, a well-defined ferroelectric. The only conclusive means of proving the direct connection with the relaxor state is a detailed study as a function of PT-concentration.
Our results point to an underlying antiferroelectric distortion in the relaxor PMN that competes with the ferroelectric distortion, characterized by strong, zone-center diffuse scattering and a soft optic mode. The presence of strong random fields and competing interactions provides an underlying physical reason for the glassy nature observed using dielectric measurements. How these competing interactions change with doping and, in particular, near the MPB will be a topic of interesting future study.
VII Conclusion
We have discovered the existence of very unusual soft modes in PMN at the and zone boundaries. The phonon modes have an anomalous dispersion, are localized in momentum, but broad in energy resulting in a column of scattering. The columns of scatter is present in PMN (a relaxor ferroelectric) are absent in PMN-60PT (a well-defined ferroelectric). The physical origin of the unusual dispersion is not understood and cannot be accounted for by a coupling between electronic and lattice degrees of freedom, nor the presence of a molecular relaxational mode. The prevalence of many inequivalent local atomic sites may result in a relaxational mode, in analogy to order-disorder systems. It is possible that a strong coupling between zone-center and zone-boundary distortions may be a general component of relaxor ferroelectrics, which requires verification for further compositions on either side of the MPB.
Acknowledgements.
We thank R. Cowley, M. Gutmann, and J. Lynn for helpful discussions and B. Clow, T. Dodd, L. McEwan, R. Sammon, M. Watson and T. Whan for technical support during experiments. We acknowledge financial support from the Natural Science and Engineering Research Council of Canada (NSERC), DMR-9986442, and from the U.S. DOE under contract No. DE-AC02-98CH10886, and the Office of Naval Research under Grant No. N00014-99-1-0738. This work utilized facilities supported in part by the National Science Foundation under Agreement No. DMR-045467. Part of this work was also funded under the Graduate Supplement Scholarship program from the National Research Council (NRC) of Canada.References
- (1) Z.-G. Ye, Key Engineering Materials Vols. 155-156, 81 (1998).
- (2) A.A. Bokov and Z.-G. Ye, J. Mat. Science 41, 31 (2006).
- (3) K. Hirota, S. Wakimoto and D. E. Cox, J. Phys. Soc. Jpn. 11, 111006 (2006).
- (4) D. Viehland, S.J. Jang, and L.E. Cross, J. Appl. Phys. 68 2916 (1990).
- (5) P. Bonneau, P. Garnier, E. Husson, and A. Morell, Mat. Res. Bull, 24, 201 (1989).
- (6) N. de Mathan, E. Husson, G. Calvarin, J.R. Gavarri, A.W. Hewat, and A. Morell J. Phys: Condens Matter 3, 8159 (1991).
- (7) G. Xu, Z. Zhong, Y. Bing, Z.-G. Ye, C. Stock, and G. Shirane, Phys. Rev. B 70, 064107 (2004).
- (8) S.-E. Park and T.R Shrout, J. Appl. Phys. 82, 1804 (1997).
- (9) S.-F. Liu, S.-E. Park, T.R. Shrout, and L.E. Cross, J. Appl. Phys. 85, 2810 (1999).
- (10) J.-M. Kiat, Y. Uesu, B. Dkhil, M. Matsuda, C. Malibert, and G. Calvarin, Phys. Rev. B 65, 064106 (2002).
- (11) A. Lebon, H. Dammak, G. Calvarin, and I.O. Ahmedou, J. Phys.: Condens. Matter 14, 7035 (2002).
- (12) G. Xu, Z. Zhong, Y. Bing, Z.-G. Ye, C. Stock, and G. Shirane, Phys. Rev. B 67, 104102 (2003).
- (13) K. H. Conlon, H. Luo, D. Viehland, J.F. Li, T. Whan, J.H. Fox, C. Stock, and G. Shirane, Phys. Rev. B 70, 172204 (2004).
- (14) G. Xu, P. M. Gehring, C. Stock, and K. Conlon, Phase Transitions 79, 135 (2006).
- (15) C. Stock, Guangyong Xu, P. M. Gehring, H. Luo, X. Zhao, H. Cao, J. F. Li, D. Viehland, and G. Shirane, Phys. Rev. B 76, 064122 (2007).
- (16) P.M. Gehring, W. Chen, Z.-G. Ye, G. Shirane, J. Phys.: Condens. Matt. 16, 7113 (2004).
- (17) G. Burns and F.H. Dacol, Solid State Commun. 48, 853 (1983).
- (18) P.M. Gehring, S. Wakimoto, Z.-G. Ye, and G. Shirane, Phys. Rev. Lett. 87, 277601 (2001).
- (19) A. Naberezhnov, S. B. Vakhrushev, B. Dorner, and H. Moudden, Eur. Phys. J. B 11, 13 (1999).
- (20) H. You and Q.M. Zhang, Phys. Rev. Lett. 79, 3950(1997).
- (21) K. Hirota, Z.-G. Ye, S. Wakimoto, P.M. Gehring, and G. Shirane, Phys. Rev. B 65, 104105 (2002).
- (22) T.R. Welberry, M.J. Gutmann, H. Woo, D.J. Goossens, G. Xu, C. Stock, W. Chen, Z.-G. Ye, J. Appl. Cryst. 38, 639 (2005). T. R. Welberry, D. J. Goossens, and M. J. Gutmann Phys. Rev. B 74, 224108 (2006).
- (23) B.E. Vugmeister, Phys. Rev. B 73, 174117 (2006).
- (24) H. Hiraka, S.-H. Lee, P. M. Gehring, Guangyong Xu, and G. Shirane, Phys. Rev. B 70, 184105 (2004).
- (25) M. Matsuura, K. Hirota, P. M. Gehring, Z.-G. Ye, W. Chen, and G. Shirane, Phys. Rev. B 74, 144107 (2006).
- (26) S. Wakimoto, C. Stock, R.J. Birgeneau, Z.-G. Ye, W. Chen, W.J.L. Buyers, P.M. Gehring, and G. Shirane, Phys. Rev. B 65, 172105 (2002).
- (27) C. Stock, R. J. Birgeneau, S. Wakimoto, J. S. Gardner, W. Chen, Z.-G. Ye, and G. Shirane, Phys. Rev. B 69, 094104 (2004).
- (28) S.N. Gvasaliya, S.G. Lushnikov, and B. Roessli, Phys. Rev. B 69, 092105 (2004).
- (29) S.N. Gvasaliya, B. Roessli, R.A. Cowley, P. Huber, S.G. Lushnikov, J. Phys: Condens. Matt, 17, 4343 (2005).
- (30) P. M. Gehring, S. B. Vakhrushev, and G. Shirane, in Fundamental Physics of Ferroelectrics 2000: Aspen Center for Physics Winter Workshop, edited by R. E. Cohen, AIP Conf. Proc. No. 535 (AIP, New York, 2000), p. 314.
- (31) P. M. Gehring, S.-E. Park, and G. Shirane, Phys. Rev. B 63, 224109 (2001).
- (32) P. M. Gehring, S.-E. Park, and G. Shirane, Phys. Rev. Lett. 84, 5216 (2000).
- (33) J. Hlinka, S. Kamba, J. Petzelt, J. Kulda, C. A. Randall, and S. J. Zhang, Phys. Rev. Lett. 91, 107602 (2003).
- (34) J. Hlinka and M. Kempa, Phase Transitions, 81, 491 (2008).
- (35) S.B. Vakhrushev and S.M. Shapiro, Phys. Rev. B 66, 214101 (2002).
- (36) C. Stock, D. Ellis, I. P. Swainson, Guangyong Xu, H. Hiraka, Z. Zhong, H. Luo, X. Zhao, D. Viehland, R. J. Birgeneau, and G. Shirane, Phys. Rev. B 73, 064107 (2006).
- (37) S. Wakimoto, G.A. Samara, R.K. Grubbs, E.L. Venturini, L.A. Boatner, G. Xu, G. Shirane, S.-H. Lee, Phys. Rev. B. 74, 054101 (2006).
- (38) C. Stock, H. Luo, D. Viehland, J. F. Li, I. P. Swainson, R. J. Birgeneau and G. Shirane, J. Phys. Soc. Jpn. 74, 3002 (2005).
- (39) G. Xu, J. Wen, C. Stock, and P.M. Gehring, Nature Mat. 7, 562 (2008).
- (40) H. Cao, C. Stock, G. Xu, P.M. Gehring, J. Li, D. Viehland, Phys. Rev. B 78, 104103 (2008).
- (41) R. Fisch Phys. Rev. B 67, 094110 (2003).
- (42) V. Westphal, W. Kleemann, and M.D. Glinchuk, Phys. Rev. Lett. 68, 847 (1992).
- (43) A. D. Hilton, D. J. Barber, C. A. Randall, and T. R. Shrout, J. Mater. Sci. 25, 3461 (1990).
- (44) S. Vakhrushev, A. Naberezhnov, S. K. Sinha, Y.-P. Feng, and T. Egami, J. Phys. Chem. Solids 57, 1517 (1996).
- (45) A. Tkachuk and H. Chen in Fundamental Physics of Ferroelectrics 2003, edited by P. K. Davies and D. J. Singh, AIP Conf. Proc. No. 677 (AIP, New York, 2003), p. 55.
- (46) A. Tkachuk, P.M. Gehring, and H. Chen in Fundamental Physics of Ferroelectrics Workshop 2004, edited by R. Cohen and P.M. Gehring, Williamsburg Conf. Proc. (Washington, DC, 2004), p. 144
- (47) W. Zhong and D. Vanderbilt, Phys. Rev. Lett. 74, 2587 (1995).
- (48) V. Gosula, A. Tkachuk, K. Chung, and H. Chen, J. Phys. Chem. Solids 61, 221 (2000).
- (49) S. C. Miller, W. F. Love, Tables of Irreducible Representations of Space Groups and Co-Representations of Magnetic Space Groups, Pruett, Boulder, (1967).
- (50) G. Shirane, J.D. Axe, J. Harada, and J.P. Remeika, Phys. Rev. B 2, 155 (1970).
- (51) H. Luo, G. Xu, H. Xu, P. Wang and Z. Yin, Jpn. J. Appl. Phys. 39, 5581 (2000).
- (52) J.W. Lynn, H.H. Patterson, G. Shirane, and R.G. Wheeler, Sol. State. Commun. 27, 859 (1978).
- (53) G. Shirane, S. Shapiro, and J.M. Tranquada, Neutron Scattering with a Triple-Axis Spectrometer (Cambridge Press, 2002).
- (54) J.R.D. Copley and J.C. Cook, Chem. Phys. 292, 477 (2003).
- (55) Y. Qiu, DCS MSLICE (2006) and R. Coldea, MSLICE (2001).
- (56) R.A. Cowley, W.J.L. Buyers, P. Martel, and R.W.H. Stevenson, J. Phys. C 6, 2997 (1973).
- (57) P. M. Gehring, H. Hiraka, C. Stock, S.-H. Lee, W. Chen, Z.-G. Ye, D. P. Phelan, S. B. Vakhrushev, and Z. Chowdhuri, unpublished.
- (58) B. Noheda, L. Wu, and Y. Zhu, Phys. Rev. B 66, 060103(R) (2002).
- (59) N. Takesue Y. Fujii, and M. Ichihara, Phys. Rev. Lett. 82, 3709 (1999).
- (60) L.L. Boyer, J.R.Hardy Phys. Rev. B 24, 2577 (1981).
- (61) I. Tomeno, Y. Ishii, Y. Tsunodo, K. Oka, Phys.Rev. B 73, 064116 (2006).
- (62) R.A. Cowley, Phys. Rev. 134, A981 (1964).
- (63) L.P. Bouckaert, R. Smoluchowski, E. Wigner, Phys. Rev. 50, 58 (1936).
- (64) H. T. Stokes, D. M. Hatch, B. J. Campbell, (2007). ISOTROPY, stokes.byu.edu/isotropy.html.
- (65) B. J. Campbell, H. T. Stokes, D. E. Tanner, D. M. Hatch, J. Appl. Cryst. 39, 607-614 (2006).
- (66) L. Stixrude, R.E. Cohen, R. Yu, H. Krakauer. Amer. Mineral. 81, 1293 (1996).
- (67) R. Yu, H. Krakauer, Phys. Rev. Lett. 74, 4067 (1995).
- (68) A. Garcia, D. Vanderbilt, Phys. Rev. B 54, 3817 (1996).
- (69) G. Shirane, J.D. Axe, J. Harada, and A Linz, Phys. Rev. B 2, 3651 (1970).
- (70) C.H. Perry, R. Currat, H. Buhay, R.M. Migoni, W.G. Stirling, J.D. Axe, Phys. Rev. B 39, 8666 (1989).
- (71) K. Gesi, J.D. Axe, G. Shirane, and A. Linz, Phys. Rev. B 5, 1933 (1972).
- (72) Ph. Ghosez, E. Cockayne, U.V. Waghmare, and K. M. Rabe unpublished (cond-mat/9901246v2).
- (73) I.P. Swainson, Act. Cryst. B. 61, 616 (2005).
- (74) C. J. Howard and H. T. Stokes. Acta Cryst. B54, 782-789 (1998).
- (75) C. J. Howard and H. T. Stokes. Acta Cryst. B58, 565 (2002).
- (76) A.P. Giddy, M.T. Dove, G. S. Pawley, V. and Heine, Acta Cryst. A49, 697 703 (1993).
- (77) W.G. Stirling, J. Phys. C 5, 2711 (1972).
- (78) J. Harada, J.D. Axe, and G. Shirane, Acta Cryst. A26, 608 (1970).
- (79) S. A. Prosandeev, E. Cockayne, B. P. Burton, S. Kamba, J. Petzelt, Yu. Yuzyuk, R. S. Katiyar, and S. B. Vakhrushev, Phys. Rev. B 70, 134110 (2004).
- (80) G. Shirane, S.M. Shapiro, R. Comes, A.F. Garito, and A.J. Heeger, Phys. Rev. B 14, 2325 (1976).
- (81) S.M. Shapiro, M. Iizumi, and R. Shirane, Phys. Rev. B 14, 200 (1976).
- (82) K. Carneiro, G. Shirane, S.A. Werner, and S. Kaiser, Phys. Rev. B 13, 4258 (1976).
- (83) J.P. Pouget, B. Hennion, C. Escribe-Filippini, and M. Sato, Phys. Rev. B 43, 8421 (1991).
- (84) A. Heiming, W. Petry, J. Trampenau, M. Alba, C. Herzig, H. R. Schober, and G. Vogl, Phys. Rev. B 43, 10948 (1991).
- (85) R.A. Cowley and S. M. Shapiro, J. Phys. Soc. Jpn. 75, 111001 (2006).
- (86) M.J. Harris, M.T. Dove, I.P. Swainson, and M.E. Hagen, J. Phys: Condens. Matter 10, L423 (1998).
- (87) J.M. Rowe, J.J. Rush, N.J. Chesser, Phys. Rev. Lett. 40, 40, 455 (1978).
- (88) K.H. Michel and J. Naudts, J. Chem. Phys. 68, 1 (1978).
- (89) S.M. Shapiro, J.D. Axe, G. Shirane, and T. Riste, Phys. Rev. B 6, 4332 (1972).
- (90) T. Iwase, H. Tazawa, K. Fujishiro, Y. Uesu, Y. Yamada, J. Phys. Chem. Solids 60, 1419 (1999).
- (91) R. Blinc, V. Laguta, and B. Zalar, Phys. Rev. Lett. 92, 24601 (2003).
- (92) T. Egami, S. Teslic, W. Dmowski, P.K. Davies, L.-W. Chen, and H. Chen, J. Kor. Phys. Soc. 32, S935 (1998).
- (93) H.Cao, J. Li, D. Viehland, and G. Xu, Phys. Rev. B 73, 184110 (2006).
- (94) C. Stock, Guangyong Xu, P. M. Gehring, H. Luo, X. Zhao, H. Cao, J. F. Li, D. Viehland, and G. Shirane, Phys. Rev. B 76, 064122 (2007).