Rare Kaon Decays
Abstract
Recent results on charged rare kaon decays from the NA48/2 Collaboration and on neutral kaon decays from the KLOE Collaboration will be reviewed.
I Introduction
The results presented in this paper are mainly precision tests of Chiral Perturbation Theory (ChPT), with focus on radiative non-leptonic kaon decays from the NA48/2 and KLOE Collaborations. Semileptonic decays ( related), leptonic and LFV processes and future rare kaon decays experiments are covered by other talks in these proceedings.
II NA48/2 - Charged kaon decays
The NA48/2 experiment at CERN has taken data in 2003 and 2004 with the main purpose of searching for direct CP violation in the decays of charged kaons into three pions. However, the very high statistics collected, the world’s largest, has allowed to study many other decays and to measure their Branching Ratios (BR). In this paper I will fucus on radiative nonleptonic decays, that provide a crucial test of the ChPT ecker87 and can give information on the structure of hadronic interactions at low energy.
II.1 The NA48/2 experiment
Two simultaneous focused kaon beams of opposite charge, with a central momentum of 60 GeV/c and a momentum band of are produced by a 400 GeV proton beam impinging on a 40 cm Be target. The decay volume is a 114 m long vacuum tank; the final states are reconstructed by a magnetic spectrometer and a liquid krypton calorimeter (LKr). Charged particles are measured by the magnetic spectrometer, consisting of four drift chambers and a dipole magnet located between the second and the third chamber; the momentum resolution is (p in GeV/c). The magnetic spectrometer is followed by a scintillator hodoscope consisting of two planes segmented into horizontal and vertical strips and arranged in four quadrants (charged hodoscope). The electromagnetic Liquid Krypton calorimeter is an almost homogeneous ionization chamber with an active volume of and a thickness; the energy resolution is (E in GeV). The space resolution for single electromagnetic shower can be parametrized as cm (E in GeV). At a depth of inside the active volume of the calorimeter, a hodoscope consisting of a plane of scintillating fibres is installed (neutral hodoscope); the signals from the four quadrants are used to give a fast trigger.
A more detailed description of the detector can be found in batley06 .
II.2 The decay
The decay is a FCNC process induced at one-loop level in the Standard Model and highly suppressed by the GIM mechanism. The dynamics of the decay is completely specified by the invariant function , where is a kinematic variable. Several models have been developed predicting the form factors that characterize the decay rate and the dilepton invariant mass distribution. In the present analysis the following parametrizations of the form factors are considered:
-
•
Linear: , with free normalization and slope .
-
•
Next-to-Leading Order ChPT d'ambrosio98 : with free parameters and an explicitly calculated pion loop term .
-
•
A ChPT model developed by a group from Dubna dubnickova08 involving meson form factors , with meson masses treated as free parameters.
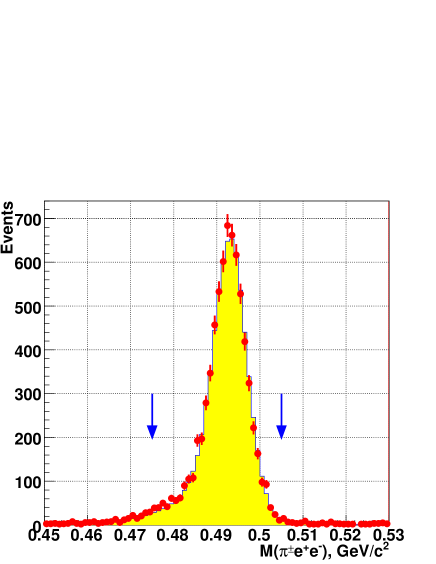
The aim of the analysis is to extract the form factor parameters in the framework of each of the above models and to measure the corresponding BR’s in the full kinematic range and, in addition, a model-independent BR in the visible kinematic range . The rate is measured relatively to (with ). Since the two decays contain the same charged particles in the final state, common selection criteria have been used, resulting in cancelation of particle ID inefficiencies at first order. At the end of the selection, based on the reconstruction of three-track events, a total of 7146 candidates with background are found in the signal region. The reconstructed invariant mass spectrum is shown in Fig. 1.
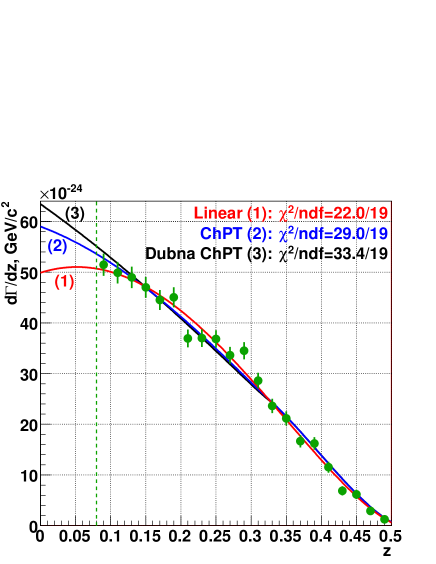
The computed values of vs are shown in Fig. 2 with the results of the fits to the three considered models; the measured parameters and the corresponding BR’s are presented in Table 1.
| 0.18 | |||||||||||
| 0.016 | |||||||||||
| 0.10 | |||||||||||
| 0.016 | |||||||||||
| 0.067 | |||||||||||
| 0.10 | |||||||||||
| 0.033 | |||||||||||
| 0.013 | |||||||||||
| 0.10 | |||||||||||
| 0.08 |
Fits to all the three models are of reasonable quality, however the linear form-factor model leads to the best (see Fig. 2). The data sample is insufficient to distinguish between the models considered. The BR in the full kinematic range, which includes an uncertainty due to extrapolation into the inaccessible region , is
This result is in fair agreement with previous measurements. In particular, comparison to the most precise BNL E865 result appel99 , dismissing correlated uncertainties due to external BR’s and model dependence and using the same external input, reveals a difference. The measurement of is in agreement with the previous measurements based on alliegro92 ; appel99 and ma00 samples, and further confirms the contradiction of the data to meson dominance models lichard99 . The measured , and are in agreement with the only previous measurement appel99 . The measured parameters and are a few % away from the nominal masses of the resonances pdg .
II.3 The decay
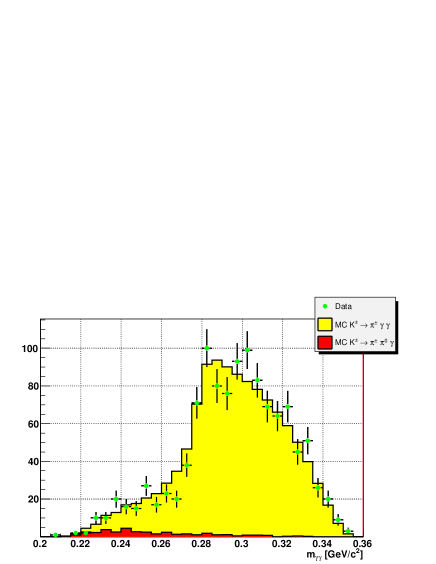
The contributions of the chiral lagrangian to this decay ecker88 appear at , where only the invariant amplitudes and ,with , contribute. The decay rate and the spectrum strongly depend on a single parameter predicted to be positive and . The invariant distribution is favored above and exibits a cusp at threshold. Calculations at d'ambrosio96 show that unitarity correction effects can increase the BR by , while vector meson exchange contributions would be negligible. The decay rate is measured relatively to the normalization channel; they have identical particle composition in the final state and only the cut on the invariant mass differs for the two channels. About 40 of the total NA48/2 data sample have been analyzed and 1164 candidates have been found with an estimated background of 3.3 which has to be compared with the only previous experiment kitching97 that collected 31 events. This decay and the normalization channel were collected through the neutral trigger chain, intended for the collection of and therefore suffered from a very low trigger efficiency (). Elaborate studies were performed in order measure trigger efficiencies and correct for them. The reconstructed invariant mass spectrum in the accessible kinematic region is shown in Fig. 3; also shown is the MC expectation assuming the ChPT prediction of d'ambrosio96 .
The model dependent BR of has been measured assuming the validity of the ChPT and = 2. The following preliminary result has been obtained:
A model independent BR measurement is in preparation, together with the extraction of from a combined fit of the spectrum shape and the decay rate.
II.4 The decay
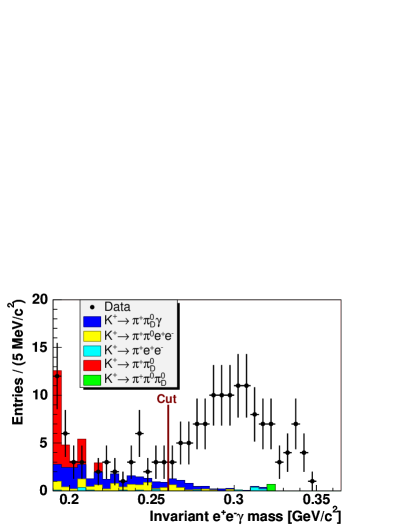
The decay, observed for the first time by NA48/2, is similar to the with one photon internally converting into a pair. After the basic selection criteria, the data were dominated by decay, where the underwent a Dalitz decay . A number of additional selection criteria had to be applied in order to effectively suppress the remaining background due to decays and accidental activity. The signal region was defined by requiring []. Since the ChPT predicts only small signal rate and the background increases for low values of , the additional requirement 0.26 was applied. Using the full NA48/2 data sample, 120 (6.1 background, estimated by MC) candidates are found in the accessible kinematic region.
Fig. 4 shows the reconstructed spectrum of , with the MC expectation for the background contributions. To determine the BR in a model independent way, a partial branching fraction has been computed for each wide interval :
with and the number of observed signal and estimated background events, the acceptance in bin . The overall trigger efficiency is and is the total kaon flux. By summing over the bins above = 0.26 , the model independent BR is obtained:
| (1) | |||
The parameter has also been measured assuming the validity of gabbiani99 . The final results of the analysis have been recently published batley08 .
III KLOE - Neutral kaon decays
The results presented in this section are based on data collected with the KLOE detector at DANE, the Frascati collider operated at a center of mass energy of 1020 MeV, the mass of the -meson, that is produced almost at rest and decays, in 34 of cases, in pairs. The two kaons are always a pure pair, so detection of a guarentees the presence of a . This procedure, called tagging, provides a pure beam.
III.1 The KLOE detector
The KLOE detector consists of a large cylindrical drift chamber adinolfi02dc of diameter and length operated with a low Z and density gas, surrounded by a lead-scintillating fiber calorimeter (EMC)adinolfi02emc . The chamber provides tracking, measuring momenta with a resolution of of at large angle and a vertex reconstruction resolution of . A superconducting coil around EMC provides a 0.52 T magnetic field. The EMC is thick and covers of the solid angle. Energy and time resolutions are and , respectively.
III.2 The decay
The decay is an important test of ChPT. The decay amplitude can be calculated unambiguously at the leading order of the perturbative expansion with an uncertainty of only few percent d'ambrosio86 , giving BR () = .
In the data sample analyzed, corresponding to an integrated luminosity of , 700 decays are identified by -tagging. Because of the tagging, no background from decay is expected, the main background being , with the two photons undetected, due to geometrical acceptance or non reconstruction in the calorimeter. One of the most effective variables against this kind of background is the arrival time of the photons: a prompt photon is defined as a neutral cluster in the electromagnetic calorimeter satisfying the condition: , where T is the time of flight, R is the cluster position with respect to the detector origin of the coordinates and the total time resolution. A signal-enriched sample is defined by requiring two and not more two prompt photons in the event. To maximize rejection, only clusters with and are considered; the residual background from decays other than is suppressed by vetoing events with photons absorbed in a small angle calorimeter. The event counting is performed using a kinematic fit imposing seven constraints: energy and momentum conservation, the kaon mass and the two photon velocities.
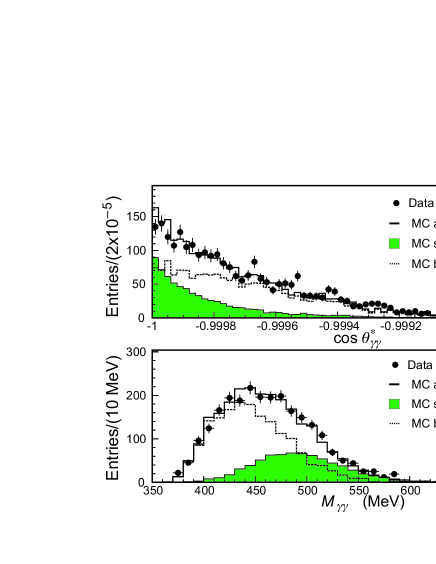
Two other variables with a powerful discrimination against the background are the two photon invariant mass, , and the opening angle between the two photons in the center of mass system, . To obtain the number of events, a 2 dimensional binned maximum-likelihood of the final sample distribution in the and variables is performed using the MC generated signal and background shapes, taking into account data and MC statistics. The result of the fit is: , with , CL. Projections of data and fit are shown in Fig. 5. The signal is peaked at =-1, while distribution is gaussian at the mass. The background is less peaked at =-1 and shows a broader distribution in mass, populating low mass values.
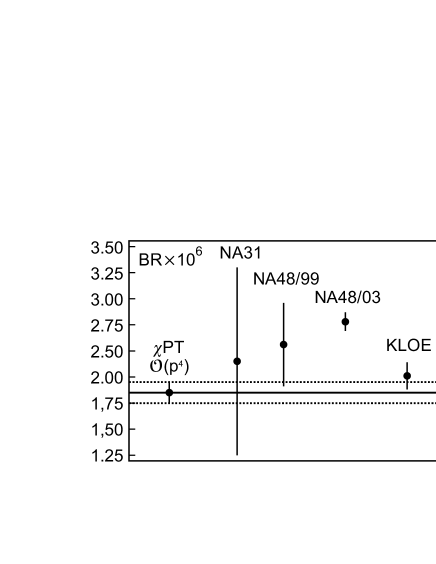
The BR is obtained from N() using as normalization channel the events recorded in the same data sample by counting the tagged events with four prompt photons. The number of events after correcting for selection efficiency is . Using the latest PDG pdg value for , the BR() is obtained
This result together with other existing measurements of as well as the ChPT theoretical prediction are shown in Fig. 6. There is a discrepancy between the KLOE result and the NA48 latest measurement NA4803 : the NA48 measurement implies the existence of a sizable counterterm in ChPT, while the KLOE result makes this contribution practically negligible.
III.3 The decay
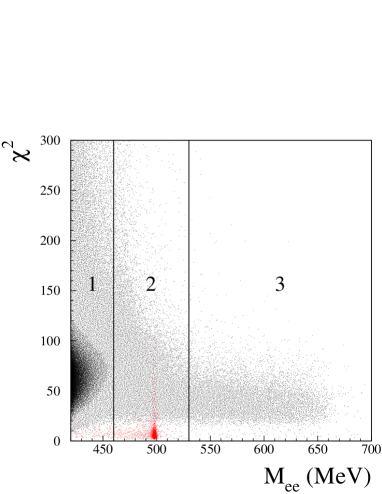
The decay , like and , is a FCNC process suppressed in the SM and dominated by two photon intermediate state. Precise theoretical predictions, based on ChPT at , evaluate the ratio with 10 uncertainty ecker91 . Using the present average for pdg , the SM prediction is BR (. The best experimental limit has been obtained by the CPLEAR Collaboration cplear97 : BR at 90 CL. decays are identified by -tagging and selected by requiring two tracks of opposite charge with a good vertex. One of the main backgrounds is the decay, with two pions misidentified; for these decays the invariant mass is peaked at low values, so a cut at is effective in rejecting this type of background. Another important background is the decay with one prompt photon that simulates a interaction in the EMC and the other photon is not detected. After preselection, the data sample is reduced to events. In order to improve the separation between signal and background, a -like variable is defined, using information from the clusters associated to the candidate electron tracks. Using the MC signal events, likelihood variables are built based on: the sum and the difference of the two tracks, where is evaluated in the electron hypothesis; the ratio between the cluster energy and the track momentum, for both charges; the cluster position relative to the extrapolation of the track, for both charges. Fig. 7 shows the correlation between and for MC signal and background. Two sidebands are defined to check the consistency of MC with data and normalization: region 1 (), dominated by events, and region 3 (), mostly populated by .
A signal box to select events can be conveniently defined in the plane. Other independent requirements, studied by MC and tuned in the sidebands, have been applied in order to reduce the background contamination, before applying the selection. The signal box is chosen with an optimization procedure based only on MC. The cut for the signal box definition has been chosen to remove all MC background events: . The cut on invariant mass is set at , which rules out all signal events with a radiated photon with energy greater than . The signal box selection on data gives = 0. The upper limit on BR() is evaluated using a bayesian approach and normalizing to the number of events. The result is:
This measurement improves by a factor 15 the CPLEAR cplear97 result and includes for the first time radiative corrections.
III.4 The decay
The study of radiative decays offers the possibility to obtain information on the kaon structure and to test ChPT. Two different components contribute to the photon emission: the inner bremsstrahlung (IB) and the direct emission (DE). In the decay the IB component is much larger than the DE and the interference terms. It is customary to apply standard cuts to allow comparison among results: 30 MeV and 20 ( and energy and photon angle w.r.t. the lepton in the kaon rest frame, respectively). The ratio R is defined:
Theoretical prediction for R range between 0.95 and gasser05 . The decay amplitude can be written as
where the second term is the SD contribution. All the information on the SD term is contained in the effective strength . Candidate events are tagged by the presence of a decay. To count signal events, a two-dimensional fit in the variables is performed; this allows to measure both R and . The results of the fit are shown in Fig. 8.
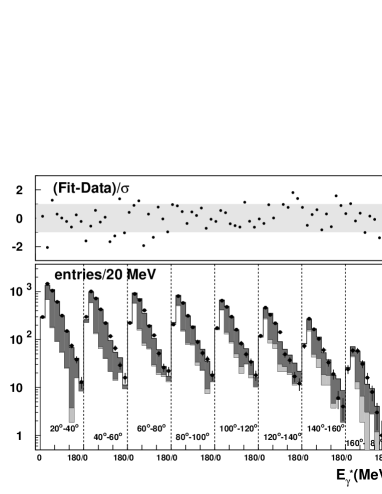
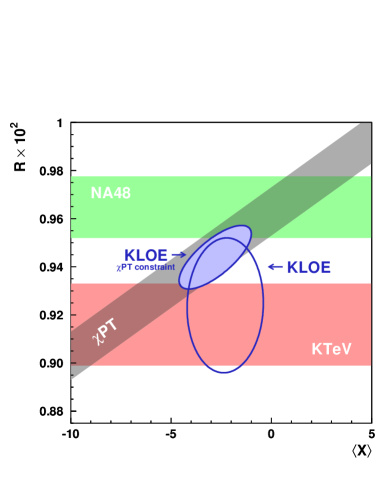
Taking into account all systematics, the measurement of R and yields
The measured value of is in agreement with evaluation in gasser05 . The presence of DE contribution reduces the value of R of about 1 . Fig. 9 shows the comparison of this results with previous measurements. The present accuracy is not sufficient to solve the experimental discrepancy between NA48 lai05 and KTeV alexopolous05 .
References
- (1) G. Ecker, A. Pich, E. de Rafael Nucl. Phys. B 291 (1987) 692.
- (2) J.R. Batley et al., Phys. Lett. B 634 (2006) 474.
- (3) G. D’Ambrosio et al., JHEP 8 (1998) 4.
- (4) A. Z. Dubnickova et al., Phys. Part. Nucl. Lett. 5 vol. 2 (2008) 76.
- (5) R. Appel et al., Phys. Rev. Lett. 83 (1999) 4482.
- (6) C. Alliegro et al., Phys. Rev. Lett. 68 (1992) 278.
- (7) H. Ma et al., Phys. Rev. Lett. 84 (2000) 2580.
- (8) P. Lichard, Phys. Rev. D 60 (1999) 053007.
- (9) W.-M. Yao et al. (PDG), J. Phys. G 33 (2006) 1.
- (10) G. Ecker, A. Pich, E. de Rafael Nucl. Phys. B 303 (1988) 665.
- (11) G. D’Ambrosio and J. Portoles Nucl. Phys. B 386 (1996) 403.
- (12) P. Kitching et al. Phys. Rev. Lett. 79 (1997) 4079.
- (13) F. Gabbiani Phys. Rev. D 59 (1999) 094022.
- (14) J. R. Batley et al. Phys. Lett. B 659 (2008) 493.
- (15) M. Adinolfi et al., Nucl. Instr. Methods A488 (2002) 51.
- (16) M. Adinolfi et al., Nucl. Instr. Methods A483 (2002) 689.
-
(17)
G. D’Ambrosio and D Espriu Phys. Lett. B 175 (1986) 237.
Kambor Holstein Phys. Rev. D 49 (1994) 2346. - (18) NA48 Collaboration, R.J. Batley et al., Phys. Lett. B 551 (2003) 7.
- (19) G. Ecker, A. Pich Nucl. Phys. B 366 (1991) 189.
- (20) A. Angelopoulos et al., Phys. Lett. B 413 (1997) 232.
- (21) J. Gasser et al., Eur. Phys. J. 40 (2005) 205.
- (22) NA48 Collaboration, A.Lai et al., Phys. Lett. B 605 (2005) 247.
- (23) KTeV Collaboration, A. Alexopolous et al., Phys. Rev. D 71 (2005) 0122001.