Phase transitions and molecular dynamics of n-hexadecanol
confined in
silicon nanochannels
Abstract
We present a combined x-ray diffraction and infrared spectroscopy study on the phase behavior and molecular dynamics of n-hexadecanol in its bulk state and confined in an array of aligned nanochannels of 8 nm diameter in mesoporous silicon. Under confinement the transition temperatures between the liquid, the rotator RII and the crystalline C phase are lowered by approximately 20 K. While bulk n-hexadecanol exhibits at low temperatures a polycrystalline mixture of orthorhombic - and monoclinic -forms, geometrical confinement favors the more simple -form: only crystallites are formed, where the chain axis are parallel to the layer normal. However, the -form, in which the chain axis are tilted with respect to the layer normal, is entirely suppressed. The -crystallites form bi-layers, that are not randomly orientated in the pores. The molecules are arranged with their long axis perpendicular to the long channel axis. With regard to the molecular dynamics, we were able to show that confinement does not affect the inner-molecular dynamics of the CH2 scissor vibration and to evaluate the inter-molecular force constants in the C phase.
pacs:
64.70.Nd, 61.46.Hk, 81.07.-b, 61.43.GtI Introduction
The physical properties of condensed matter spatially confined in pores or channels of a few nanometer in diameter can differ markedly from the behavior in the bulk state. In particular, phase transitions can be entirely suppressed or significantly altered in comparison to their bulk counterparts Gelb1999 ; AlbaSim2006 ; Christenson2001 ; Knorr2008 . Also the dynamics of condensed matter confined in mesopores, most prominently in the vicinity of glass transitions Koppensteiner2008 ; Scheidler2000 ; Kremer1999 ; Jackson1991 ; Barut98 ; Pelster99prb ; Daoukaki98prb ; Pissis98 ; Schranz2007 ; Frick2003 , can be affected markedly.
Intimately related to these changes in the phase transition phenomenology the architectural principles of molecular solids can substantially differ in the spatially confined state from the bulk state. This depends, however, sensitively on the complexity of the building blocks. For simple van-der-Waals systems, such as Ar and N2, a remarkable robustness of the bulk structures has been found for the solid state under confinement Huber1998 ; Wallacher2001 ; Knorr2003 . By contrast, the structural properties of pore fillings built out of more complex building blocks, such as linear hydrocarbons Huber2006 ; Henschel2007 ; Montenegro2003 ; Xie2008 ; Valliulin2006 or liquid crystals Crawford1996 ; Kityk2008 are very susceptible to confinement on the meso- and nanoscale. For example, a quenching of the lamellar ordering of molecular crystals of n-alkanes has been observed in tortuous silica mesopores of Vycor Huber2004 . However, in tubular channels of mesoporous silicon this building principle of hydrocarbon molecular crystals survives, albeit a peculiar texture has been observed for the pore confined solids Henschel2007 : The long axes of the molecules and thus the stacking direction of the lamellae are oriented perpendicular to the long axis of the pores.
Here we present an experimental study on a medium-length, linear alcohol C16H33OH, a representative of the 1-alcohol series, imbibed in mesoporous silicon. We explore the phase behavior of the confined alcohol by a combination of x-ray diffraction and infrared spectroscopy measurements. As we shall demonstrate, we profit in those experiments both from the parallel alignment of the silicon channels and from the transparency of the silicon host in the infrared region.
II Experimental
The porous silicon samples used in this study were prepared by electrochemical etching of a heavily p-doped (100) silicon wafer 111producer: SiMat, Landsberg, Germany; specific conductivity: cm. with a current density of 13 in a solution composed of HF, ethanol and H2O (1:3:1 per volume) Lehmann1991 ; Zhang2000 ; Cullis1997 . These conditions led to a parallel arrangement of non-interconnected channels oriented with their long axes along the 100 crystallographic direction of silicon, which coincides with the normal of the wafer surface. After the porous layer had reached the desired thickness of 70 microns, the anodization current was increased by a factor of ten with the result that the porous layer was released from the bulk wafer underneath. Using nitrogen sorption isotherms at K, we determined a porosity of 60% and a mean channel diameter of 8 nm. The single crystalline character of the matrix was checked by x-ray diffraction. Transmission electron micrographs of channel cross sections indicate polygonal, rough channel perimeters rather than circular, smooth circumferences Gruener2008 .
The matrix both for the infrared spectroscopy and the x-ray measurements
were filled completely via capillary action (spontaneous imbibition) with
liquefied C16H33OH Huber2007 . Bulk excess material at the surface was removed by paper tissues.
Infrared spectra in a range of wavenumbers from
4000 to 800 cm-1 with a resolution of 1 cm-1 were
measured with a Fourier Transform Spectrometer (FTIR Perkin Elmer
System 2000). This range corresponds to frequencies from
Hz to Hz (wavelengths from
10 m to 2.5 m). For both the bulk material and the
filled porous samples the same sample holder was used, i. e. a
copper cell with two transparent KBr windows. In the confinement
experiments the long channel axes were oriented parallel to the
beam axis, i. e. perpendicular to the electric field vector. The
sample holder was placed into a cryostat (a closed cycle
refrigerator CTI cryogenics, Model 22) allowing us to vary the
temperature from 50 to 340 K. The temperature was controlled with
a LakeShore 340 temperature controller with a precision of K. All IR-spectra that we show in the following were
measured during cooling (typical cooling rates were of the
order of 0.5 K/min). Heating scans show the same
behavior except for the transition temperatures, which are some degrees higher (see below).
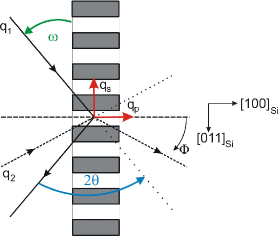
For the x-ray measurements the sample was mounted on a frame in a sample cell consisting of a Peltier cooled base plate and a Be cap. The cell was filled with He gas for better thermal contact. The Be cap sits in a vacuum chamber, the outer jacket of which has Mylar windows allowing the passage of the x-rays over a wide range of scattering angles within the scattering plane (see Fig. 1). But the set-up allowed practically no tilt with respect to the scattering plane. The temperature was controlled by a LakeShore 330 over an accessible range from 245 K up to 370 K. The measurements were carried out on a two-circle x-ray diffractometer with graphite monochromatized CuKα radiation emanating from a rotating anode. The porous sheet was mounted perpendicular to the scattering plane. The two angles that could be varied were the detector angle and the rotation angle about the normal of the scattering plane. The samples were studied as a function of temperature by performing several -scans. In this paper we concentrate on radial --Scans in reflection geometry, i.e. along qp with =0°, and in transmission geometry, i.e. along qs with =90° (see Fig. 1).
II.1 Structure of bulk n-hexadecanol
n-Hexadecanol, C16H33OH, is an almost rod-like molecule with a length of 22 Å and a width of 4 Å. The C-atoms of the backbone are in an all-trans-configuration so that they are located in a plane Huber2004 .
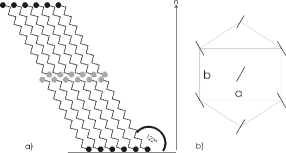
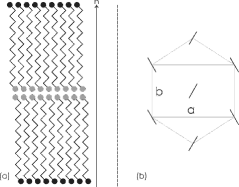
At low temperatures n-alcohols form bi-layered crystals in two possible modifications: the so-called -form, i. e. a monoclinic structure as sketched in Fig. 2 ( Metivaud2005 ; Abrahamsson1960 ), or the so-called -form, i. e. an orthorhombic structure as sketched in Fig. 3 Tasumi1964 . In the -form, the molecules include an angle of ° with the layer plane. Within the layers, they are close-packed in a quasi-hexagonal 2D array, described by the rectangular in-plane lattice parameters and (according to Ref. Abrahamsson1960 Å and Å holds, so that ). There are two different alternating orientations for the C-C-plane of the backbone leading to a herringbone structure (see Fig. 2b). The -form exhibits an identical orientational order of the backbone, but the molecules’ axes remain perpendicular to the layers as sketched in Fig. 3 Tasumi1964 . In addition, gauche- and trans-conformation of the CO-bond alternate with molecules in this phase, while they are in an all-trans configuration in the -form. In general, the -form dominates at low temperatures for the even alcohols, while the -form is more frequent in odd n-alcohols Ventola2002 ; Tasumi1964 . For n-hexadecanol both the orthorhombic -form Tasumi1964 and the monoclinic -form Metivaud2005 ; Abrahamsson1960 are reported. Depending on the preparation conditions it is possible to obtain a polycristalline mixture of the monoclinic - and the orthorhombic -form Ventola2002 .
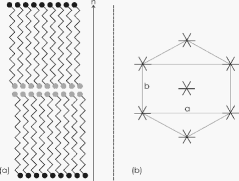
Upon heating, the crystalline phase undergoes a transition into a so-called Rotator-(II)-phase , which is schematically depicted in Fig. 4 222For several alkanes, there also exists a Rotator-(I)-Phase , where the molecules switch between two equal positions.. This phase has a hexagonal in-plane arrangement with the -direction perpendicular to the cell base. The hexagonal arrangement can be indexed with an orthorhombic cell with a ratio of rectangular basal lattice parameters of Sirota1996 . On a microscopic level the change in the center of mass lattice from the low-temperature crystalline phase to the rotator phase can be attributed to the onset of hindered rotations of the molecules about their long axes between six equivalent positions (the stars in Fig. 4b). Further heating above 322 K leads to the liquid state Sirota1996 .
III Results
III.1 Structure of confined n-hexadecanol
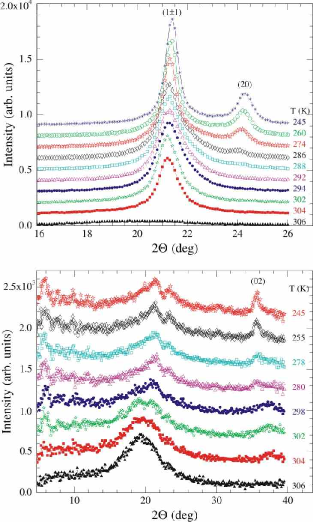
We have determined structures, phase sequences and transition temperatures of n-C16H33OH confined in mesoporous silicon by x-ray diffractometry. The upper panel in Fig. 5 shows diffraction patterns along qp at selected temperatures while cooling. The appearance of a broad Bragg peak at ° indicates solidifaction. Its position is compatible with the leading hexagonal in-plane reflection of the phase. Upon further cooling a second peak at ° shows up. This change in the diffraction pattern indicates an uniaxial deformation of the hexagonal lattice. Both reflections can be mapped on a 2D rectangular mesh characteristic of an uniaxially deformed hexagonal cell. The overall resulting pattern is, however, incompatible with the monoclinic structure of the low temperature bulk crystalline phase.
Additionally to the qp-scans, we performed also scans for a variety of additional orientations of the scattering vector with regard to the long axis of the channels. These patterns differ markedly, which is indicative of a strong texture of the pore confined cystallized alcohol. It is no powder in the crystallographic sense. In particular, there are strong in-plane reflections and no layering reflections for scans along qp, while the qs-scans for the same sample show at least very weak reflections characteristic of a bi-layer stacking and only very weak leading in-plane reflections (see Fig. 5). An analysis of the width of the layering reflections yields a coherence length of 7 () nm.
As discussed in more detail in Refs. Henschel2007 and Henschel2008 , the overall picture which emerges from these results can be summed up as follows: the alcohol molecules form orthorhombic structures with a bilayer-stacking direction along the -direction. Within the bilayers (the a-b-plane), the molecules’ backbones are untilted with regard to the stacking direction and the backbones are orientationally either fully ordered (in a herringbone fashion) or partially ordered, as known from the RI phase of n-alkanes. The superlattice reflection characteristic of the full, herringbone type orientational ordering has been searched for and could weakly be detected at low temperatures. The degree of uniaxial deformation of the hexagonal center of mass cell, quantified by the deviation of the ratio from its value in the hexagonal phase (), also indicates a full orientational ordered state (see Table I, Abrahamsson1960 ). Thus, the diffraction data are compatible with the bulk modification discussed above. This conclusion is also supported by an analysis of the infrared spectroscopy data sets presented below.
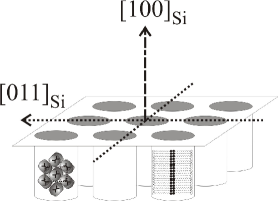
More importantly, the peculiar dependency of the diffraction patterns on the orientation of the q-vector with regard to the silicon host indicate that the bi-layer stacking direction is perpendicular to the long axis of the channels and, consequently, that the long axis of the molecules is oriented perpendicular to the long axis of the channels (see Fig. 6). At first glance, this finding may appear somewhat counter-intuitive. Albeit it can be understood as resulting from the crystallization process in a strongly anistropic, capillary-like confined liquid Henschel2007 ; Steinhart2006 . It is a well established principle in single crystal growth that in narrow capillaries the fastest growing crystallization direction prevails over other directions and propagates along the long axes of capillaries Palibin1933 . For layered molecular crystals of rod-like building blocks this direction is an in-plane direction, which is perpendicular to the long axis of the rods. If this direction is aligned parallel to the silicon nanochannels due to the crystallization process, it dictates a perpendicular arrangement of the molecules’ long axes with regard to the long channel axis, in agreement with the diffraction results presented here.
| bulk | confinement | ||
| cryst. | RII | cryst. | |
| a [Å] | 7.42 | 8.35 | 7.33 |
| b [Å] | 4.93 | 4.82 | 5.04 |
| a/b | 1.51 | 1.45 | |
| d [Å] | 8.91 | 9.64 | 8.90 |
The temperature dependent diffraction study allows us to gain additional information on the relative stability of the different nanochannel confined phases. In Table 2 we display the phase transition temperatures of confined C16H33OH as inferred from the appearance or disappaerance of characteristic Bragg peaks. There is a hysteresis between heating and cooling for both the fluid-RII- and the RII-C-transition (8 K and 3 K, respectively). Compared to the bulk data (see also Tab. 2), the transition temperatures of pore confined C16H33OH are lowered. On cooling, the lowering is of the order of = 18 K for the fluid--transition and = 26 K for the -C-transition. This observation is analogous to phase transitions shifts reported for other pore condensates Christenson2001 ; AlbaSim2006 .
Furthermore, the temperature range of the confined phase, 14 K upon cooling and 19 K upon heating, is larger than that of the bulk material (12 K). Obviously, confinement stabilizes the orientational disordered phase, similarly as has been found for n-alkanes Henschel2007 and for other orientational disordered, plastic phases under spatial confinement Knorr2008 .
| fluid - RII | RII - C | fluid - RII | RII - C | |
|---|---|---|---|---|
| confined (cooling) | 304 | 291 | ||
| confined (heating) | 312 | 293 | ||
| bulk | 322 | 310 |
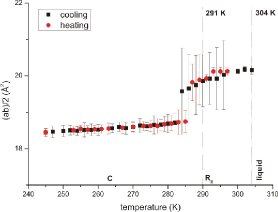
Since the pores were completely filled at higher temperatures, when hexadecanol is in its liquid state, the pore filling at low temperatures does not consist only of bi-layer crystals: the change of volume at the RII-C phase transition is about 10% (see Fig. 7), so that there are voids and/or molecules that are not part of a bi-layer crystal. However, our experiments do not give us information about their spatial arrangement.
III.2 Molecular dynamics
The dynamics of bulk-C16H33OH has already been
investigated in IR-measurements in the past
Metivaud2005 ; Tasumi1964 . In order to show later on how the
molecular dynamics is affected by spatial confinement on the
nm-scale, we display some of our bulk spectra in the following.
Here we focus on two characteristic vibrations,
the OH-stretching and the CH2-scissoring vibration.
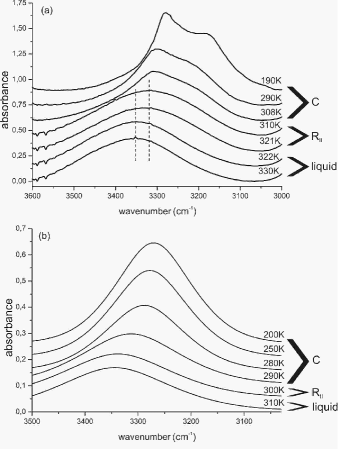
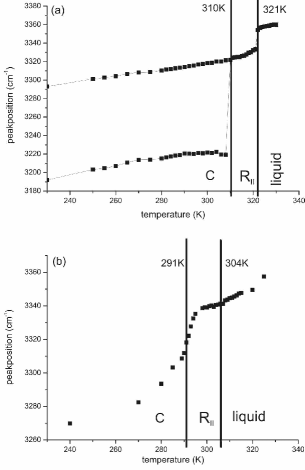
Figs. 8a) and 9a) show the bulk spectra of the OH-stretching-band in the respective phases (compare with Figs. 2-4). In the liquid state (above 322 K) the peak maximum is located at about 3345 cm-1. A decrease of temperature below 321 K yields a shift of the peak position to about 3325 cm-1 indicating the molecular rearrangement in the phase. A further decrease of temperature below 310 K results in a splitting into two peaks at approximately 3310 cm-1 and 3220 cm-1. Confined C16H33OH shows a different behavior. There is only one peak in the whole temperature range, the position of which changes reflecting the transition between liquid phase and phase as well as between phase and C phase (see Figs. 8b and 9b).
The fact that the OH-band of bulk C16H33OH splits at low temperatures while no splitting is observed under confinement confirms the structural differences already observed in the x-ray experiment. For example, Tasumi et. al have studied bulk alcohols CnH2n+1OH from using infrared spectroscopy Tasumi1964 , Ventòla et al. alcohols with Ventola2002 . Those alcohols showing at low temperatures (C phase) the monoclinic -form, such as C16H33OH, exhibit the splitting of the OH-band, while those that take the orthorhombic -form show a single peak. This is due to differences in the spatial arrangement of the hydrogen bonds as well as in the distances of neighboring O-atoms: in the crystalline -form, where the molecule axis are tilted (see Fig. 2), the molecules show an all trans conformation, and the intra-layer O-distance ( Å) differs from the inter-layer O-distance ( Å). However, in the orthorhombic -form (Fig. 3) trans- and gauche-molecules alternate and the intra-layer O-distance ( Å) nearly equals the inter-layer O-distance ( Å), so that the splitting is suppressed Tasumi1964 . Therefore, the observed OH-band splitting for bulk C16H33OH shows the presence of the -form. Either the whole bulk material exhibits the -form or there is a mixture of - and -crystallites. The latter case is frequently observed Tasumi1964 ; Ventola2002 : in fact, in the range of wavenumbers from 1150 cm-1 to 950 cm-1, where C-C stretching vibrations are visible, we see indications for a superposition of both forms (not shown). On the other hand, pore confined C16H33OH shows no OH-band-splitting at low temperatures. This reflects that the molecular arrangement doesn’t transform in the monoclinic -form but remains in an orthorhombic structure, i. e. only the -form is present (compare Figs. 2 and 3). This result is in agreement with the x-ray data presented above. Upon cooling, both the bulk and the confined hexadecanol pass from an hexagonal - phase into a crystalline phase. The bulk material undergoes a stronger structural change, i. e. there is a mixture of the orthorombic - and the monoclinic -form. The latter one is suppressed under confinement, so that only the -form remains, which is quite similar to the hexagonal structure of the RII-phase: the fact that the crystallites have to fit into nanopores of irregular shape might favor the geometrically more simple -form Christenson2001 ; Morishige2000 (see Fig. 6).
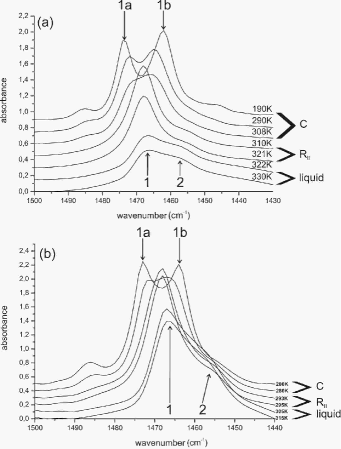
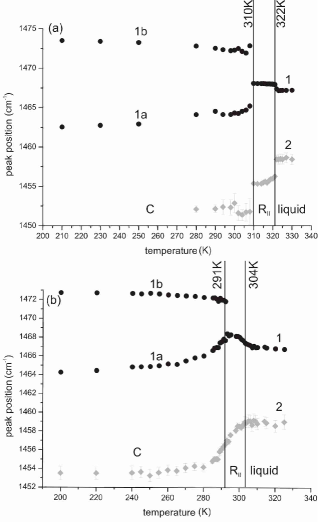
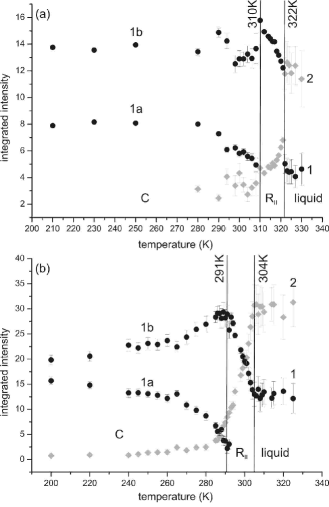
Now let us turn towards the scissor-vibration of the groups (bending mode) that will give us information about inner-molecular and inter-molecular force constants. The spectra are shown in Fig. 10. At first, we want to discuss the bulk material. At high temperatures (liquid state) a superposition of two peaks at 1467 cm-1 and 1460 cm-1 is observed. In the intermediate temperature range ( phase; see Fig. 4) the intensity of the peak labeld ”1” increases strongly. At low temperatures (C phase; see Fig. 2) this band splits up into two peaks. The latter transition can be clearly seen in Figs. 11a) and 12a), where we display the peak positions and intensities as a function of temperature. The results are similar to those obtained for the bulk state of n-paraffines, that apart from the missing OH-group are similar in their structure, i. e. that have the same CH2-backbone Snyder1961 . In IR-spectra only one CH2-scissoring-band is observed at high temperatures, i. e. intra-molecular interactions of the CH2-groups are too small to lead to a series of distinct peaks. The band splitting at low temperatures has been attributed to inter-molecular interactions (see Ref. Snyder1961 and text below).
Qualitatively, a behavior similar to that of the bulk state is
observed for confined C16H33OH (see
Fig. 10b). In the high-temperature liquid phase two overlapping
peaks are visible. The stronger one, i. e. that at higher wavenumbers, undergoes an
increase in intensity at about 304 K (see Fig. 12b), indicating the transition
from the liquid phase to the phase, while the secondary peak at lower
wavenumbers gets weaker and finally
disappears. At the second transition temperature of K
the remaining strong peak splits (see also Fig. 11b).
The separation is not as distinct as for bulk material. These transition
temperatures, K and K (see Figs. 11b and
12b), agree well with those obtained via x-ray measurements
(compare with Table 2).
| bulk | confinement | |||
|---|---|---|---|---|
| liquid | liquid | |||
| scissor [cm-1] | 1467 | 1467 | 1467 | 1467 |
| sym. stretch [cm-1] | 2854 | 2851 | 2854 | 2851 |
| assym. stretch [cm-1] | 2927 | 2921 | 2924 | 2918 |
| [N/m] | 455 | 453 | 454 | 452 |
| [N/m] | 56 1 | 56 1 | 57 1 | 57 1 |
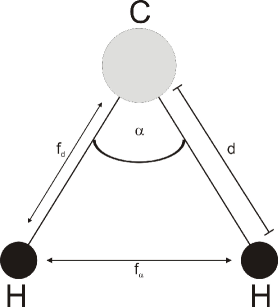
In the following we want to analyze the dynamics of the CH2-groups in order to check whether it is affected by the geometric confinement, e. g. by an interaction with the pore surfaces, by the limited number of neighboring molecules (finite-size-effects) or by structural changes. In a first approximation we can assume that it is not affected by the stretching of the OH - groups. On the one hand, there is the scissor vibration, where the angle between the two CH-bonds oscillates around its equilibrium value ° (see Fig. 13). In addition, symmetric and asymmetric stretching vibrations of the CH-bonds are observable (for the values see Table 3). Let and denote the respective force constants. These can be calculated from the measured vibration frequencies using Eqs. (26)-(28) (see Appendix A; the difference in calculating via Eq. (27) or Eq. (28) is below 3.5% confirming that the inner-molecular coupling terms can be neglected). Table 3 shows the results for the liquid and the phase. Neither the phase transition liquid RII nor geometrical confinement does markely affect the innermolecular constants.
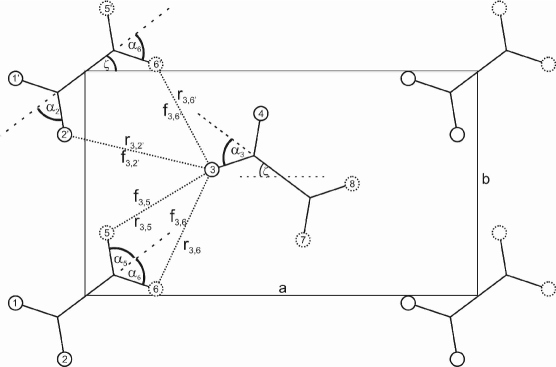
In the phase the molecules rotate about their long axis, so that the primitive cell consists of only one molecule per layer (see Fig. 4). Therefore, no splitting is observed. But in the C phase (below 310 K for bulk and below 291 K for confined C16H33OH), where the molecules are arranged in a herringbone structure, there are two molecules per layer in the primitive cell. So the symmetry of the arrangement allows a splitting of the scissoring band and obviously the molecular interactions are sufficiently strong that we are able to observe a double peak (see above, Figs. 10 and 11). The strength of interaction depends on the distances between neighboring H-atoms of adjacent chains and can be analyzed using a formalism developed by Snyder (see Ref. Snyder1961 and Appendix B). In Fig. 14 we have sketched the orthorhombic lattice of the crystalline C16H33OH subcell (a view on the a-b-plane perpendicular to the molecules axis). In what follows we restrict ourselves to this -form, that is characteristic for confined C16H33OH (a quantitative analysis of bulk C16H33OH is difficult due to the superposition of - and -form). Assuming that the inner force constant does not change at the phase transition, the intermolecular force constants can be evaluated from the observed splitting of the scissor band as described in Appendix B (see Eq. (31)). The values needed are the lattice parameters (see Table 1) and the herringbone angle between the projection of the backbone and the -axis (see Fig. 14). The latter one is determined via Eq. (30) and the measured intensities of the two CH2-scissoring-peaks. For confined C16H33OH we have and yielding an angle of ° (see Fig. 12b for K). We display the intermolecular force constants in Table 4. For comparison, we also list literature values for an alkane, C23H48 at 90 K, which have been evaluated in the same way Snyder1961 . This alkane and C16H33OH exhibit a similar structure: The backbones of the molecules consist of the same CH2-units and both take the -form at low-temperatures. In addition, also the values of the lattice constants for C23H48, Å and Å, are close to those of C16H33OH (see Tab. 1). Due to this structural similarity the intermolecular distances listed in Table 4 are similar, however, the respective force constants differ slightly by 10 to 20%. This is mainly due to the orientation of CH2-groups (the projection of the backbones on the a-b-plane) characterized by the herringbone angle . For C16H33OH ° holds, for the alkane °.
This difference is probably due to the presence of polar OH-groups in C16H33OH that are strongly interacting and thus have an impact on the molecular orientation. The above comparison confirms once again that confined C16H33OH takes the -form in contrast to the bulk material (- and -form).
In order to assess the validity of our analysis, we also calculate the theoretical band splitting of the CH2-scissoring vibration and compare it with the measured values. Using the values from Table 4 as well as Eqs. (34) and (35), we get a theoretical value of cm-1 for confined C16H33OH at K. The measured band splitting is cm-1. Therefore, the experimental data is in good agreement with the theory.
| H-Atoms | force | confined C16H33OH | bulk C23H48 | ||
| constant | (this work) | (Ref. Snyder1961 ) | |||
| ° | ° | ||||
| distances (Å) | Nm | distances (Å) | Nm | ||
| 3-2’ | 2.85 | -4.674 | 2.79 | -5.837 | |
| 3-5 | 2.59 | -2.775 | 2.70 | -2.376 | |
| 3-6 | 2.96 | -3.508 | 2.94 | -3.920 | |
| 3-6’ | 2.96 | -3.508 | 2.94 | -3.920 | |
IV Summary
We have studied the structure and molecular dynamics of n-hexadecanol confined in nanochannels of mesoporous silicon and of bulk n-hexadecanol in their respective phases (in the order of decreasing temperature: liquid, rotator RII and C). For this purpose we have performed x-ray and infrared-measurements.
The transition-temperatures for confined C16H33OH are lower than for bulk C16H33OH ( K, see Table 2). In addition, under confinement the phase transitions are smeared, probably due to a distribution of pore diameters. Geometrical confinement does not affect the innermolecular force constants of the CH2-scissoring vibration (see Table 3) but has an impact on the molecular arrangement. The RII phase of both bulk and confined hexadecanol is characterized by an orthorhombic subcell, where the chain axis are parallel to the layer normal (see Fig. 4). However, in the low-temperature C phase there is a fundamental structural difference. While bulk C16H33OH exhibits a polycrystalline mixture of - and -forms (see Figs. 2 and 3), geometrical confinement favors a phase closely related to the -form: only crystallites with an orthorhombic subcell are formed, where the chain axes are parallel to the bi-layer normal. However, the -form having a monoclinic subcell, in which the chain axis are tilted with respect to the layer normal, is suppressed. A reason for this might be the irregular shape of the nanochannels, into which the crystallites have to fit, favoring the formation of the geometrically more simple and less bulky form Christenson2001 ; Morishige2000 (see Fig. 6). Since only the pure -form is present under confinement, we were able to evaluate the inter-molecular force constants of the CH2-scissor vibration. Also the orientation of the -crystallites has been determined: the molecules are arranged with their long axis perpendicular to the pore axis.
References
- (1) L. D. Gelb, K. E. Gubbins, R. Radhakrishnan and M. Sliwinska-Bartkowiak, Rep. Prog. Phys. 62 (1999) 1573.
- (2) C. Alba-Simionesco, B. Coasne, G. Dosseh, G. Dudziak, K.E. Gubbins, R. Radhakrishnan and M.G. Sliwinska-Bartkowiak, J. Phys. Condens. Mat. 18, R15 (2006).
- (3) H. K. Christenson, J. Phys. Condens. Mat. 13, R95 (2001).
- (4) K. Knorr, P. Huber and D. Wallacher, Z. Phys. Chem. 222, 257 (2008).
- (5) J. Koppensteiner, W. Schranz and M. R. Puica, Phys. Rev. B 78,054203 (2008).
- (6) P. Scheidler, W. Kob and K. Binder, Europhys. Lett. 52, 277 (2000).
- (7) F. Kremer, A. Huwe, M. Arndt, P. Behrens and W. Schwieger, J. Phys. Condens. Matter 11 A175 (1999).
- (8) C. L. Jackson and G. B. McKenna, J. Non-Cryst. Solids 131-133, 221 (1991).
- (9) G. Barut, P. Pissis, R. Pelster and G. Nimtz, Phys. Rev. Lett. 80, 3543 (1998).
- (10) R. Pelster, Phys. Rev. B 59, 9214 (1999).
- (11) D. Daoukaki, G. Barut, R. Pelster, G. Nimtz, A. Kyritsis and P. Pissis, Phys. Rev. B 58 5336 (1998).
- (12) P. Pissis, A. Kyritsis, D. Daoukaki, G. Barut, R. Pelster and G. Nimtz, J. Phys. Condens. Matter 10, 6205 (1998).
- (13) W. Schranz, M. R. Puica, J. Koppensteiner, H. Kabelka and A. V. Kityk, Europhys. Lett. 79, 36003 (2007).
- (14) B. Frick, M. Koza and R. Zorn, Eur. Phys. J. E 12, 3 (2003).
- (15) K. Knorr, D. Wallacher, P. Huber, V. Soprunyuk and R. Ackermann, Eur. Phys. J. E 12 51 (2003).
- (16) D. Wallacher, R. Ackermann, P. Huber, M. Enderle and K. Knorr, Phys. Rev. B 64 184203 (2001).
- (17) P. Huber, D. Wallacher, and K. Knorr, J. Low Temp. Phys. 111, 419 (1998); P. Huber and K. Knorr, Phys. Rev. B 60, 12657 (1999); ; P. Huber, D. Wallacher, K. Knorr, Phys. Rev. B 60, 12666 (1999).
- (18) P. Huber, V. P. Soprunyuk and K. Knorr, Phys. Rev. E 74, 031610 (2006).
- (19) A. Henschel, T. Hofmann, P. Huber and K. Knorr, Phys. Rev. E 75, 021607 (2007).
- (20) R. Montenegro and K. Landfester, Langmuir 19, 5996 (2003).
- (21) B. Xie, G. Liu, S. Jiang, Y. Zhao and D. Wang, J. Phys. Chem. B 112, 13310 (2008).
- (22) R. Valiullin and A. Khokhlov, Phys. Rev. E 73, 051605 (2006).
- (23) G. Crawford and S. Zumer (Editors), Liquid Crystals in Complex Geometries (Taylor and Francis, London, 1996).
- (24) A. V. Kityk, M. Wolff, K. Knorr, D. Morineau, R. Lefort and P. Huber, Phys. Rev. Lett. 101, 187801 (2008).
- (25) P. Huber, D. Wallacher and J. Albers, K.Knorr, Europhys. Lett. 65, 351 (2004).
- (26) V. Lehmann, U. Gösele, Appl. Phys. Lett. 58, 856 (1991); V. Lehmann, R. Stengl and A. Luigart, Materials Science and Engineering B 69-70, 11 (2000);
- (27) X. G. Zhang, J. Electrochem. Soc. 151, C69 (2004);
- (28) A. G. Cullis, L. T. Canham and P. D. J. Calcott, J. Appl. Phys. 82, 909 (1997).
- (29) S. Gruener and P. Huber, Phys. Rev. Lett. 100, 064502 (2008).
- (30) P. Huber, S. Gruener, C. Schaefer, K. Knorr and A. V. Kityk, Eur. J. Phys. Special Topics 141 101 (2007).
- (31) V. Métivaud, A. Lefèvre, L. Ventolà, P. Négrier, E. Moreno, T. Calvet, D. Mondieig and M.A. Cuevas-Diarte, Chem. Mater. 17, 3302 (2005).
- (32) S. Abrahamsson, G. Larsson and E. von Sydow, Acta Cryst. 13, 770 (1960).
- (33) M. Tasumi, T. Shimanouchi, A. Watanabe and R. Goto, Spectrochim. Acta 20, 629 (1964).
- (34) L. Ventolà, M. Ramirez, T. Calvet, X.Solans, M.A. Cuevas-Diarte, P. Negrier, D. Mondieig, J.C. van Miltenburg, H.A.J. Oonk, Chem. Mater. 14, 508 (2002).
- (35) E. B. Sirota and X. Z. Wu, J. Chem. Phys. 105, 7763 (1996).
- (36) A. Henschel, P. Huber and K. Knorr, Phys. Rev. E 77, 042602 (2008).
- (37) M. Steinhart, P. Göring, H. Dernaika, M. Prabhukaran, U. Gösele, E. Hempel and T. Thurn-Albrecht, Phys. Rev. Lett. 97, 027801 (2006).
- (38) P. A. Palibin and A. I. Froiman, Z. Kristallogr. 85, 322 (1933); P. W. Bridgman, Proc. Amer. Acad. Arts Sci. 60 305 (1925).
- (39) K. Morishige and K. Kawano, J. Chem. Phys. 112, 11023 (2000).
- (40) R. G. Snyder, J. Mol. Spectroscopy 7, 116 (1961).
- (41) A. G. Meister and F. F. Cleveland, Am. J. Physics 14, 13 (1946).
- (42) E. B. Wilson Jr., J. Chem. Physics 7, 1047 (1939).
- (43) H. Siebert, Anwendungen der Schwingungsspektroskopie in der anorganischen Chemie, Springer-Verlag, Berlin (1966).
- (44) M. Tasumi, T. Shimanouchi, J. Chem. Phys. 43, 1245 (1965).
- (45) R. S. Stein, J. Chem. Phys. 23, 734 (1955).
- (46) D. A. Dows, J. Chem. Phys. 32, 1342 (1960).
- (47) J. deBoer, Physica 9, 363 (1942).
Appendix A
In this section we show how the innermolecular force constants of
the CH2-groups can be evaluated using three characteristic
vibration frequencies, that are easily measured: the scissor
vibration as well as the symmetric and asymmetric CH-bond
stretching. For this purpose we apply the Wilson FG - matrix
method Wilson1939 . We use the notation of Meister and
Cleveland for the similar molecule
Meister1946
and perform the calculations in the same way.
Fig. 13 shows a single - molecule. In the following we will neglect the influence of the neighboring molecules on this one. Å is the length of the C - H bond and ° the angle between the two C - H bonds Abrahamsson1960 . This kind of molecule belongs to the point group. This means, there are two vibrations of type (symmetric stretching and bending vibration) and one vibration of type (asymmetric stretching vibration). The internal coordinates of this molecule are , and . and mean changes in the bond length of the two C - H - bonds and changes in the angle between the two bonds. Therefore we get three symmetry coordinates, two for and one for . If we assume d being the equilibrium C - H bond length, then we obtain for the three symmetry coordinates:
| (1) |
| (2) |
| (3) |
Now, we have to calculate the F matrix, related to the potential energy, and the G matrix related to the kinetic energy. The potential energy can be written as
| (4) |
and with the internal coordinates
| (5) |
Now we set and write Eq. (5) as
| (6) |
with . In matrix form, Eqs. (4) and (5) become
| (7) |
and
| (8) |
r′ and R′ are the transposes of r and R. With Eqs. (7) + (8)
| (9) |
The ’s are linear combinations of the ’s
| (10) |
Since the ’s are orthogonal and normalized, then and
| (11) | |||
| (12) |
This means with Eqn. (10)
| (13) | |||
| (14) |
The F matrix is
The U matrix for type is
and for
So, for the type the F matrix is
| (15) |
and for the type
| (16) |
The exact derivation of the G matrix shouldn’t be shown here.
It can be gleaned by Meister and Cleveland Meister1946 .
Only the most important steps shall be explained here.
If only non-degenerate vibrations are present, the elements of the
kinetic energy matrix can be written as
| (17) |
where j and l refer to symmetry coordinates used in determining the S vector, refer to a set of equivalent atoms, a typical one of the set being t. is the reciprocal of the mass of the typical atom and is the number of equivalent atoms in the th set. The S vector is given by
| (18) |
where , and have the same meaning as above. can be expressed in terms of unit vectors along the chemical bonds and depends on the changes in the bond length or the angle between the bonds. So, the G matrix for the vibration type has the form
| (19) |
and for the vibration type
| (20) |
To determine the frequencies, one has to solve the equation
| (21) |
where denotes the square of the angular frequency. For the type one gets the equation
| (22) |
and for the type
| (23) |
Eq. (22) can be separated with the Vieta expression Siebert1966 . Inserting the terms for the and , we obtain
| (24) |
For Eq. (23) one obtains
| (25) |
Neglecting the coupling constants and allows to evaluate the innermolecular force constants using the measured wave numbers, , and . Then Eq. (25) yields
| (26) |
Inserting this result into Eq. (24) yields
| (27) |
There is a second possibility to evaluate , i. e. by inserting Eq. (26) into Eq. (24). This yields
| (28) |
Taking the measured wavenumbers listed in Table 3 and the average angle between the CH-bonds, °, as well as the masses of the atoms, and ( kg), Eqs. (26)-(28) yield the force constants listed in Table 3. The difference in calculating via Eq. (27) or Eq. (28) is below 3.1% confirming that the inner-molecular coupling terms can be neglected.
Appendix B
What follows is a summary of Snyder’s derivation of the intermolecular force constants between the CH2 groups of neighboring molecules that gives rise to a splitting of the scissor band at low temperatures Snyder1961 . We show how this formalism can be applied to C16H33OH. An alternative description can be found in Ref. Tasumi1965 .
In Fig. 14 we display a hexagonal subcell of C16H33OH. While Stein Stein1955 has taken only one pair of neighboring into account to calculate the splitting of rocking and scissoring bands, Snyder has shown that more pairs have to be included. When we consider the distances of H-atoms from the H-atom no. 3 (see Fig. 14), then all atoms except no. , , 5 and 6 have distances larger then 3.7 Å. The internal coordinates are always half of the angle between the C - H bonds of a molecule. Solid circles are H-atoms in the same plane, dashed circles H-atoms in a plane above or below.
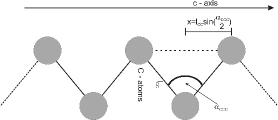
Now, we want to write the positions of these five H-atoms as a vector. Fig. 15 shows the lateral view of a part of the C16H33OH chain. With values from Abrahamsson Abrahamsson1960 for Å and °, we can calculate the distance of the a-b-plane to the corresponding plane above or below with
Assuming that the hydrogen in the central plane has the component 0, the hydrogen in the plane above has the component Å.
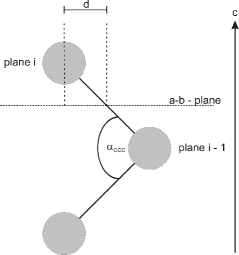
The projection of the C - C bond in the a-b-plane is according to Fig. 16
Taking the point 0 for the lower left edge of the ab - plane the five atoms have the coordinates:
with and being the lattice constants of the crystalline phase. We get the distances between the atom 3 and the other ones (see Fig. 14) with
| (29) |
where is. The herringbone angle (see the upper left corner of Fig. 14) can be determined with the relation Snyder1961
| (30) |
where is the integrated intensity of the scissoring mode, which is polarized in
the a direction (higher mode at 1473 cm-1) and the one of the mode,
which is polarized in the direction (lower mode at 1462 cm-1).
With the distances of two hydrogen atoms and (=) [in our case 3 denotes the central H-atom (see Fig. 14) and the neighboring H-atoms that interact] we obtain the intermolecular force constants :
The values of are obtained from Eq. (33).
| (33) |
with in .
The measured intensity ratio (Eq. (30)) allows us to calculate the distances as well as the partial derivatives (see Eq. (29) and above). Finally, by knowing the intermolecular force constants from Eq. (33) we can evaluate the band splitting of the scissoring vibration Snyder1961 . For the angular frequencies
| (34) |
holds 333In Snyder’s general theory the force constants for the scissoring vibration are denominated as (= ), (= ) and (= ). with
| (35) |
Here and denote the masses of the atoms ( kg), m the C-C distance and m the C-H distance, so that Å (N m)-1s-2. For the band splitting of the wavenumbers we thus obtain
| (36) |