Spitzer observations of a gravitationally lensed quasar, QSO 2237+0305
Abstract
The four-image gravitationally lensed quasar QSO 2237+0305 is microlensed by stars in the lens galaxy. The amplitude of microlensing variability can be used to infer the relative size of the quasar as a function of wavelength; this provides a test of quasar models. Towards this end, we present Spitzer Space Telescope Infrared Spectrograph (IRS) and Infrared Array Camera (IRAC) observations of QSO 2237+0305, finding the following: (1) The infrared spectral energy distribution is similar to that of other bright radio-quiet quasars, contrary to an earlier claim. (2) A dusty torus model with a small opening angle fits the overall shape of the infrared spectral energy distribution well, but the quantitative agreement is poor due to an offset in wavelength of the silicate feature. (3) The flux ratios of the four lensed images can be derived from the IRAC data despite being unresolved. We find that the near-infrared fluxes are increasingly affected by microlensing towards shorter wavelengths. (4) The wavelength dependence of the IRAC flux ratios is consistent with the standard quasar model in which an accretion disk and a dusty torus both contribute near 1 micron in the rest frame. This is also consistent with recent infrared spectropolarimetry of nearby quasars.
1 Department of Astronomy, University of Washington, Box 351580, Seattle, WA 98195, agol@astro.washington.edu \address2 Jet Propulsion Laboratory, California Institute of Technology, 4800 Oak Grove Drive, Pasadena, CA 91109
98.54-h,95.85Hp,98.62Sb
1. Introduction
Radio quiet quasars, or quasi-stellar objects (QSOs), are some of the most luminous objects in the Universe, reaching 10 in the brightest cases; they are also very compact, hence the name “quasi-stellar.” Such a large luminosity from a compact source cannot be powered by stars, but can be powered by a super-massive black hole at the center of a galaxy (Lynden-Bell, 1969). The black hole creates radiation by accreting gas via an accretion disk near the Eddington limit. The accretion disk is fed by gas from the surrounding galaxy via a dust and gas torus on parsec scales. This widely held picture explains the two most significant features of quasar spectral energy distributions: 1) a broad peak in the optical/ultraviolet due to the accretion disk and 2) a broad peak in the infrared due to the dusty torus. These two spectral components are commonly referred to as the “Big Blue Bump” (Shields, 1978) and the “infrared bump” (Sanders et al., 1989), with comparable luminosities in each. In between these two peaks lies a valley dubbed “the one-micron dip.” The standard model naturally accounts for the one-micron dip due to the sublimation temperature of dust; the dusty torus is heated by radiation from the accretion disk, but dust cannot exist at temperatures above about 1500 , causing a cutoff in the emission from the torus that always occurs near 1 micron. This paper presents a novel test of this two-component model using measurements of gravitational microlensing near the one micron dip of the high redshift quasar QSO 2237+0305 (). Near one micron both the accretion disk and dusty torus have nearly equal specific luminosity, but very different sizes, so the region near one micron is ideal for testing the standard model with microlensing.
1.1. Background
QSO 2237+0305 was chosen for this study as it holds several records among gravitationally lensed quasars: it was one of the first four-image lenses discovered (Huchra et al., 1985); its lens galaxy has the lowest redshift, (Huchra et al., 1985); and it was the first to show gravitational microlensing (Irwin et al., 1989). This last fact is a result of the second: a nearby lens galaxy causes a large velocity of the quasar relative to the magnification patterns created by stars in the lens galaxy projected onto the source plane; this large relative velocity results in a shorter timescale for microlensing. The discovery of microlensing in this system and its short microlensing time scale made it a “rosetta stone” for studies of the size of the quasar emission region: the time-dependent microlensing magnification is sensitive to the size of the source, effectively resolving the quasar on sub-microarcsecond scales. Larger sources smooth over the microlensing magnification pattern and thus experience smaller and more gradual variations in magnification (Refsdal and Stabell, 1991). In unlensed quasars, only the spectral energy distribution can be compared to models (e.g. Sanders et al., 1989; Blaes et al., 2001; Malkan, 1983), while for QSO 2237+0305 the size as a function of wavelength can be compared to models as well, in principle giving much stronger constraints on the emission mechanism.
Despite this promise, the interpretation of the first optical microlensing events in QSO 2237+0305 were puzzling: one study showed the inferred size of the Big Blue Bump was consistent with the accretion disk model (Wambsganss et al., 1990), while another study showed the size of the emission region was too small (Rauch and Blandford, 1991). The latter result led to other newer models which require more theoretical development, e.g. Barvainis (1993); Czerny et al. (1994). With a much larger data set and more sophisticated analysis of the microlensing lightcurves, Kochanek (2004) showed that thermal emission from an accretion disk is consistent with the size inferred from microlensing. However, microlensing in a sample of gravitationally lensed quasars has led to a different conclusion: the size of the optical/UV emission region inferred from microlensing is too large compared with the size of quasar accretion disk models inferred from fitting the SEDs (Pooley et al., 2007; Morgan et al., 2007).
This confused state of affairs of microlensing of the Big Blue Bump partly stems from the fact that the absolute size is difficult to constrain as there are degeneracies between the mass of the microlenses and the sky velocity of the quasar relative to the magnification pattern. However, the relative size versus wavelength is much easier to constrain since it is not as subject to these degeneracies (Wambsganss and Paczynski, 1991). In particular, the first results for the wavelength-dependent relative size seem to be in good agreement with the accretion disk model for a different lensed quasar (Poindexter et al., 2008), although the absolute size is still discrepant. The relative size of the optical/ultraviolet/X-ray emission region for QSO 2237+0305 is well constrained by microlensing (e.g. Wyithe et al., 2000; Kochanek, 2004; Anguita et al., 2008), taking advantage of the long time scale data set collected by the Optical Gravitational Lensing Experiment (OGLE Udalski et al., 2006; Woźniak et al., 2000). An intensive monitoring campaign with the Very Large Telescope (VLT) promises to give a very detailed picture of the relative sizes of the Big Blue Bump and broad-line regions as a function of wavelength (Eigenbrod, Courbin, Sluse, Meylan and Agol, 2008; Eigenbrod, Courbin, Meylan, Agol, Anguita, Schmidt and Wambsganss, 2008). In this paper we will not attempt to resolve the absolute size problem, but rather we will argue that the standard two-component model provides good agreement with the wavelength dependence of the microlensing flux ratios, adding credence to the standard model.
The first microlensing study of the infrared bump was carried out with QSO 2237+0305 to distinguish synchrotron and dust emission models for the infrared bump (Agol et al., 2000). The synchrotron emission model provides an alternative, albeit less natural, explanation for the infrared bump. The synchrotron emission region responsible for the infrared bump has to be compact to avoid self-absorption; thus it should show strong variability due to microlensing. On the other hand the dusty torus model must be extended to avoid sublimation, and thus should vary weakly due to microlensing. Agol et al. (2000) found that the mid-infrared flux ratios were consistent with no microlensing (Schmidt et al., 1998); this despite the fact that the optical source was simultaneously undergoing strong microlensing events. These observations ruled out strong microlensing magnification of the mid-infrared emission region, which was one of the first clear-cut demonstrations that the infrared emission region in radio-quiet quasars is due to thermal emission by dust, not synchrotron emission (Wyithe et al., 2002). Here we extend these results to observations near the 1 micron dip where both the dusty torus and accretion disk contribute to the flux.
1.2. Plan of the paper
In §2 we discuss the observations and data reductions. Although the primary focus of this paper is on probing the relative source size versus wavelength, there are two problems related to the SED that may be addressed with our data as well: 1) How similar is the SED of QSO 2237+0305 to other quasars and Seyfert galaxies? Ground-based observations indicated that QSO 2237+0305 contained hotter dust than any other quasar (Agol et al., 2000), while the observations presented here show that the ground-based observations at one wavelength were in error. The large intrinsic luminosity and high magnification, , (Schmidt et al., 1998) make this QSO an excellent candidate for spectroscopy and allow us to compare the spectrum of a high-redshift quasar with nearby Seyfert galaxies. In §3.1 we show that QSO 2237+0305 looks very similar to other quasars and Seyfert galaxies. 2) How well does the infrared SED match dusty torus models? In §3.2 we show that the overall shape agrees qualitatively, but the quantitative agreement is poor.
In §3.3-3.4 we present the microlensing results and interpretation for QSO 2237+0305, demonstrating that two size scales are required to fit the microlensing flux ratios, as predicted by the accretion disk/dusty torus model. In §4 we discuss the implications for quasars in general and in §5 we summarize.
2. Observations
Cycle 2 observations with the Spitzer Space Telescope were awarded for studying QSO 2237+0305 under program 20475. QSO 2237+0305 ( J2000) was observed with both the Infrared Spectrograph (IRS; Houck et al., 2004) and the Infrared Array Camera (IRAC; Fazio et al., 2004) on Spitzer. A summary of observations is presented in Table 1. Listed integration times are for observations of the QSO only; peak-up observations and sky observations are not included.
Date Instrument Module Integration Time / Exp. Num. of Exp. 2005-11-17 IRAC 3.6 m 1.2 sec 32 2005-11-17 IRAC 4.5 m 1.2 sec 32 2005-11-17 IRAC 5.8 m 1.2 sec 32 2005-11-17 IRAC 8.0 m 1.2 sec 32 2005-11-20 IRS Short-Low 6.29 sec 64 2005-11-20 IRS Long-Low 14.68 sec 128 2006-06-29 IRS Long-High 60.95 sec 60
2.1. IRS
Basic Calibrated Data (BCD) images were obtained from the Spitzer archive, pipeline version S14.0.0. QSO 2237+0305 was observed with the IRS modules Short-Low (SL2, 5.2-8.7 m, and SL1, 7.4-14.5 m), Long-Low (LL2, 14.0-21.3 m), and Long-High (LH, 18.7-37.2 m), for a full observed wavelength coverage of 5.2-37.2 m. Rogue pixels were eliminated using the IRSCLEAN_MASK software package provided by the Spitzer Science Center. We created our own rogue pixel maps (pixels with anomalous behavior) for each spectral order by measuring two quantities from a series of sky images for each order (for the long-high data we chose only portions of the image that did not contain the target): (1) the scatter in each pixel with time; (2) the difference between the value of a pixel and the median of a region within a 55 pixel region surrounding it. We then flagged pixels which had either excessive scatter or consistently had values much larger than the median smoothed image, and included these in the rogue pixel map. This procedure resulted in similar maps to those generated automatically by the IRSCLEAN_MASK software, but was better at flagging more rogue pixels so that we did not have to flag any pixels by hand. Rejected pixels were interpolated from the surrounding pixels.
The cleaned spectra were coadded and extracted using the Spectroscopy Modeling Analysis and Reduction Tool (SMART; Higdon et al., 2004). The method of sky subtraction depended on the resolution of the data. For the low-resolution data, sky subtraction was performed by subtracting one nod position from the other before extraction. For high-resolution data, the narrow width of the slit required that separate sky images be subtracted from the QSO images in each nod position. A separate set of images 130 arcseconds away from the QSO was taken for this purpose. This same procedure applied to a standard star (HR 7341) yielded a spectrum which matched between each of the IRS orders/modules, matched the calibration spectrum within 5%, and gave a spectrum which obeyed the Rayleigh-Jeans limit, so we are confident of the relative calibration of our data, but expect that the absolute calibration has an uncertainty of 5%. We re-reduced the data with later versions of the pipeline which resulted in fluxes that differ by as much as 20% in the overlapping region between different orders, while the 14.0.0 pipeline did not have this problem.
For each order of each module, we fit a Gaussian to the distribution of the difference in flux between the two nods divided by the sum of the squares of the uncertainties; in all cases the standard deviation of this distribution differed from unity indicating that the uncertainties were misestimated. We scaled the SMART uncertainties by the standard deviation of this Gaussian. We then fit the median-smoothed spectrum from all nods and orders with a 5-th order polynomial, and cleaned the data of points which disagreed by from this fit, as well as points for which the two nods disagreed by . This procedure automatically removed data near the edges of each order, which are notoriously unreliable, and also removed other outliers which may be due to improperly cleaned cosmic rays or rogue pixels.
2.2. IRAC
QSO 2237+0305 was observed for 38.4 sec in each of the four IRAC wavebands (3.6, 4.5, 5.8, and 8.0 m) in full array mode with a 16-position spiral dither pattern with 2-second exposures at each position. Post-BCD mosaics were obtained from the Spitzer archive (pipeline version 13.0.2), which we used in our analysis. As QSO 2237+0305 is only a few pixels across at the resolution of IRAC (see Figure 1), the four lensed images and lens galaxy are unresolved; however, we were still able to derive the flux ratios of the four images.

2.3. Flux ratios
For comparison with microlensing models, we derived the fluxes of the lensed quasar images from the IRAC data. As the pixel size of the IRAC images, , is comparable to the separation of the quasar images, this required a multi-component model fit. Since the relative positions of the quasar images are known extremely accurately, and since the IRAC point spread function (PSF) is known fairly precisely, we derived the flux ratios of the four lensed images of the quasar with PSF fitting. The main uncertainty in the fitting is the contribution of the lens galaxy to the flux in the IRAC bands; we addressed this by using the HST H-band as a model from the CASTLES survey (Kochanek et al., 2009), assuming no color gradients between the H-band and IRAC bands. This is likely a good approximation as extinction and intrinsic colors should vary weakly in the infrared since the stellar emission is well into the Rayleigh-Jeans tail.
We created a model composed of (i) four quasar images; (ii) the one star 10′′ from the center of the lens galaxy; (iii) the lens galaxy flux, scaled from a deconvolved HST -band image; (iv) a uniform sky background. We held the relative positions of the quasar images (and the nearby star) fixed to the values derived from the HST H-band image, while we allowed the absolute position to vary (given the uncertain absolute pointing of Spitzer).
The lens galaxy was isolated in the HST H-band image by masking the quasar images and stars (within a circle 14.25 pixels from the location of each point source), and the masked region for each quasar image was replaced with an elliptical Sersic model fit to the remaining H-band data, while the masked region near the star was filled in with the median flux near its location. As the Spitzer IRAC PSF is derived at 5 times the pixel resolution (), we rotated and compressed the HST image to fit the Spitzer images at 5 times the resolution. We then convolved the HST image with the IRAC PSF for each band, multiplying by a constant factor to scale to each IRAC band, and added to this the five point fluxes by interpolating the Spitzer IRAC PSF to the location of each point source and multiplying by their respective fluxes. Finally we added in a constant flux to represent the sky.
These model components give a total of nine free parameters to fit: 5 point sources, the extended galaxy flux scaling factor, the sky flux, and the RA and DEC of image A, which was taken as the reference point. We computed the of this model by comparing with the Post-BCD mosaic and uncertainties from the Spitzer IRAC pipeline. We optimized the model parameters using the Levenberg-Marquardt method, and then found the uncertainties on each parameter from a Markov chain computed using the method described in Tegmark et al. (2004). The best-fit for the four IRAC channels was (314,209,91,162) for 236 degrees of freedom (9 model parameters to fit the flux of 245 pixels which is the region covered by the HST H-band image). Formally these fits range from very good to poor, which may indicate that the model is inadequate (e. g. possibly the galaxy has color gradients between 2.2 and 3.6 microns), or the error bars are misestimated. We also computed error bars on the model parameters using the covariance matrix evaluated at the best fit and by finding the region with for each parameter while marginalizing over the other parameters; each of these techniques gave error bars nearly identical to the Markov chain. We converted these values to fluxes in mJy, as well as flux ratios, and report the derived fluxes and errors in Table 2. For the galaxy we report the entire model flux within 5 pixels (6′′) of the center of the galaxy except for the contribution from quasar images. The -band data is from data taken by the OGLE collaboration one day before the Spitzer observations, and the errors reported are relative flux errors, not absolute (Udalski et al., 2006). In addition we report the continuum spectral slope, measured at 5400 Å for , for all four images measured with a VLT observation on 11 November 2005 (Eigenbrod, Courbin, Sluse, Meylan and Agol, 2008).
Image m) m) m) (8.0m) A B C D Total A-D Star Galaxy
Image V band 3.6 m 4.5 m 5.8 m 8.0 m B/A C/A D/A C/B D/B D/C A/(A+B+C+D) B/(A+B+C+D) C/(A+B+C+D) D/(A+B+C+D)
3. Results
3.1. Spectral Energy Distribution
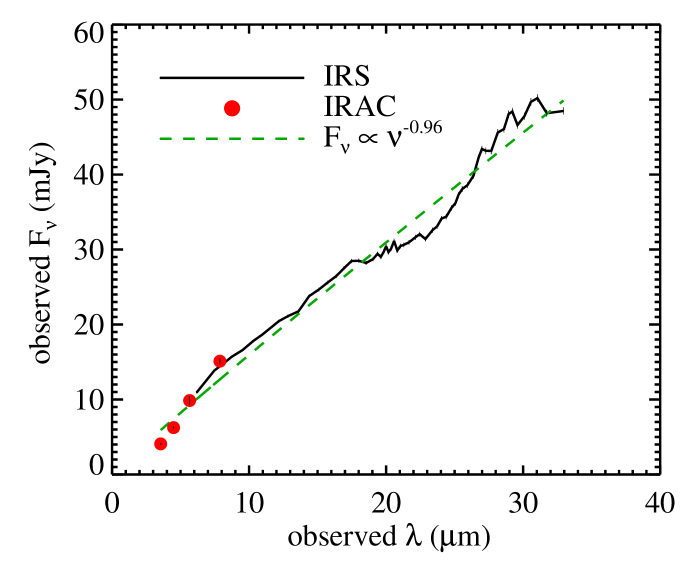
In this section we compare the Spitzer spectral energy distribution of QSO 2237+0305 to Seyfert galaxies and quasars to show that it looks like a typical radio-quiet active galaxy in the infrared. Figure 2 shows the Spitzer spectrum of QSO 2237+0305 which has been binned so that each bin has a signal-to-noise greater than 100. The excellent agreement between the IRS and IRAC results, which had completely independent flux calibration, bolsters our confidence in the accuracy of our reported fluxes.
We fit a power law of the form to the IRS spectrum, and we find , giving a spectrum which is nearly flat in .
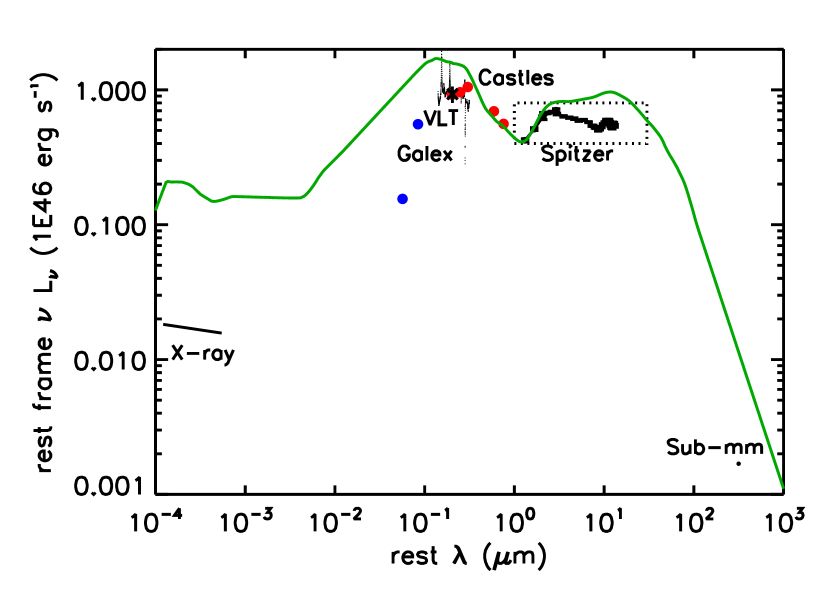
Figure 3 shows the full spectrum of QSO 2237+0305; the isotropic luminosity is defined as , where / refer to the rest-frame/observed frequencies, is the luminosity distance of the quasar, and is the total magnification of the quasar. Included are our data from both IRS and IRAC, optical and near-infrared data points from the CfA-Arizona Space Telescope LEns Survey (Falco et al., 2001), OGLE (Udalski et al., 2006), and Eigenbrod, Courbin, Sluse, Meylan and Agol (2008), X-ray data from Dai et al. (2003), two data points from the GALEX archive (Martin et al., 2005), and a sub-mm data point at 850 m from Barvainis and Ivison (2002). To compute the total luminosity we have assumed the cosmological parameters from the WMAP 5-year data set (Dunkley et al., 2008) as well as a total macrolensing magnification of (Schmidt et al., 1998). The optical data have been corrected for extinction in the Milky Way assuming a Galactic reddening of with extinction curve. As the light from the quasar passes through different portions of the bulge of the lens galaxy, we need to make additional extinction corrections for the four lensed images. We have used the flux ratios of the broad lines averaged over time from the data set of Eigenbrod, Courbin, Sluse, Meylan and Agol (2008) to derive the relative extinction of the four quasar lensed images. We find image B is extincted relative to image A by , while images C and D are reddened with respect to images A and B by , respectively. Since images A and B have small (possibly zero) relative extinction, we assume that each of these images has zero extinction in the lens galaxy, and simply correct images C and D. We have not attempted to correct the data for microlensing, so the overall uncertainty is at least 0.2 mag. From the QSO 2237+0305 SED we find a total luminosity of erg/s.
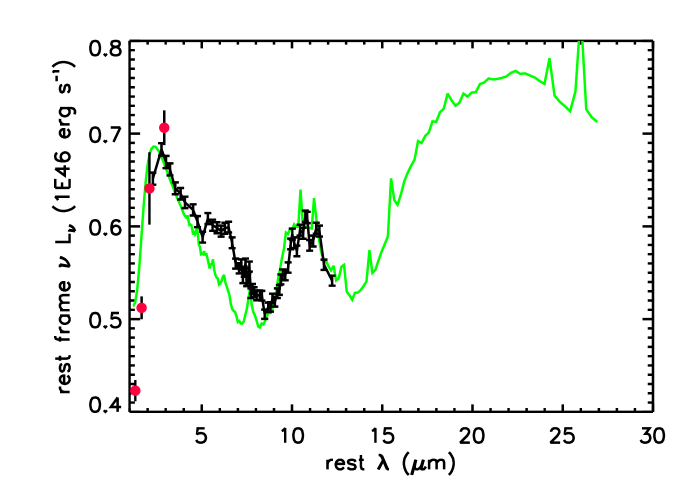
In Figure 3 we plot the SED of QSO 2237+0305, and for reference compare it to the composite radio-quiet quasar SED from Elvis et al. (1994), normalized to 1.3 m. Although QSO 2237+0305 appears underluminous in the X-ray, UV, mid-IR, and sub-mm relative to the composite, this behavior is well within the range of SEDs in the Elvis sample, and it is likely that the composite is affected by selection biases at these wavelengths where many quasars were not detected. The SED of QSO 2237+0305, shown in Figure 4, looks fairly typical compared to a composite spectrum of Palomar-Green quasars with weak far-infrared emission (Netzer et al., 2007). There are minor differences such as an extra bump near 6-7 m and a peak associated with the hottest dust at slightly longer wavelengths (m), but these differences are well within the range of variation within the PG quasar sample. If we “fit” the QSO 2237+0305 SED by scaling the Netzer composite spectrum by an arbitrary factor, we find a for 32 DOF, which is formally a very poor fit, but the discrepancy is dominated by the disagreement in the cutoff at short wavelengths and the bump near 7 microns.
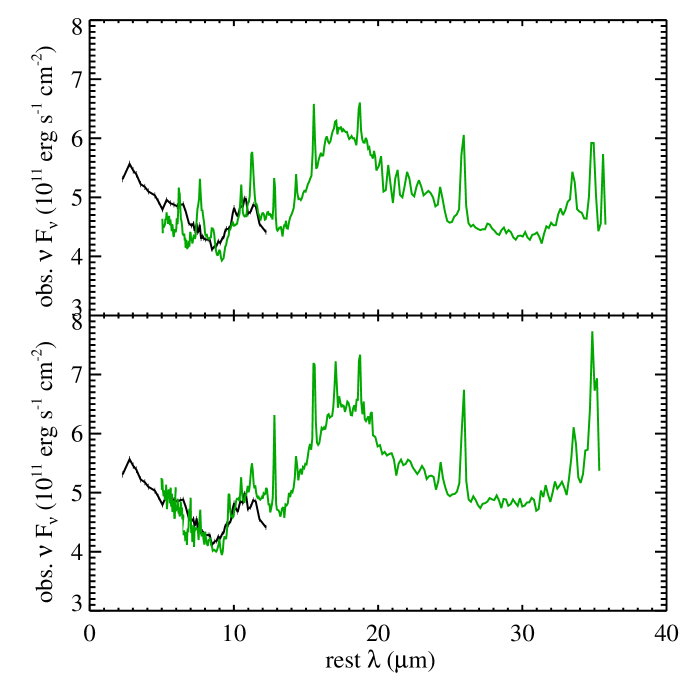
The infrared spectrum of QSO 2237+0305 also looks very similar to low redshift Seyfert galaxies taken from a sample of 23 galaxies (Gorjian et al., in preparation). The Spitzer spectrum of QSO 2237+0305 is plotted with the two most similar Seyfert spectra in Figure 5, scaled to match the flux of QSO 2237+0305. The qualitative shape of the SEDs matches well from 4-10 m, although Mrk 509 shows stronger emission features, presumably due to silicates.
The similarity of the infrared SED of QSO 2237+0305 to other Seyferts and quasars indicates that our microlensing studies of this object will broadly apply to radio-quiet active galaxies.
3.2. Dust emission model
To improve our physical understanding of the emission from QSO 2237+0305 we fitted the SED with the models of Fritz et al. (2006). The models utilize the Mathis-Rumpl-Nordsieck (MRN) dust size distribution (Mathis et al., 1977) with scattering and absorption opacities from Laor and Draine (1993). The model fixes the geometry as a torus with an opening angle that is independent of radius and an inner radius of the torus,
| (1) |
which is set by a dust sublimation temperature of 1500 K, where is the AGN luminosity in units of erg s-1. The dust density in the model is described by , with a dust-free cone within polar-angle . The grid of models covers a range of parameters for the dust with: (1) the ratio of the outer to inner radius, ; (2) the variation of dust density with radius, ; (3) the equatorial optical depth at 9.7 m, ; (4) inclination angles, , ranging from 0.01 (edge-on) to 89 degrees (face-on), and in between; (5) dust-free cone with size ; and (6) an angular cutoff in density with .
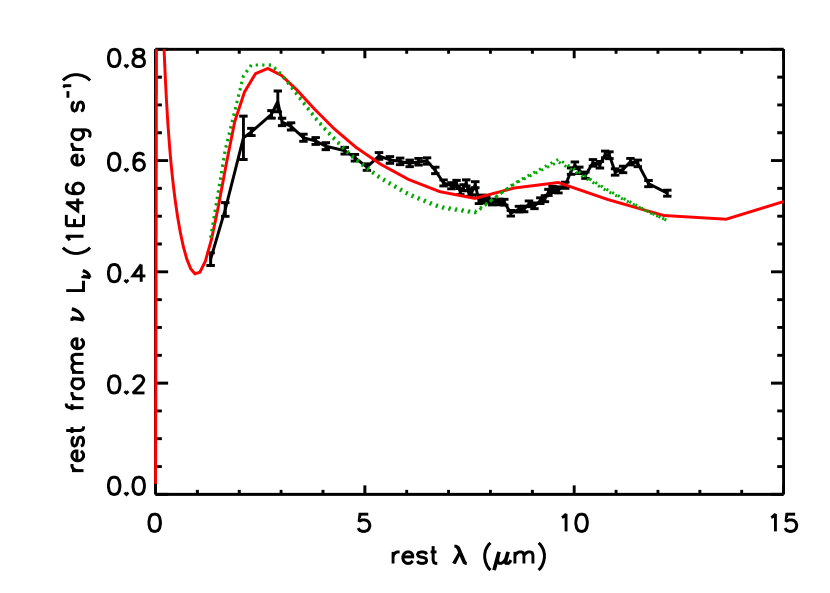
We have scaled the infrared portion of the models by an arbitrary constant to optimize the match with our Spitzer SED. The best-fit model is shown in Figure 6, which has parameters , , , , , and . The best fit implies an AGN luminosity of erg s-1, remarkably close to the luminosity found from the QSO 2237+0305 SED (), despite the fact that we have only fit the Fritz models to the infrared data. This may imply that the dust acts as a fairly good calorimeter of the total AGN flux. The qualitative fit to the data is fair: the model shows a peak near 2.5 m in the rest frame, and gradual decline towards longer wavelengths, and an emission feature near 10m. However, quantitatively the fit is horrible: for 94 degrees of freedom. This is primarily due to the fact that the short-wavelength peak is more prominent in the model than in the observations and the silicate absorption and emission features in the model are offset in wavelength of the observed features. It is possible that optimizing the parameters will improve the fit as the grid is quite coarse and some of the best-fit parameters are at the extreme values of the grid, such as . Also, the viewing angle is which is only 1∘ within the opening angle of the cone; however, viewing angles of 81∘ and 89∘ are very similar in shape, but only slightly poorer fits, plotted as dotted lines in Figure 6. Consequently we do not believe that the fitted parameters are unique or even correct; indeed the simple geometry chosen by Fritz et al. may be wrong. The main point is that a dusty torus model can produce a fair qualitative fit to the SED of QSO 2237+0305; further development of theoretical models will be required to obtain a better quantitative fit.
3.3. Measured flux ratios
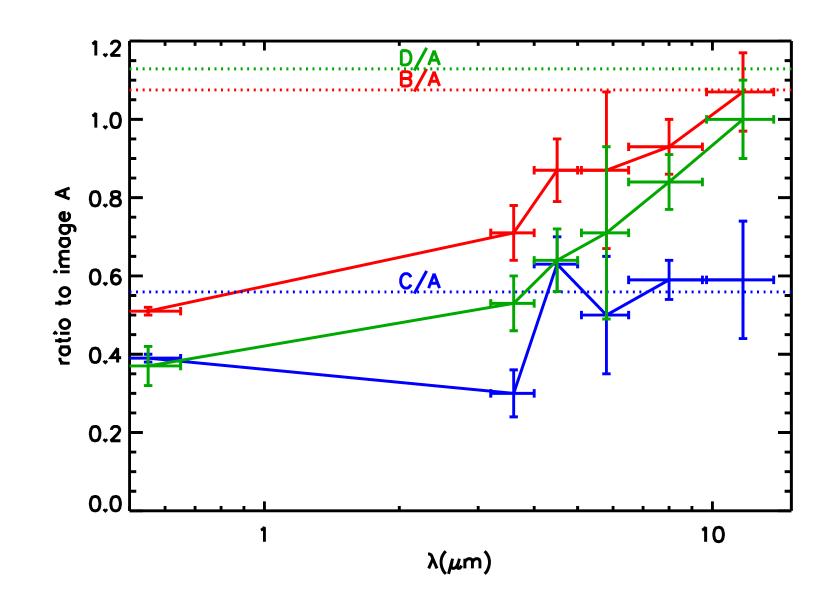
Figure 7 shows the ratios of the quasar image fluxes as a function of wavelength from Table 2. The -band data are the data obtained from the OGLE data archive (Udalski et al., 2006) taken at a time closest to our IRAC observations: 2005 Nov. 16 00:48 UT (HJD). The 10 micron points are from Agol et al. (2000), and thus are not simultaneous to our Spitzer observations; however there appears to be little variability at this wavelength. Also plotted are the model flux ratios from Trott and Webster (2002) which is the most complete model of the lens galaxy of QSO 2237+0305 constructed to date, including the bar and spiral arms. The agreement with the 10 micron flux ratios is expected since these were used as a constraint on the model; however, the model gives very similar flux ratios as an earlier model by Schmidt et al. (1998) which was constructed before the 10 micron observations.
The general trend is obvious in Figure 7: for all three pairs of images there is a strong microlensing anomaly in the optical which gradually disappears towards longer wavelengths. This is precisely the behavior expected from the standard model of quasars: the source should be larger at longer wavelengths and thus less affected by microlensing.
3.4. Two-component model of flux ratios
Ideally we would like to use the microlensing flux ratios to constrain the size of the quasar as a function of wavelength; however, only weak constraints can be derived without a detection of time variability due to microlensing (Wyithe et al., 2002). Instead we use a semi-empirical model for the infrared SED to predict what the flux ratios should be as a function of wavelength and compare these predictions with the observed flux ratios to confirm the plausibility of this model.
We constructed a semi-empirical model for the flux ratios to compare to the observed IRAC flux ratios as follows. We assume that the spectrum consists of a power-law component due to an accretion disk (we are modeling the region from m which is well longward of the peak of the disk spectrum and is only a decade in frequency, so a power-law should be an adequate approximation of a disk spectrum) and a single-temperature thermal dust emission component, representing the inner edge of the a dusty torus. We fit the spectral energy distribution from 0.4 to 4.0 microns in the rest frame with these two components, determining their relative strength at each wavelength. The best fit is shown in Figure 8; the model provides a good fit to the four IRAC data points. We have not attempted to correct for microlensing, nor possible time-variability as the SED data are not simultaneous. However, this will likely have a small effect on the SED as summing over all four images reduces the impact of microlensing and in the infrared quasars are weakly variable.
With these two fits we determined the minimum possible source sizes to reproduce the observed flux with thermal emission as follows. For the power-law component, we assumed a disk geometry with a temperature that is a power-law in radius, , finding , and found that the half-light radius should scale with wavelength as
| (2) |
where is measured in microns in the rest frame of the quasar. At this radius the standard disk model is well outside the inner edge and thus is expected to have a temperature dependence of , which is close to the measured dependence. We assumed that the dust component either has an emissivity described by optically-thin interstellar medium (ISM) dust with the model of Draine (2003) or emits as an optically-thick blackbody (BB). These two extremes were chosen to bracket the range of possible behaviors for the hottest dust at the inner edge of the torus (we did not use the best-fit Fritz model due to the different peak wavelength). We found best-fit temperatures of the dust of 1168 K (ISM) or 1264 K (BB). This requires a minimum distance from the quasar of 3.83 pc (ISM) or 0.76 pc (BB) to maintain temperature equilibrium, assuming that the quasar emits isotropically. The total luminosity in this component is erg/s (ISM/BB) implying an emission region of at least 1.3 pc (ISM) or 2.2 pc (BB) in size, consistent with the radiation equilibrium argument within a factor of 3.
If the average mass of microlenses is 0.1 , then the Einstein radius is cm projected to the source plane. At one micron the power-law emission (if thermal) is comparable in size to an Einstein radius, while the dust emission component is about 200 times larger than the Einstein radius. Thus, the power-law component will be affected by microlensing, while the dust component should be nearly unaffected by microlensing, with variations of less than 1% (Refsdal and Stabell, 1991).
To model the microlensing of the power-law component, we extrapolate the wavelength dependence of the optical flux ratios measured with the VLT (Eigenbrod, Courbin, Sluse, Meylan and Agol, 2008) to the infrared. We correct the optical flux ratios for differential extinction using the E(B-V) values derived from broad emission lines, as described in section §3.1. Then, the expected flux ratio as a function of wavelength, , of images A and B is given by:
| (3) |
where are the magnifications of the power-law () and dust () components as a function of wavelength, are the intrinsic (un-magnified) fluxes of these two components, and are the optical depths through the lens galaxy for each component (we have dropped in this equation for simplicity).
Now, as argued above, the dust component should be large enough to be unaffected by microlensing, so can be derived from a model for microlensing. We utilize the model of Schmidt et al. (1998), improved upon by Trott and Webster (2002), with more recent modifications based on kinematic data (Trott et al., 2008). The relative strengths of the power-law and dust components we take from the model of the spectral energy distribution (Figure 8), ; as mentioned above; as the SED is constructed from the sum of all four images it should be affected only weakly by microlensing. Finally, the wavelength dependence of the microlensing magnification we take from the extinction-corrected optical flux ratios measured with the VLT, . For the extinction correction we assume a Milky Way extinction curve with . Dividing through the numerator and denominator by , we can rewrite the above equation as
| (4) |
The remaining unknown in this equation is since the microlensing magnification of the power law component for each image is unconstrained by our data. Fortunately the left hand side of this equation is weakly dependent on this ratio. We use the size distribution derived from the power-law emission spectrum (equation 2) to compute the probability distribution as a function of wavelength from microlensing simulations of each image using the macrolensing parameters from the model of Schmidt et al. (1998). We utilized the code of Wambsganss (1999) to run the simulations, creating 10 simulations for each image of a size , and then convolving the magnification pattern with a Gaussian source with the same half-light radius as derived in equation 2.
To predict the flux ratios at IRAC wavelengths, we have run Monte Carlo simulations sampling the relative extinction, the optical flux ratios, the galaxy macro-lensing model flux ratios, and the relative microlensing magnification for the two images within the uncertainties of each parameter. We have then computed the median and 68% confidence limits at each wavelength from these simulations, which is plotted in Figure 9, for the ratio of images B to A, as well as several other image pairs. We find good agreement between the model predictions and the observed flux ratios. For all but 3 flux ratios the data are within the 68% confidence limits of the model flux ratios. Thus the wavelength dependence of the flux ratios is consistent with the accretion disk/dusty torus model.


4. Discussion
The primary two results in this paper are: (1) a measurement of the infrared spectral energy distribution of the Einstein Cross; (2) a derivation of the infrared flux ratios in the mid-infrared (3.6, 4.5, 5.8 and 8.0 m observed; 1.3, 1.7, 2.2 and 3.0 m in the rest frame) and comparison to a microlensing model. We discuss the implications of these results in this section.
4.1. Comparison with prior work
Agol et al. (2000) observed of QSO 2237+0305 with the Long Wavelength Spectrometer on the Keck I telescope at 8.9 and 11.7 m; the flux ratios at these two wavelengths were identical within the errors, and both agreed with the macrolensing flux ratios as predicted by the best lens models. The flux at 11.7 m reported in that paper agrees well with our IRS spectrum; however, the 8.9m Keck data point is higher than the IRS data by about 40% indicating that the Keck data had an incorrect calibration. We have not tracked down the source of this discrepancy, but it cannot be due to microlensing which would have caused a difference in the flux ratios at 8.9 and 11.7m. We have more confidence in the calibration of the Spitzer spectrum; consequently the Keck flux at 8.9 m was likely in error. The qualitative agreement between the Spitzer SED and the Netzer composite indicates that QSO 2237+0305 behaves as a typical quasar in the near infrared.
4.2. QSO 2237+0305 SED
As mentioned above, the QSO spectral energy distribution, Figure 6, is qualitatively well fit with an AGN torus model from Fritz et al. (2006); however, the publicly available models have a fixed temperature for the inner edge of the torus at 1500 K which is somewhat higher than the temperature of the inner edge we have estimated (1164-1250 K). In addition, the silicate spectral features of the model are a poor fit to the SED, as is commonly seen in comparing dusty torus models to AGN SEDs (e.g. Nenkova et al., 2002). We have found that some Type II models (obscured quasar) fit the silicate feature well, having an offset silicate feature due to radiation transfer effects, while these models do not fit shorter wavelengths which are obscured. Thus, it may be possible that the dust composition and/or torus opening angle changes with radius causing the silicate feature to appear more like that of Type II quasars, while allowing the inner edge and quasar to be visible so that shorter wavelengths look more like a Type I quasar. Another possibility is that the silicate properties are modified near quasars, either due to changes in the grain size distribution or due to grain porosity, causing the silicate spectral features to be shifted (e.g. Voshchinnikov and Henning, 2008). Both possibilities need to be explored in future models of dust grain opacity, as well as computing better physical models for the dusty torus, such as Krolik (2007).
4.3. Microlensing, flux ratios, and spectral components
The agreement between the measured and predicted flux ratios is quite good, close to for all data points except one (Figure 9). The uncertainties in the flux ratio predictions are highly correlated between all wavelengths since microlensing and extinction have a monotonic variation with wavelength, so the case of the ratio of images C to B (for example) is still highly probable. It is clear from Figure 9 that an extrapolation of the optical power law (which can be seen shortward of 1 micron) does not do a good job of predicting the infrared flux ratios, while including the un-microlensed infrared bump due to dust emission brings the flux ratios back into agreement with the data (within one standard deviation). If the power-law component had a cutoff around one micron so that the infrared data were solely due to the extended dust emission, then the flux ratios would change abruptly to the macrolensed values. This is not the case for, e.g., the ratio of image D to image A, indicating that both the power-law and dust emission components are required to fit the IRAC data. This adds evidence to the case for the presence of an accretion disk emission component under the infrared bump.
By extrapolating the wavelength dependence of the microlensing flux ratios from the optical, we mostly avoided needing the size of the accretion disk in units of the Einstein radius. The only place the size of the accretion disk enters our analysis is in computing the flux ratios of the disk and torus components for each image in equation 4 (, and the same ratio for images ). However, this factor cancels out when either the disk or torus components dominate the flux, so our results are weakly sensitive to our choice of source size (equation 2) and Einstein radius ().
5. Conclusions
It has long been hypothesized (Sanders et al., 1989) that the near-universal dip near 1m in quasar spectral energy distributions is due to the cutoff in emission of the dusty torus at short wavelengths due to dust sublimation close to the quasar. Even if both the disk and dust emit as blackbodies, the disk emits at a higher temperature and has a smaller flux than the dust and thus is much more compact in size, by a factor of about at 1 m in the rest frame. The compact infrared disk emission should be more strongly affected by microlensing than the extended dusty torus infrared emission. This trend is confirmed by the wavelength dependence of the flux ratios in the IRAC bands for QSO 2237+0305 (Figure 9), and is in good quantitative agreement with our prediction of the wavelength dependence of the flux ratios assuming a two-component model, accretion disk plus dusty torus. Since the infrared SED of QSO 2237+0305 looks very similar to a standard quasar and similar to some low redshift Seyferts (Figures 4 and 5), this result confirms the model that quasars contain an accretion disk and dusty torus. Indeed, a similar behavior of the flux ratios was found for the two-image lensed quasar HE 1104-1805 by Poindexter et al. (2007) with optical, near-infrared and Spitzer observations: in the infrared the microlensing anomalies disappear. Poindexter et al. (2008) modeled the source size for this quasar as a power-law with wavelength rather than with a two-component model; due to the lack of variability at the IRAC wavelengths their derived size of cm is actually a lower limit on the source size, and thus is consistent with a dusty torus model. Unified models for active galaxies (e.g. Antonucci, 1993) require a dusty torus for obscuration of low-polarization Type I AGN to create higher polarization Type II AGN, while our result provides additional evidence for the unified model in an unobscured quasar.
Recently Kishimoto et al. (2008) have demonstrated the co-existence of the accretion disk and dusty torus components near one micron using infrared spectropolarimetry. In total flux the accretion disk component is masked by the stronger unpolarized thermal dust emission at wavelengths longer than m. Since the accretion disk is emitted from a small scale, it can be polarized by scattering off of gas within the dusty torus, while the thermal emission from the dusty torus is unpolarized since it is exterior to the scattering region. Kishimoto et al. (2008) have detected a polarized component with a power-law shape which extends into the infrared, which they identify with polarized emission from the accretion disk, thus demonstrating the contribution from both the disk and torus near the one micron dip. Our results provide a complementary confirmation of the results of Kishimoto et al. (2008).
There are two primary areas which require improvement over the current work: (1) time-dependent monitoring at a broad range of wavelengths to derive the relative size versus wavelength from the microlensing, rather than deriving a size versus wavelength from the SED and then predicting the microlensing behavior as we have done; (2) computing physically complete dusty torus SEDs coupled to accretion disk models.
6. Acknowledgements
This work is based in part on observations made with the Spitzer Space Telescope, which is operated by the Jet Propulsion Laboratory, California Institute of Technology under a contract with NASA. Support for this work was provided by NASA through an award issued by JPL/Caltech. EA acknowledges the hospitality of the Institute for Theory and Computation at the Harvard-Smithsonian Center for Astrophysics where a portion of this work was completed. The authors would like to thank Ski Antonucci, Z̆eljko Ivezić, Chris Kochanek, and Julian Krolik, for helpful discussions. We thank Chris Kochanek for providing a deconvolved -band image from the CASTLES database and Jacopo Fritz for providing the grid of dusty torus models from his paper. We thank the OGLE collaboration for making their data on Q2237+0305 available on their web site. We thank Joachim Wambsganss for sharing his code for simulating microlensing by random star fields and a helpful referee report. We thank Alex Eigenbrod for sharing the wavelength dependent flux ratios measured with VLT. We thank Cathy Trott for sharing her model prediction for the flux ratios prior to publication. We thank Bruce Draine for making his ISM dust opacity model available on his web site.
References
- (1)
- Agol et al. (2000) Agol E, Jones B and Blaes O 2000 ApJ 545, 657–663.
- Anguita et al. (2008) Anguita T, Schmidt R W, Turner E L, Wambsganss J, Webster R L, Loomis K A, Long D and McMillan R 2008 A&A 480, 327–334.
- Antonucci (1993) Antonucci R 1993 ARA&A 31, 473–521.
- Barvainis (1993) Barvainis R 1993 ApJ 412, 513–523.
- Barvainis and Ivison (2002) Barvainis R and Ivison R 2002 ApJ 571, 712–720.
- Blaes et al. (2001) Blaes O, Hubeny I, Agol E and Krolik J H 2001 ApJ 563, 560–568.
- Czerny et al. (1994) Czerny B, Jaroszynski M and Czerny M 1994 MNRAS 268, 135–+.
- Dai et al. (2003) Dai X, Chartas G, Agol E, Bautz M W and Garmire G P 2003 ApJ 589, 100–110.
- Draine (2003) Draine B T 2003 ApJ 598, 1017–1025.
- Dunkley et al. (2008) Dunkley J, Komatsu E, Nolta M R, Spergel D N, Larson D, Hinshaw G, Page L, Bennett C L, Gold B, Jarosik N, Weiland J L, Halpern M, Hill R S, Kogut A, Limon M, Meyer S S, Tucker G S, Wollack E and Wright E L 2008 ArXiv e-prints 803.
- Eigenbrod, Courbin, Meylan, Agol, Anguita, Schmidt and Wambsganss (2008) Eigenbrod A, Courbin F, Meylan G, Agol E, Anguita T, Schmidt R W and Wambsganss J 2008 A&A 490, 933–943.
- Eigenbrod, Courbin, Sluse, Meylan and Agol (2008) Eigenbrod A, Courbin F, Sluse D, Meylan G and Agol E 2008 A&A 480, 647–661.
- Elvis et al. (1994) Elvis M, Wilkes B J, McDowell J C, Green R F, Bechtold J, Willner S P, Oey M S, Polomski E and Cutri R 1994 ApJS 95, 1–68.
- Falco et al. (2001) Falco E E, Kochanek C S, Lehár J, McLeod B A, Muñoz J A, Impey C D, Keeton C, Peng C Y and Rix H W 2001 in T. G Brainerd and C. S Kochanek, eds, ‘Gravitational Lensing: Recent Progress and Future Go’ Vol. 237 of Astronomical Society of the Pacific Conference Series pp. 25–+.
- Fazio et al. (2004) Fazio G G, Hora J L, Allen L E, Ashby M L N, Barmby P, Deutsch L K, Huang J S, Kleiner S, Marengo M, Megeath S T, Melnick G J, Pahre M A, Patten B M, Polizotti J, Smith H A, Taylor R S, Wang Z, Willner S P, Hoffmann W F, Pipher J L, Forrest W J, McMurty C W, McCreight C R, McKelvey M E, McMurray R E, Koch D G, Moseley S H, Arendt R G, Mentzell J E, Marx C T, Losch P, Mayman P, Eichhorn W, Krebs D, Jhabvala M, Gezari D Y, Fixsen D J, Flores J, Shakoorzadeh K, Jungo R, Hakun C, Workman L, Karpati G, Kichak R, Whitley R, Mann S, Tollestrup E V, Eisenhardt P, Stern D, Gorjian V, Bhattacharya B, Carey S, Nelson B O, Glaccum W J, Lacy M, Lowrance P J, Laine S, Reach W T, Stauffer J A, Surace J A, Wilson G, Wright E L, Hoffman A, Domingo G and Cohen M 2004 ApJS 154, 10–17.
- Fritz et al. (2006) Fritz J, Franceschini A and Hatziminaoglou E 2006 MNRAS 366, 767–786.
- Higdon et al. (2004) Higdon S J U, Devost D, Higdon J L, Brandl B R, Houck J R, Hall P, Barry D, Charmandaris V, Smith J D T, Sloan G C and Green J 2004 PASP 116, 975–984.
- Houck et al. (2004) Houck J R, Roellig T L, van Cleve J, Forrest W J, Herter T, Lawrence C R, Matthews K, Reitsema H J, Soifer B T, Watson D M, Weedman D, Huisjen M, Troeltzsch J, Barry D J, Bernard-Salas J, Blacken C E, Brandl B R, Charmandaris V, Devost D, Gull G E, Hall P, Henderson C P, Higdon S J U, Pirger B E, Schoenwald J, Sloan G C, Uchida K I, Appleton P N, Armus L, Burgdorf M J, Fajardo-Acosta S B, Grillmair C J, Ingalls J G, Morris P W and Teplitz H I 2004 ApJS 154, 18–24.
- Huchra et al. (1985) Huchra J, Gorenstein M, Kent S, Shapiro I, Smith G, Horine E and Perley R 1985 AJ 90, 691–696.
- Irwin et al. (1989) Irwin M J, Webster R L, Hewett P C, Corrigan R T and Jedrzejewski R I 1989 AJ 98, 1989–1994.
- Kishimoto et al. (2008) Kishimoto M, Antonucci R, Blaes O, Lawrence A, Boisson C, Albrecht M and Leipski C 2008 Nature 454, 492–494.
- Kochanek (2004) Kochanek C S 2004 ApJ 605, 58–77.
- Kochanek et al. (2009) Kochanek C S, Falco E E, Impey C, Lehar J, McLeod B and Rix H W 2009 ‘Castles survey’. http://www.cfa.harvard.edu/glensdata/.
- Krolik (2007) Krolik J H 2007 ApJ 661, 52–59.
- Laor and Draine (1993) Laor A and Draine B T 1993 ApJ 402, 441–468.
- Lynden-Bell (1969) Lynden-Bell D 1969 Nature 223, 690–+.
- Malkan (1983) Malkan M A 1983 ApJ 268, 582–590.
- Martin et al. (2005) Martin D C, Fanson J, Schiminovich D, Morrissey P, Friedman P G, Barlow T A, Conrow T, Grange R, Jelinsky P N, Milliard B, Siegmund O H W, Bianchi L, Byun Y I, Donas J, Forster K, Heckman T M, Lee Y W, Madore B F, Malina R F, Neff S G, Rich R M, Small T, Surber F, Szalay A S, Welsh B and Wyder T K 2005 ApJ 619, L1–L6.
- Mathis et al. (1977) Mathis J S, Rumpl W and Nordsieck K H 1977 ApJ 217, 425–433.
- Morgan et al. (2007) Morgan C W, Kochanek C S, Morgan N D and Falco E E 2007 ArXiv e-prints .
- Nenkova et al. (2002) Nenkova M, Ivezić Ž and Elitzur M 2002 ApJ 570, L9–L12.
- Netzer et al. (2007) Netzer H, Lutz D, Schweitzer M, Contursi A, Sturm E, Tacconi L J, Veilleux S, Kim D C, Rupke D, Baker A J, Dasyra K, Mazzarella J and Lord S 2007 ApJ 666, 806–816.
- Poindexter et al. (2008) Poindexter S, Morgan N and Kochanek C S 2008 ApJ 673, 34–38.
- Poindexter et al. (2007) Poindexter S, Morgan N, Kochanek C S and Falco E E 2007 ApJ 660, 146–151.
- Pooley et al. (2007) Pooley D, Blackburne J A, Rappaport S and Schechter P L 2007 ApJ 661, 19–29.
- Rauch and Blandford (1991) Rauch K P and Blandford R D 1991 ApJ 381, L39–L42.
- Refsdal and Stabell (1991) Refsdal S and Stabell R 1991 A&A 250, 62–66.
- Sanders et al. (1989) Sanders D B, Phinney E S, Neugebauer G, Soifer B T and Matthews K 1989 ApJ 347, 29–51.
- Schmidt et al. (1998) Schmidt R, Webster R L and Lewis G F 1998 MNRAS 295, 488–+.
- Shields (1978) Shields G A 1978 Nature 272, 706–708.
- Tegmark et al. (2004) Tegmark M, Strauss M A, Blanton M R, Abazajian K, Dodelson S, Sandvik H, Wang X, Weinberg D H, Zehavi I, Bahcall N A, Hoyle F, Schlegel D, Scoccimarro R, Vogeley M S, Berlind A, Budavari T, Connolly A, Eisenstein D J, Finkbeiner D, Frieman J A, Gunn J E, Hui L, Jain B, Johnston D, Kent S, Lin H, Nakajima R, Nichol R C, Ostriker J P, Pope A, Scranton R, Seljak U, Sheth R K, Stebbins A, Szalay A S, Szapudi I, Xu Y, Annis J, Brinkmann J, Burles S, Castander F J, Csabai I, Loveday J, Doi M, Fukugita M, Gillespie B, Hennessy G, Hogg D W, Ivezić Ž, Knapp G R, Lamb D Q, Lee B C, Lupton R H, McKay T A, Kunszt P, Munn J A, O’Connell L, Peoples J, Pier J R, Richmond M, Rockosi C, Schneider D P, Stoughton C, Tucker D L, vanden Berk D E, Yanny B and York D G 2004 Phys. Rev. D 69(10), 103501–+.
- Trott et al. (2008) Trott C M, Treu T, Koopmans L V E and Webster R L 2008 ArXiv e-prints .
- Trott and Webster (2002) Trott C M and Webster R L 2002 MNRAS 334, 621–630.
- Udalski et al. (2006) Udalski A, Szymanski M K, Kubiak M, Pietrzynski G, Soszynski I, Zebrun K, Szewczyk O, Wyrzykowski L, Ulaczyk K and Wiêckowski T 2006 Acta Astronomica 56, 293–305.
- Voshchinnikov and Henning (2008) Voshchinnikov N V and Henning T 2008 A&A 483, L9–L12.
- Wambsganss (1999) Wambsganss J 1999 Journal of Computational and Applied Mathematics 109, 353–372.
- Wambsganss and Paczynski (1991) Wambsganss J and Paczynski B 1991 AJ 102, 864–868.
- Wambsganss et al. (1990) Wambsganss J, Paczynski B and Schneider P 1990 ApJ 358, L33–L36.
- Woźniak et al. (2000) Woźniak P R, Alard C, Udalski A, Szymański M, Kubiak M, Pietrzyński G and Zebruń K 2000 ApJ 529, 88–92.
- Wyithe et al. (2002) Wyithe J S B, Agol E and Fluke C J 2002 MNRAS 331, 1041–1052.
- Wyithe et al. (2000) Wyithe J S B, Webster R L, Turner E L and Mortlock D J 2000 MNRAS 315, 62–68.